Sive Morten
Special Consultant to the FPA
- Messages
- 18,644
Fundamentals
Although it seems on the surface that crisis is past it's peak, there are many undercurrents still. I think that risk aversion will continue in nearest future and it will remain a dominate driver of trade. USD and JPY will be in favor compared to other currencies. But what is a more important for us is that trading will become more choppy and unpredictable due to possible Central Banks interventions.
I think that great reassessment of the global recovery is underway – we all see how commodity currencies were hit and those who associate them with recovery (commodity prices should grow when the economy recovers, so should commodity currencies) and investing in them will have to revaluates their positions and may be even to capitulate. To my mind this cloudless optimism about the world economic recovery that was spreading in the air a month ago has disappeared. So, let’s talk about Europe. What are the positive signs? Germany has approved its stake in he Euro rescue package; it shows somehow that probably EU leaders really what to preserve EUR and EU itself. The population, in general, supports austerity measures. Maybe due permanent short term successes we even will see some upward bounces on EUR/USD. But what is on the other side? First, we can forget about previous estimations of ECB tightening and EU economic recovery pace. I expect that there will be some release for the EUR while investors will switch their attention from the EU crisis impact on the world economy to impact on EU countries themselves. And when this switching will be finished, fundamentals will take a lead. I do not await any positives from this switching. The EUR should go down further. There will be no panic, it will be a gradual strong pressing move downwards. And I will not be very surprised if I’ll see ECB interventions in the near term. The SNB has made it absolutely public, ECB can join to SNB, or it can act alone, this is not the point. The point is that I expect that we’ll see it. EU officials have more concern with the pace of decline of the EUR rather than its real value. BoJ also can return to this practice because Japan's economy is a pure export one and exporters are already starting to grumble.
And what are the possible consequences for other countries? First, it’s obvious that we can’t escape the second leg of the recession. It’s underway now. Second, the current EU crisis can lead to scrutiny assessment of other countries that have solid Debt/GDP ratios. When this assessment will be done, this crisis can spread like a fire in the forest. I think that the UK is the next country. The US will be the last country. Meantime, US has to pay on debts of about 2 trln. in 2010 only. But the USD is a world reserve currency, US in fact has no currency risk, because they issue USD and formally can print as many as they need. The whole world depends on USD, it uses it in international trading etc. At the same time, possible banking reforms in the US and EU can lead to serious negative impact on banking development, credits and loans etc. But all this stuff is too long-term to talk about it right now.
As a conclusion I what to say following thoughts:
- I expect possible ECB interventions in foreseeable future;
- Fundamentals will take a lead role and will start to gradually press on th EUR, while the first shock has passed;
- Investors will switch their attention from the World economy to particular countries that are in the epicenter of a crisis. Starting to do this, it can lead to scrutiny analysis of other countries with large Debt/GDP ratio and possibly the next currency under this scrutiny will be the GBP.
Technical
Monthly
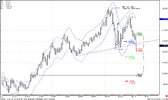
This is a monthly chart. The trend is still bearish. I’ve told everyone a million of times, that although market is extremely oversold, it should go lower and clear stops below 1.2330. Finally we saw this and the market has started to show some signs of retracement higher. Surely we do not see it on monthly chart, because it rather long-term, but we can see that market has bounced from Fib support level at 1.2197 and extreme oversold level. So, long term traders can look for Buy signals on lower-term frames. In fact, this huge move down was not a simple down trend, it was and it is still run into quality and it becomes calmer because starting panic has lost its pace. But if we’ll look at the previous pullback – it was very strong and potentially, we can see similar picture – retracement as far as to 1.35 level. But for now it’s just an assumption that is based on quality of down move and its fundamentals.
Weekly
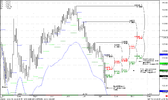
This is a weekly chart. We have strong bearish trend. The market has bounced up from Fib support after previous lows were Washed and Rinsed. So, this is potentially a bullish sign. There are two strong resistances on the weekly chart, that can be achieved in nearest couple of weeks 1.2780 area, Fib resistance and monthly support 2 level and, stronger one – 1.3070-1.31 Fib confluence resistance and Pivot support 1 level. At the same time, it is worth noting here that the previous move down was strong and I will not be very surprised if the market will show new lows after small retracements. I do not want to tell that it will be anyway, but it happens very often.
Daily
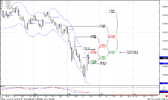
This is a daily chart. The trend turns bullish. Although I do not see any particular signal at monthly and weekly, but daily gives us some possibility to trade. First of all, we see a strong upwards move, but for now I do not want to buy. There are three reasons for this. First, the market is at daily overbought and Fib resistance at 1.2600. Second, the weekly Pivot for the current week is at 1.2467 level and as I’ve said many times, pivot points are traded during the period with solid probability. And third, from a tactical point of view, I do not buy the first pull back, because market mechanics tells me that during first pullback new shorts will be entering the market. That’s why I will try to sell in the beginning of the week, in fact I already have short position that I’ve opened on Friday. At the same time there is a risk, associated with this. Usually, when market is extremely oversold on weekly and monthly time frames, it can show stronger pull backs up before new down move. Although I’ve sold already from 1. 2550 area when market has moved below the weekly pivot at 1.2613 and made not bad thrust down on Friday, it can still reach 1.2730-1.2780 area and only after that can restart the down move. The possible target for that move is 1.2355-1.2370 area. The final target depends on the level from which the down move will start.
That’s being said – no buy on Monday, even may be on Tuesday, sell from current levels, if market will renew down move. If it will go upper 1.2620, then sell from 1.2730-1.2780 area. Target 1.2350-1.2400 area. The real buy signal should appear at the end of the week, or even during the next one.
4-Hour
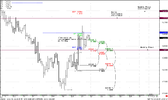
This time frame adds some details for Monday possible action. I’ve marked 1.2350 area when I’ve sold on Friday. I do not want to tell that I was right, especially now, because the market does not show any down move development. Anyway, I just want to attract your attention to some moments. Fist, the 1.2470 level looks strong – Confluence support and weekly Pivot point. If the market will not pass through it on Monday, then an up reversal and move to 1.2730-1.2780 will be very probable. In this case, a down move can start from this area – 1.2730-1.2780. Here are daily confluence resistance, XOP target and weekly Pivot resistance 1.
As conclusion – if the market will move below 1.2470 target at 1.2355 will be probably achieved. If not – I’ll be waiting for move to 1. 2750-1.2780 and wait for sell signals there.
Attachments
Last edited:


