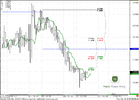
Euro Forex Pro weekly, August 30 - September 3, 2010

I was long, and then short, and loose in both ways! lol I think we are in a critical time, but we need some definition. Long still be a possibility.

Yeah right now it is going up and down around pp. I sold GBP instead just now. It's moving well. Usually majors move together but it's not definite.

And you are entering too quick. I see no signal on the hourly chart to enter for EUR so I did not enter. I realised a lot of people posted in this forum enter as soon as the price is hit rather than waiting for candles to close for confirmation before entering. By doing so there is a lot of risk, you are taking on a big gamble. I usually use 1hr chart to look for signal and sometimes 4hrs depending on situation certain times 30mins but less seldom as lower time frames always give wrong signal.

whats the basis of your trade mandrake? short on gbp?
 
whats the basis of your trade mandrake? short on gbp?

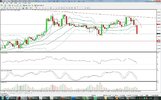
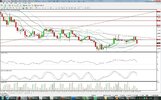
GBP had trendline which you can see on the 4hr chart. During the past few hours it touched and hover around but did not close above, it also touched boilinger band deviation 2 before the bounce back. 4hr chart showed a touched and close below trendline. I switched to hourly chart for signal for short entry.

On hourly chart you can see there are 2 evening stars followed by a red candle which closed more than half way down the long green candle before the stars. I entered here.

Stochastics crossed over also suggest a trend change.

I have attached pictures of both 1hr and 4hr. I hope it helps.
 

Attachments

  • GBP 1hr.jpg
    GBP 1hr.jpg
    196.4 KB · Views: 135
  • GBP 4hr.jpg
    GBP 4hr.jpg
    213.3 KB · Views: 136
GBP had trendline which you can see on the 4hr chart. During the past few hours it touched and hover around but did not close above, it also touched boilinger band deviation 2 before the bounce back. 4hr chart showed a touched and close below trendline. I switched to hourly chart for signal for short entry.

On hourly chart you can see there are 2 evening stars followed by a red candle which closed more than half way down the long green candle before the stars. I entered here.

Stochastics crossed over also suggest a trend change.

I have attached pictures of both 1hr and 4hr. I hope it helps.

thank you, great info.

i want to short on eur usd. i am waiting for hour close to enter on confirmation
 
thank you, great info.

i want to short on eur usd. i am waiting for hour close to enter on confirmation

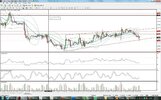
Hmm... Well I'm not sure about you but I don't like to short EUR anymore. Firstly there is a wedge and hourly just closed as I am typing this, it did not close below the trendline. On top of that, from around 1.2586 - 1.2670 there is a lot of previous lows, I definitely don't like that. And the down move has started many hours ago.

I feel this is a fish that is better to let it go even if it is gonna go down. Prefer to wait for retracement up and sell down again. If you came from the top just now and you have many pips in profit you can try to see whether it will break downwards further if there is a reversal you can still take out some profits but entering now you might lose money. Currently for EUR I will only short if there is super strong momentum pushing it down every second, which I don't think can happen.

Conclusion: I think it might be too late for entry now. And there might be reversal. I am monitoring my GBP to see whether I'm gonna close it before I go to sleep in a while.

I have also attached a picture of hourly chart for EUR for your viewing on what I have here. It is quite messy though, hope it helps. :p
 

Attachments

  • EUR 1hr.jpg
    EUR 1hr.jpg
    220.7 KB · Views: 133
Yeah right now it is going up and down around pp. I sold GBP instead just now. It's moving well. Usually majors move together but it's not definite.

And you are entering too quick. I see no signal on the hourly chart to enter for EUR so I did not enter. I realised a lot of people posted in this forum enter as soon as the price is hit rather than waiting for candles to close for confirmation before entering. By doing so there is a lot of risk, you are taking on a big gamble. I usually use 1hr chart to look for signal and sometimes 4hrs depending on situation certain times 30mins but less seldom as lower time frames always give wrong signal.
What can I say my friend, I think you are right!
So today was too much confidence and completely loss day.

I guess I need some master some system first, and stick with it. Is there any harmonic trade system that one recommends following?
Would like to try one with a signal or semi-automatic system. Accept recommendations! ;)

People always look for a system. But I think you need to throw a lot of things in your arson at forex. It is more about experience and learning as much as you can, than using some of the technicals that you think works great for you. If you see my chart it is a bit messy but it works for me.

The most important is knowing japanese candle sticks. You can read books from Steve Nison, I think he is the first guy who bought japanese candle sticks to the world. He said he started at like 12 BC. Of course, everyone knows that BC means "Before Candle" sticks. lol

Sive did posted recommended readings on the 1st page, so you can go back and check it out.

So learn what you can. Use what works for you.

Oh ya one more thing: signals during high volume timing is more accurate. Roughly from European market opening to London market closing.
 
Last edited:
EUR/USD Daily Update, Tue 31, August

Hello, everybody.

Market didn't show any sign of thrust yesterday from weekly pivot point, so we had no reason to enter Long the market. Hope you've done well and didn't Buy.

Now we have not bad very short-term context - possibility of a Double Repo or B&B trade. Look at hourly chart - excellent thrust down, close above 3x3 SMA (the green line). The strong resistance just above the market is 1.2684 area. IF B&B trade should started, I think It will start from there.
If market will not reach this area - then, possibly we can see a context for DRPO trade. We have close above 3x3, now we need close below (if it will be new lows- much better) then close above as a confirmation bar. In this case -the target is the same area of confluence resistance. Just make sure that there are not many bars between first close above 3x3 and second one.
If we will not see close second above 3x3 - we should not enter on the Long side of the market.
 

Attachments

  • EUR_USD_1H_31_08_10.PNG
    EUR_USD_1H_31_08_10.PNG
    43.6 KB · Views: 102
Demo account closed

Sive, I have noticed that the demo account for your trades is closed. are you planning to do another round? It was amazint to see you make trades in real time. Never seen anything like it. Good job.

Rasto
 
Sive, I have noticed that the demo account for your trades is closed. are you planning to do another round? It was amazint to see you make trades in real time. Never seen anything like it. Good job.

Rasto

Hi Rasto,
we are in process of shifting to small real account, rather than demo.
 
Back
Top