Sive Morten
Special Consultant to the FPA
- Messages
- 18,639
Quarterly
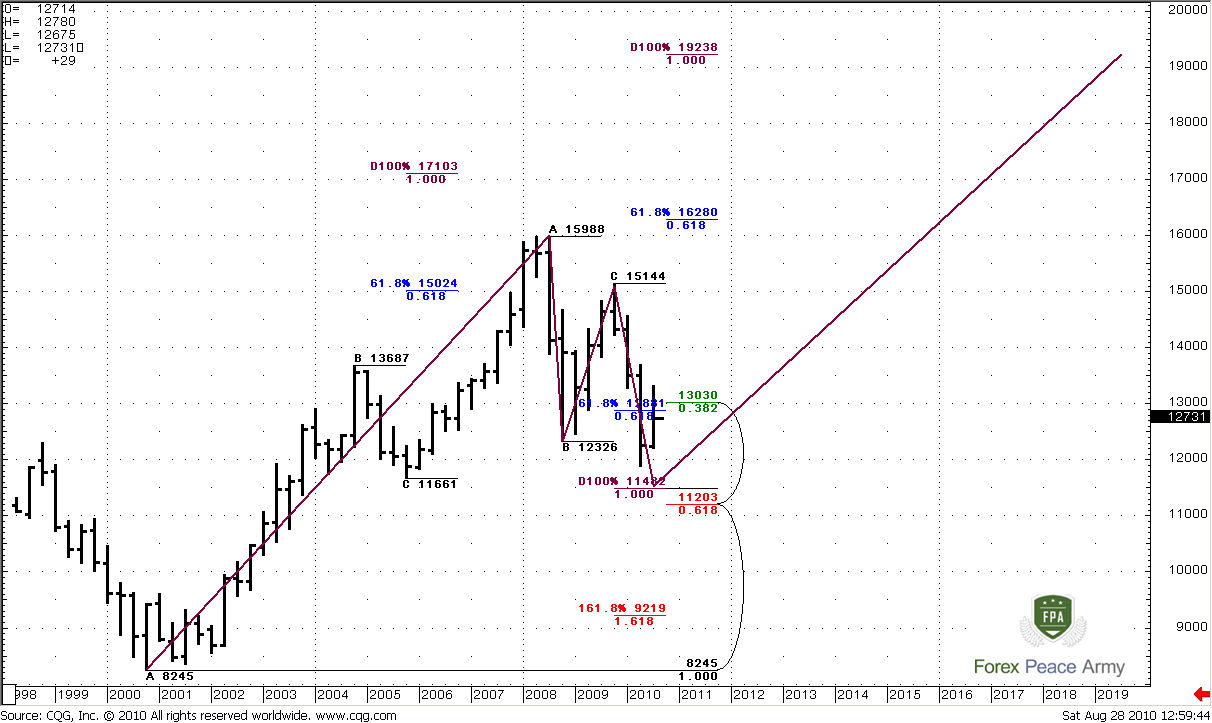
There are not much new on a monthly chart, that’s why I want you to show the very big picture of current events – quarterly chart. It’s really interesting. First of all, during early ABC-bottom move market has reached 61.8% expansion and turned to nice AB-CD retracement. Now, as you understand we are in CD leg. This AB-CD move harmonic enough to speak about possible reversal to the upside in D point around 1.14 area. This is also a Fib support that gives us an Agreement in 1.1380-1.1480. Besides, take a note that this area is below previous C=1.1661, so if it will be reached, we should treat the initial move up not as ABCD but as AB move rather. In this case we will get a huge ABCD pattern: A=0.8245, B=1.5988, C=1.1480 and D =1.9238.
Most interesting for us now is AB-CD correction to the downside. Market has reached 61.8% expansion at 1.2881 and passed through it. Now it has started retracement to the upside. Theoretically speaking, after reaching 61.8% market should not show deep retracement, it should not return higher than 1.30-1.31 area. And soon market should continue it’s move to 1.14-1.15 target, because, again, this AB-CD looks harmonic, and if market has moved below 61.8% already, in most cases it reaches target at D point – 100% expansion from AB leg.
But this is a very large picture, and obvious that we can’t trade it. Nevertheless, to see the large picture is useful for understanding of current situation.
Monthly
I leave part of monthly analysis intact, because there is nothing to add really new to it.
Trend is bearish; market has pierced 1.3123 area and pulled back. For now it looks like wash & rinse of this level, but current month is not closed yet.
The blue line is a lower border of DiNapoli Oscillator Predictor. When market touches it or even pierces – it means that market is oversold. In 2008 market was extremely oversold compares to 2010, when market just touched the line. That’s why I see current level of retracement to 1.33 area as logical. If you remember, I’ve told that market should show 0.382 or 0.5 retracement up, because it not so oversold as in 2008, when it has shown 0.618 retracement to the upside. So, now market has reached semi-position between 0.382 and 0.5. If market will continue up move, then the next resistance is roughly 1.35area.
1.26-1.2650 area is still in play. It has held the market during the previous week and still holds it. This is 50% retracement of a strong up bar and also a previous point of extremes. Market has touched it very often since 2004. Price action often found support or resistance at this level.
Another interesting picture is a butterfly on a monthly chart with the nearest target around 1.050 area. Also take a note that 1.27 ABCD target is also in this area
Weekly
During the previous weeks we’ve discussed when the momentum trade will start on EUR. The green line is 3-period simple moving average shifted forward for 3 period. Previous thrust down was really strong, so, probability suggests that after first retracement up we can count on some continuation of down move. I thought that it will start from 1.3120 area (this was a weekly Confluence resistance area, as you remember), but market has penetrated it a bit, reached monthly pivot resistance1 and then collapsed. We’ve received very solid bearish engulfing that engulfs 3 previous weeks of action. The target of this momentum trade is 1.2430 area, and I think that It should be reached.
At the same time, previous thrust up also is not bad (although it looks poorer on daily chart). It consists of 8 up candles and shows good separation from 3x3 SMA. And due to these circumstances one thing is worry me. Will the smaller momentum trade take place in nearest future, or not? I want to remind you that in previous research I’ve told you that we should carefully watch for 1.26 area of strong support. Now the situation of weekly chart is very near to perfect, in sense of context for momentum trade to the up side – market has shown thrust up, we have 3 closes below 3x3 SMA, market has reached strong support at 1.26 area and created a hammer. One thing that I concern about is an initial thrust up. Usually I like to see greater and longer thrust for momentum trade, but current thrust has sufficient number of bars, some bars are really strong, many bars closed at extreme. I suggest that this should be enough. The target of this trade – 1.3050 area.
That’s being said, the minimum target of starting move down is 1.2450 area- 0.618 Fib support and monthly pivot support 1. But, there is still a possibility for smaller momentum trade in upper direction, because of previous thrust up. And I think that this smaller trade should take place during next week. The major beacon – monthly pivot point at 1.2786 area (gold dash line on the chart). If market will pass through it to the upside, then the target – 1.3050. This possible trade up will not cancel the major momentum trade and will be look like retracement in bigger trade.
Daily
This time frame is very interesting currently. According to weekly analysis upper momentum trade is very probable, with the target around 1.3050. The key target here will be 1.2780-1.2816 area. This is a very strong resistance that includes daily confluence resistance area, weekly pivot resistance 1, monthly pivot point and previous lows. If market will break it – the road to 1.3050 will be opened.
On the chart I draw one of the possible scenarios on the market – reverse H&S pattern. Of cause, this is just an assumption, but it based on some factors. First detail is as follows – look at the left shoulder and the head. Head is precisely 1.618 expansion of shoulder and this is the most typical ratio for H&S. AS you remember this was a target of 1.618 intraday butterfly pattern. The next factor is a strong support that we are talking about. I expect that if market will break it, it will be like explosion, because I think that there are a lot of Buy stops just above this area. It will lead the market right to the 1.2890 area – weekly pivot resistance 2 where retracement possible will start.
From the other side, if market will not be able to break 1.28 area – it will mean that possibly we will see stronger down move. As I’ve said 1.28 is a beacon.
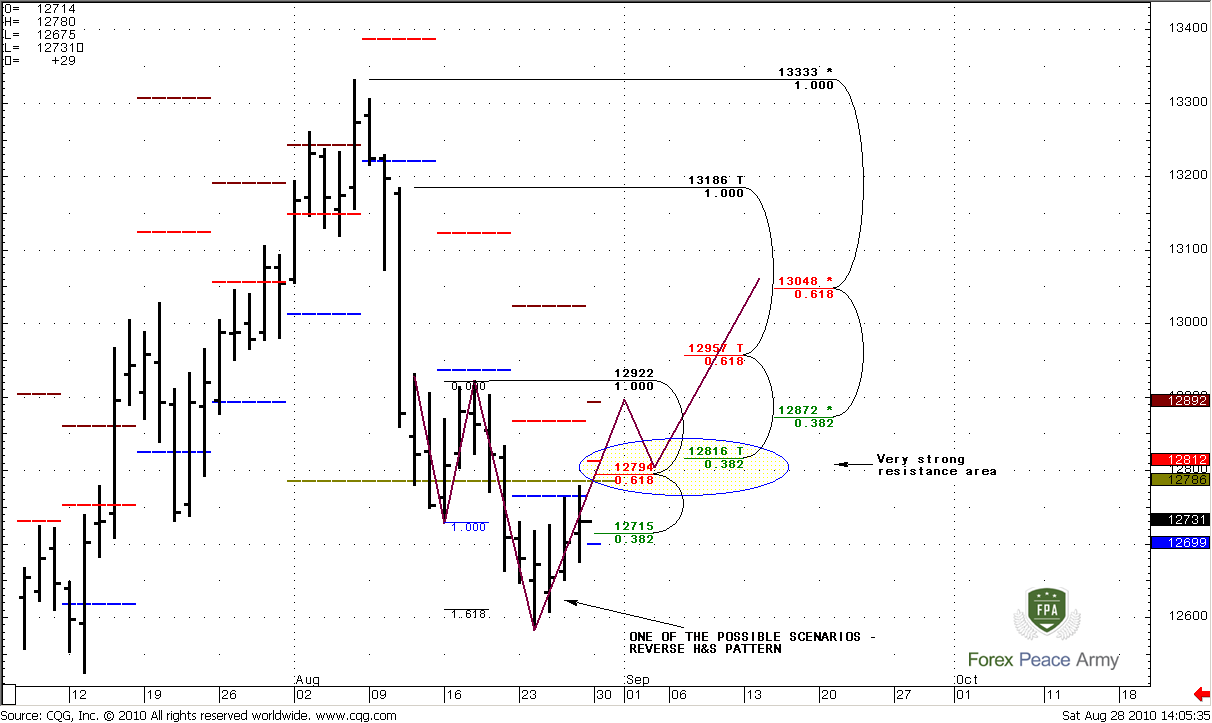
We have at least to possibility to enter the market on the next week. One is based on hourly chart, another one is based on daily. Daily possibility assumes enter the market after breaking 1.28 and reaching 1.29 area on the retracement to 1.2820, so that the left shoulder could be formed. So, based on my chart – we should enter Long on the low area of right shoulder. But there is more delicate enter also exist. Let’s move to hourly chart.
1-Hour
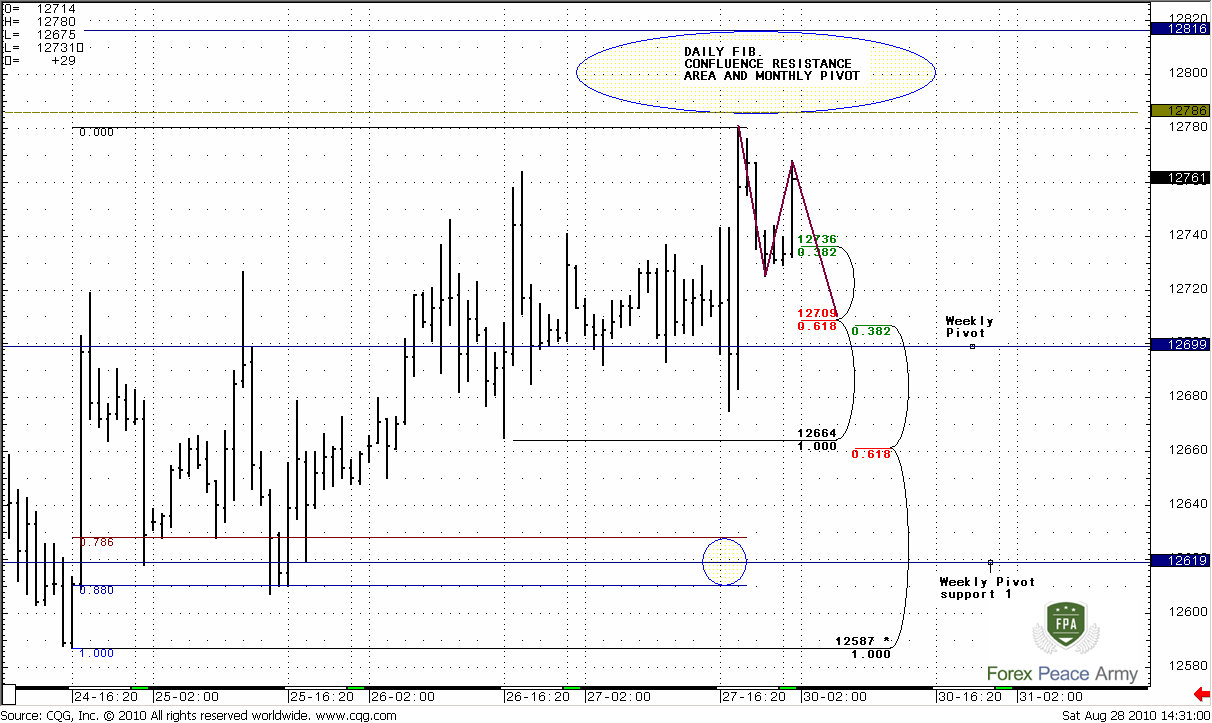
As usual, in this part of research we discuss the trading plan for the Monday. And, in general, till this point, we expect the signs of upper breakout on the market. Hourly analysis will help us to create a position that will be safe from the one side, and let us possess ourselves to possible breakout from the other. Ok, how it works…
First of all, you have to catch important moment. If bulls are really strong – 1.27 area should hold. This area includes hourly confluence support area and weekly pivot point. On Monday, look for any retracement to this area. It should be not like free fall; it should be like AB-CD and has symmetry. Anyway, wait until market will flirt with this area. If this area will hold and we will see some signs of strength from it – we can Buy. If market will break it to the downside – don’t be long.
If our scenario will take place and market will start to rise from 1.27 – after some time move s/l to b/e. It will allow you to take part it breaking the daily resistance area. Because if market will fail there – you will loose nothing, but if it succeed - you will win a lot, and market will reach 1.29 area. This is a strategy for Monday.
The technical portion of Sive's analysis owes a great deal to Joe DiNapoli's methods, and uses a number of Joe's proprietary indicators. Please note that Sive's analysis is his own view of the market and is not endorsed by Joe DiNapoli or any related companies.
There are not much new on a monthly chart, that’s why I want you to show the very big picture of current events – quarterly chart. It’s really interesting. First of all, during early ABC-bottom move market has reached 61.8% expansion and turned to nice AB-CD retracement. Now, as you understand we are in CD leg. This AB-CD move harmonic enough to speak about possible reversal to the upside in D point around 1.14 area. This is also a Fib support that gives us an Agreement in 1.1380-1.1480. Besides, take a note that this area is below previous C=1.1661, so if it will be reached, we should treat the initial move up not as ABCD but as AB move rather. In this case we will get a huge ABCD pattern: A=0.8245, B=1.5988, C=1.1480 and D =1.9238.
Most interesting for us now is AB-CD correction to the downside. Market has reached 61.8% expansion at 1.2881 and passed through it. Now it has started retracement to the upside. Theoretically speaking, after reaching 61.8% market should not show deep retracement, it should not return higher than 1.30-1.31 area. And soon market should continue it’s move to 1.14-1.15 target, because, again, this AB-CD looks harmonic, and if market has moved below 61.8% already, in most cases it reaches target at D point – 100% expansion from AB leg.
But this is a very large picture, and obvious that we can’t trade it. Nevertheless, to see the large picture is useful for understanding of current situation.
Monthly
I leave part of monthly analysis intact, because there is nothing to add really new to it.
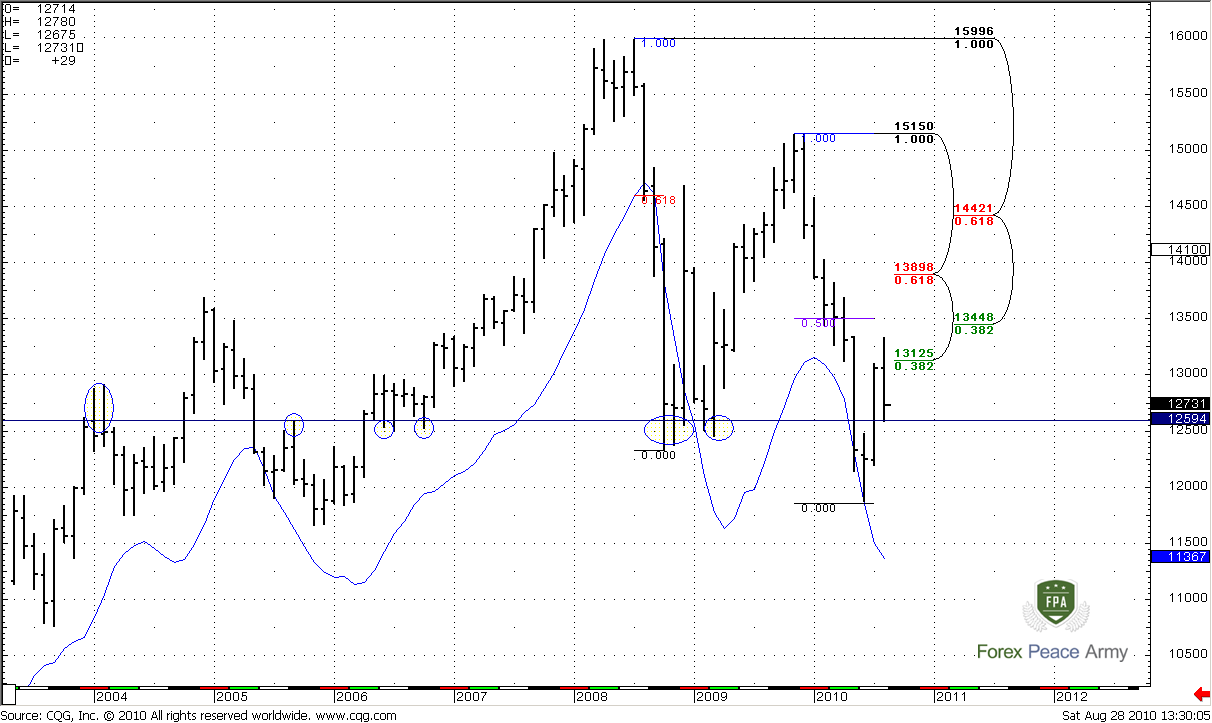
Trend is bearish; market has pierced 1.3123 area and pulled back. For now it looks like wash & rinse of this level, but current month is not closed yet.
The blue line is a lower border of DiNapoli Oscillator Predictor. When market touches it or even pierces – it means that market is oversold. In 2008 market was extremely oversold compares to 2010, when market just touched the line. That’s why I see current level of retracement to 1.33 area as logical. If you remember, I’ve told that market should show 0.382 or 0.5 retracement up, because it not so oversold as in 2008, when it has shown 0.618 retracement to the upside. So, now market has reached semi-position between 0.382 and 0.5. If market will continue up move, then the next resistance is roughly 1.35area.
1.26-1.2650 area is still in play. It has held the market during the previous week and still holds it. This is 50% retracement of a strong up bar and also a previous point of extremes. Market has touched it very often since 2004. Price action often found support or resistance at this level.
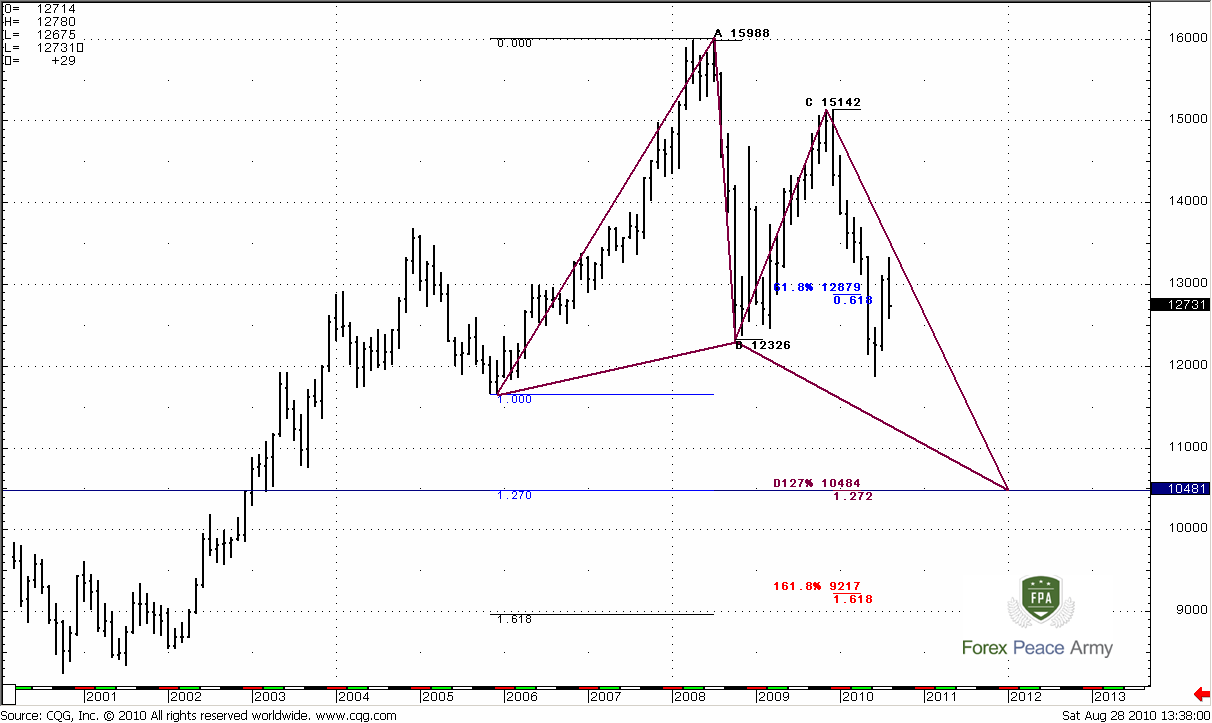
Another interesting picture is a butterfly on a monthly chart with the nearest target around 1.050 area. Also take a note that 1.27 ABCD target is also in this area
Weekly
During the previous weeks we’ve discussed when the momentum trade will start on EUR. The green line is 3-period simple moving average shifted forward for 3 period. Previous thrust down was really strong, so, probability suggests that after first retracement up we can count on some continuation of down move. I thought that it will start from 1.3120 area (this was a weekly Confluence resistance area, as you remember), but market has penetrated it a bit, reached monthly pivot resistance1 and then collapsed. We’ve received very solid bearish engulfing that engulfs 3 previous weeks of action. The target of this momentum trade is 1.2430 area, and I think that It should be reached.
At the same time, previous thrust up also is not bad (although it looks poorer on daily chart). It consists of 8 up candles and shows good separation from 3x3 SMA. And due to these circumstances one thing is worry me. Will the smaller momentum trade take place in nearest future, or not? I want to remind you that in previous research I’ve told you that we should carefully watch for 1.26 area of strong support. Now the situation of weekly chart is very near to perfect, in sense of context for momentum trade to the up side – market has shown thrust up, we have 3 closes below 3x3 SMA, market has reached strong support at 1.26 area and created a hammer. One thing that I concern about is an initial thrust up. Usually I like to see greater and longer thrust for momentum trade, but current thrust has sufficient number of bars, some bars are really strong, many bars closed at extreme. I suggest that this should be enough. The target of this trade – 1.3050 area.
That’s being said, the minimum target of starting move down is 1.2450 area- 0.618 Fib support and monthly pivot support 1. But, there is still a possibility for smaller momentum trade in upper direction, because of previous thrust up. And I think that this smaller trade should take place during next week. The major beacon – monthly pivot point at 1.2786 area (gold dash line on the chart). If market will pass through it to the upside, then the target – 1.3050. This possible trade up will not cancel the major momentum trade and will be look like retracement in bigger trade.
Daily
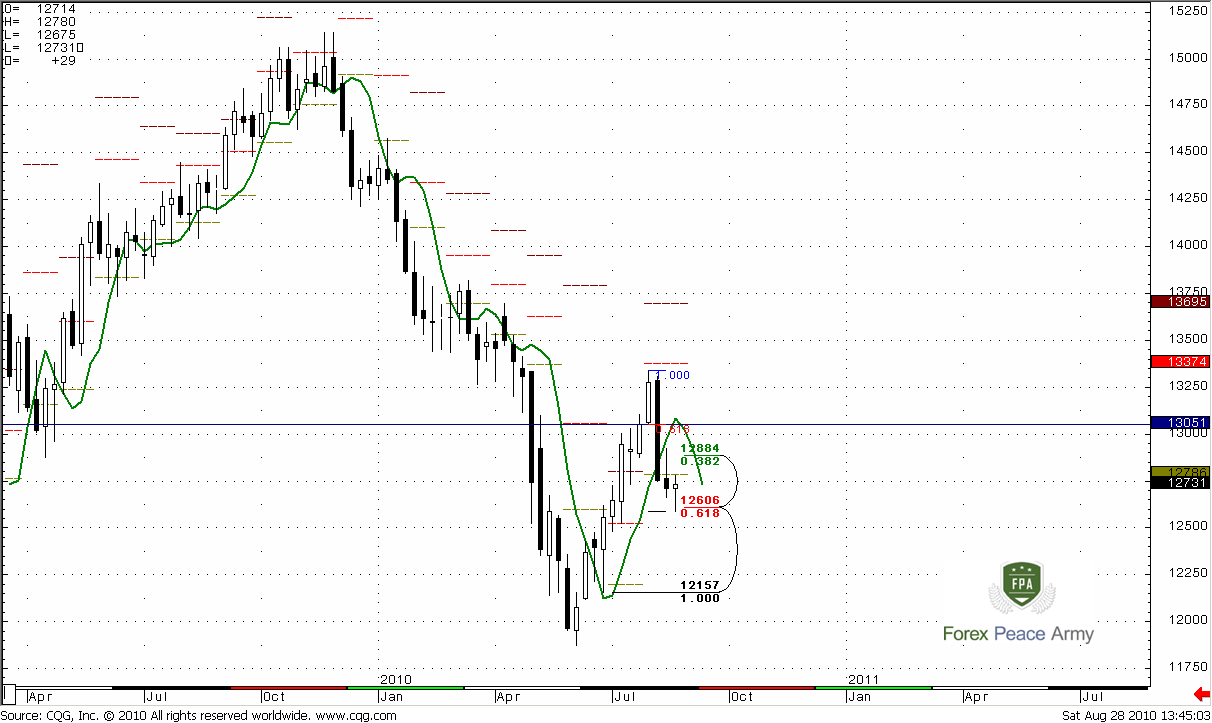
This time frame is very interesting currently. According to weekly analysis upper momentum trade is very probable, with the target around 1.3050. The key target here will be 1.2780-1.2816 area. This is a very strong resistance that includes daily confluence resistance area, weekly pivot resistance 1, monthly pivot point and previous lows. If market will break it – the road to 1.3050 will be opened.
On the chart I draw one of the possible scenarios on the market – reverse H&S pattern. Of cause, this is just an assumption, but it based on some factors. First detail is as follows – look at the left shoulder and the head. Head is precisely 1.618 expansion of shoulder and this is the most typical ratio for H&S. AS you remember this was a target of 1.618 intraday butterfly pattern. The next factor is a strong support that we are talking about. I expect that if market will break it, it will be like explosion, because I think that there are a lot of Buy stops just above this area. It will lead the market right to the 1.2890 area – weekly pivot resistance 2 where retracement possible will start.
From the other side, if market will not be able to break 1.28 area – it will mean that possibly we will see stronger down move. As I’ve said 1.28 is a beacon.
We have at least to possibility to enter the market on the next week. One is based on hourly chart, another one is based on daily. Daily possibility assumes enter the market after breaking 1.28 and reaching 1.29 area on the retracement to 1.2820, so that the left shoulder could be formed. So, based on my chart – we should enter Long on the low area of right shoulder. But there is more delicate enter also exist. Let’s move to hourly chart.
1-Hour
As usual, in this part of research we discuss the trading plan for the Monday. And, in general, till this point, we expect the signs of upper breakout on the market. Hourly analysis will help us to create a position that will be safe from the one side, and let us possess ourselves to possible breakout from the other. Ok, how it works…
First of all, you have to catch important moment. If bulls are really strong – 1.27 area should hold. This area includes hourly confluence support area and weekly pivot point. On Monday, look for any retracement to this area. It should be not like free fall; it should be like AB-CD and has symmetry. Anyway, wait until market will flirt with this area. If this area will hold and we will see some signs of strength from it – we can Buy. If market will break it to the downside – don’t be long.
If our scenario will take place and market will start to rise from 1.27 – after some time move s/l to b/e. It will allow you to take part it breaking the daily resistance area. Because if market will fail there – you will loose nothing, but if it succeed - you will win a lot, and market will reach 1.29 area. This is a strategy for Monday.
The technical portion of Sive's analysis owes a great deal to Joe DiNapoli's methods, and uses a number of Joe's proprietary indicators. Please note that Sive's analysis is his own view of the market and is not endorsed by Joe DiNapoli or any related companies.