- Forex, Gold, BTC Market Analysis | Trading Signals
- Sive Morten- Currencies, Gold, Bitcoin Daily Video
You are using an out of date browser. It may not display this or other websites correctly.
You should upgrade or use an alternative browser.
You should upgrade or use an alternative browser.
Euro Forex Pro Weekly, September 06-10, 2010
- Thread starter Sive Morten
- Start date
Sive Morten
Special Consultant to the FPA
- Messages
- 18,664
Sive,
I would like to help out as much as I can. With your permission and the people at FPA I would wish to be able to answer some of the questions which are posted to you. I am not talking about the heavy technical stuff. But mostly those which arise from people not reading the basics or not been here from the start. I think I am not stupid enough to be putting my foot in it.
The FPA guys can help by putting this into a special section.
My intention is to help out and nothing beyond that.
Ernest
Hi, Ernest,
I will appreciate that. I've told somehow already. If somebody is asking something, and you guys know the answer - do not hesitate to answer. It's OK.
Sive,
I commend you for extending your educational analysis so traders can learn how to base their trades upon logical market structure. Hopefully they will take the trouble to learn rather than follow your trade ideas like a flock of dumb sheep.
It has concerned me that the Henry Liu news trading analysis on FPA chose to extend into making random calls leading up to news events without any sound basis upon which to take the entries and then without any guidance for trade management. Bearing in mind a high % of FPA followers are very obviously novice traders I felt that was extremely irresponsible.
In this context you are filling an important gap and novice news trading thread followers would do well to pay close attention to what you are teaching here.
I am fully aware of the considerable time you spend preparing your charts and reports. I hope trivial and/or lazy questions from some repondents will be minimised to avoid imposing further upon your time. As you said you do need to be permitted a little time for your own trading !
David.
Hi Dave,
In fact, I spend most of time time on preparing researches rather then on answers in the thread.
") But this is also important, thanks.
But this is also important, thanks.Concerning Henry... Well, I do not think that all stuff is so obvious. He has passed his own difficult way to success, and he has found his own way of trading that is suitable to him. In fact, hi did the thing, that everybody should to aspire to - find your own style of trading.
Although this style of trading is not suitable for me, I think that it not bad, because it can swell your wallet
I see only one problem with this approach (may be because I do not use it) - this style of trading is very difficult to apply to Crude Oil for example, or S&P...
Hello Sive,
can you advise what platform do you use to generate those charts with the multi-Fibs shown?
do you have the indicator for MT4?
Hi, this is CQG. It's rather expensive, so, I think that if your assets 100K+ it's make a sense. As I know, such kind of multi fibs does not exist for MT4.
Hi, Ernest,
Hi Dave,
I see only one problem with this approach (may be because I do not use it) - this style of trading is very difficult to apply to Crude Oil for example, or S&P...
Yes understand and agree. Funnily enough you site 2 examples which are very closely correlated with inverted USD/CAD on a daily timeframe basis. Amazing how close the correlation is but we have to remember that correlations can sometimes change.
David.
Market is really crappy right now. And the sudden breakout a couple of hours ago happened at the usually low volume time of the day; that was really weird.
Price is hovering up and down weekly pp, but I believe there will be some meaningful movement later in the day. But don't trade until you see something else .
Good Luck
Price is hovering up and down weekly pp, but I believe there will be some meaningful movement later in the day. But don't trade until you see something else .
Good Luck
Sive Morten
Special Consultant to the FPA
- Messages
- 18,664
EUR/USD Daily Update, Tue 07, September
Good morning,
Market has shown a solid sell-off, (although it was thin) Daily trend is bullish. As you remember, we've talked about possible reverse H&S pattern on a daily time frame. So, if it will really happen, market should find some support around 1.2750 area.
Now market stands just above strong intraday support area - weekly pivot point and 4-hour confluence support. 12784-1.2800
I expect that we can see some bouncing from this area to the upside. I expect 3 possible scenarions, that I'll be watching for today's trading day, or may be even tomorrow.
1. Market will bounce from current support and we will see AB-CD retracement to the downside with Fib expansion target around 1.2735-1.2760 area. In this case I'll be wailting for confirmation from the market of this area of support - market should move above weekly pivot again and turn intraday trend to bullish. THen we can enter Long on a shallow retracement
2. If market just start up move from current support - wait until High of down thrust bar will be taken out by the price (see 4-hour chart). If it will happen, then possible up move has started...
3. If market will break below 1.27 - Fib support and weekly pivot support 1 - I will do nothing.
Attachments
Thank you for everything Mr. Morten. I have just one question: how do you manage your emotions when your strategy is telling to stay out and the market moves very strong like it did today? Or you have a way to enter in the middle of a move like this in order to follow it?
Sive Morten
Special Consultant to the FPA
- Messages
- 18,664
EUR/USD Daily Update, Wed 08, September 2010
Hello, everybody,
Yesterday, market has not shown any bounce from any Fib. supports. So, accordling to our trading plan, we shoudn't had to enter the Long trade.
Currently there are a lot of scenarios for possible price action. And much will depend on will 1.26-1.2650 area hold or not. If it will hold, then we can see one or other butterfly (see attachments). If it will not hold, then, the next target is daily based support, and the target of bearish weekly momentum trade - 1.2450 area.
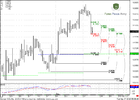
Also on 4- hour chart possibly we will see an oportunity for bearish scalp B&B trade. the green line on the chart is 3x3 DMA, so thrust is not perfect, but I suspect that it can be sufficient for B&B...
Hello, everybody,
Yesterday, market has not shown any bounce from any Fib. supports. So, accordling to our trading plan, we shoudn't had to enter the Long trade.
Currently there are a lot of scenarios for possible price action. And much will depend on will 1.26-1.2650 area hold or not. If it will hold, then we can see one or other butterfly (see attachments). If it will not hold, then, the next target is daily based support, and the target of bearish weekly momentum trade - 1.2450 area.
Also on 4- hour chart possibly we will see an oportunity for bearish scalp B&B trade. the green line on the chart is 3x3 DMA, so thrust is not perfect, but I suspect that it can be sufficient for B&B...
Attachments
Similar threads
- Replies
- 10
- Views
- 231
- Replies
- 11
- Views
- 298
- Replies
- 0
- Views
- 43
- Replies
- 5
- Views
- 860
- Replies
- 7
- Views
- 238
- Forex, Gold, BTC Market Analysis | Trading Signals
- Sive Morten- Currencies, Gold, Bitcoin Daily Video