Sive Morten
Special Consultant to the FPA
- Messages
- 18,644
EUROPEAN FOREX PROFESSIONAL WEEKLY
Analysis and Signals
April 7, 2010
Analysis and Signals
April 7, 2010
Fundamentals
Yesterday's FOMC minutes were not as supportive for USD as was expected. Taking into consideration the growing momentum in economic recovery, the market has expected some inkling on rate hiking. But the Fed has pointed that it will be slow in rate hike decision, looks like Fed notched down its forecast on inflation and the growth pace of the economy. Recent Fed comments increase the probability that the Fed will leave its “extended period” language intact. For now it’s a bit early to talk about it in detail, but I think that is still worth noting that it can reduce USD power in long-term. Much will depend on FOMC rate statement in June and statements of FOMC members – Dudley, Bernanke and Hoeing are on the calendar. The market will judge the possibility of perpetuated dovish Fed rhetoric from today’s speeches.
The Greece bailout situation continues to affect the market. One of the reasons for recent USD strength was rumors that Greece was calling to EU with a request to amend its aid EU-IMF agreement. Greece thinks that the IMF will be too strict with conditions linked to providing aid. Although the Greek finance minister has tried to dispose this information and said that Greece has never tried to change EU-IMF bailout plan. However, despite these attempts, the Greece-German yield spread has widened significantly and EUR/USD continue its down move.
In general Greece and Greeks have a mentality and cultural specifics that to my mind are hardly compatible with financial responsibility. The IMF surely will demand more than the Greek government will be able to supply so, it is not shocking that Greece tries to renegotiate an austerity plan and EU-IMF cooperation. Besides, talks around the problem make Greece to try switching attention to other “problem” members of EU, such as Portugal and trying to raise money for ever price - Greece was complaining that Germany did not properly compensate them for WWII damage. All this stuff smells bad. They should unite around the problems and try to resolve them and not vice versa. Recent Greece’s crying had attracted market’s attention to bad macro data. Although in Germany all seems good, Spanish unemployment continues to rise. So it looks like market demands a bit more then just “We’re OK, nothing to see here” statement from EU officials.
Résumé: The US economy continues to show signs of improvement. For now the basic expectation is that the Fed will tighten rates to 0.5% in Q3, but recent soft rhetoric from the Fed and a possibility of staying so for “extended period” can reduce USD power momentum in long-term, especially if nothing changes in June FOMC meeting.
The situation in he EU is still very complicated, and I think that it will not be fully resolved until summer, although the bailout solution has been found. Investors still want to see debt maturity from Greece, how EU-IMF supportive programs will work and maturing of debt obligations from Spain and Italy in 2010. This situation allows me to assume that the EUR will stay under pressure and EUR/USD downtrend will hold. Possible long-term target is the 1.28 level. But the movement may become a bit slower than before.
Technical
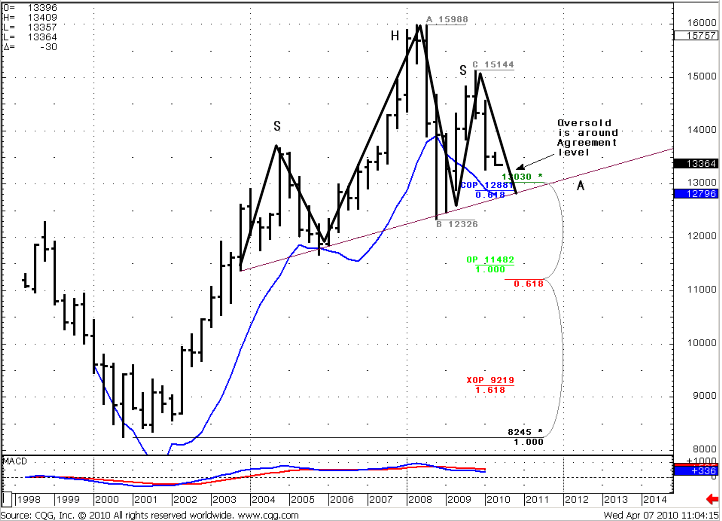
Quarterly (EURO FX all sessions CME futures)
First, we have a down trend. The blue line on the chart is the lower bound of Oscillator predictor that shows us an oversold level of the market. There is no oversold yet, but the market is close to this. Very important thing – Agreement support that includes COP target at 1.2881 and 0.382 major support level at 1.3030. If we add to this quarterly oversold condition then we get a very strong support at 1.28-1.30 level. Also I’ve marked possible H&S pattern – it is skewed a bit, but possibly this is one. We have neck line precisely in the Agreement area. All this stuff makes me expect that we shouldn’t break the neck line at the first attempt. I expect retracement higher from 1.28-1.30 area. Taking into consideration that this is a quarter chart (the IIQ will start tomorrow) the market should stay above 1.28 till July 2010. In general, this is in a row with fundamental expectations – even NFP will release great – we see down move in April, but Fed still hold soft tighten policy and that can lead to consolidation in second half of April and May. Although market has penetrated 1.3030 support level – it didn’t close below it, so I think that it still works. By the way support of 25x5 MA (not shown) is also in area between 1.28 and 1.30.
Quarterly EUR/USD
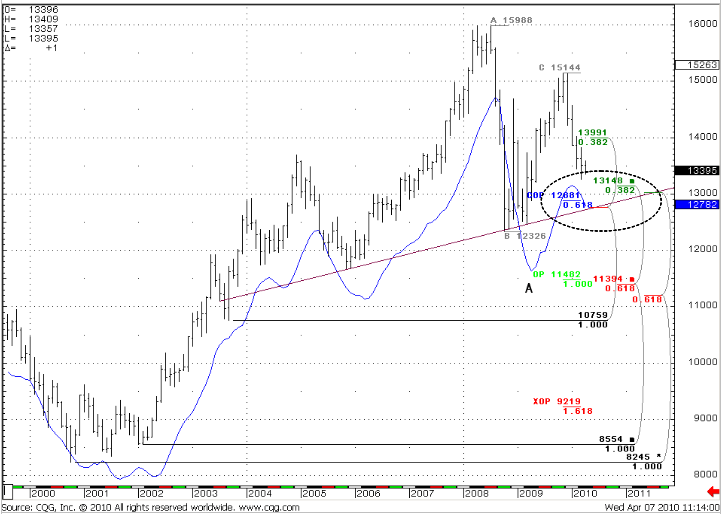
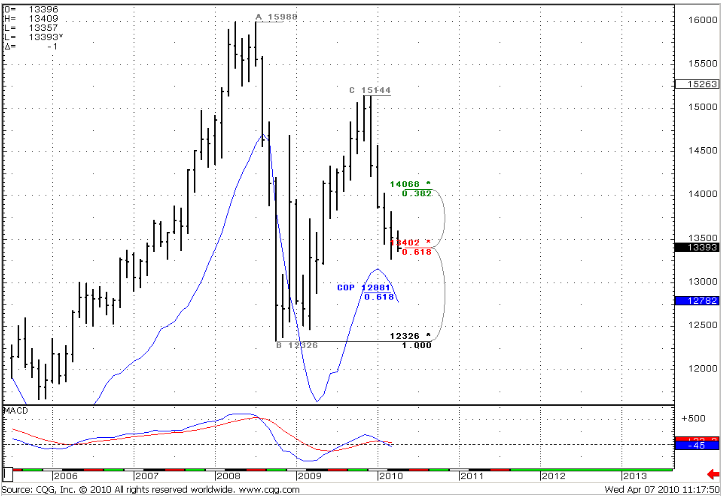
Monthly (EURO FX all sessions CME futures)
Monthly #1 chart adds some additional detail to the quarterly graph – additional 0.618 support at 1.2756. So, we have monthly Confluence (although it a bit wide) and Agreement with COP=1.2881. Also we have April Oversold level there (1.2782) and a possible neck line of H&S pattern. The result is the same - 1.28-1.30 is a very strong support, we have all rights to expect pullback from this somewhere around May. The trend is bearish.
Monthly #2 chart shows another price swing. We have down trend no oversold yet. In fact, just one support stays for this price swing – 0.618 is major support at 1.3402. Although the market is below it right now, the April bar has not closed yet, so we can’t say that this level was broken already.
Monthly #1 EUR/USD
Monthly #2 EUR/USD
Weekly (EURO FX all sessions CME futures)
The market has received a push from the NFP release and is trying to break 1.3400 level again. The trend remains bearish, so the nearest target is XOP=1.3074. There is no Oversold for now on weekly. On the previous week, when market cleared up the minimums and returned back, I thought that this was W&R of previous lows and expected a move up, but there is one thing that worries me a bit. Although I’m not an expert in Elliot’s wave analysis, this looks like that 5-waves Weekly pattern is complete or the 5th wave is still going (it can be compounding and consists from 3 sub-waves. Two of them we already see, so the last down leg is possible still). From that point of view we should expect reaching of XOP and some signs of reversion. But, anyway, the general thoughts have not been changed – down trend, no oversold, 1.3074 is the nearest weekly target.
Weekly EUR/USD
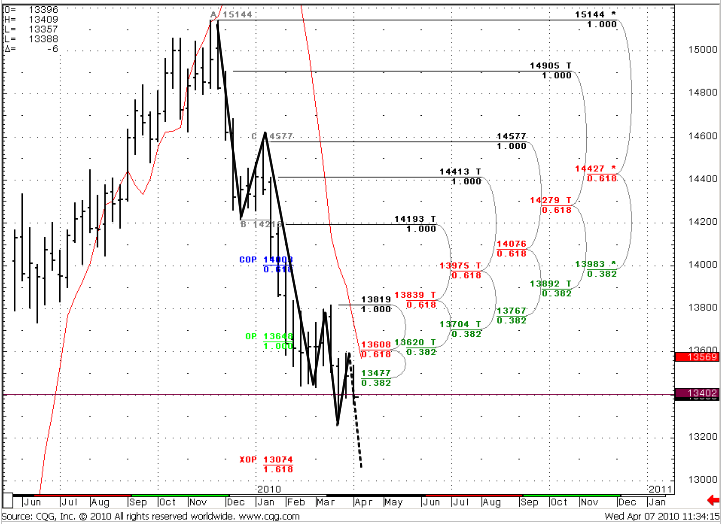
Daily & 4-Hour (EURO FX all sessions CME futures)
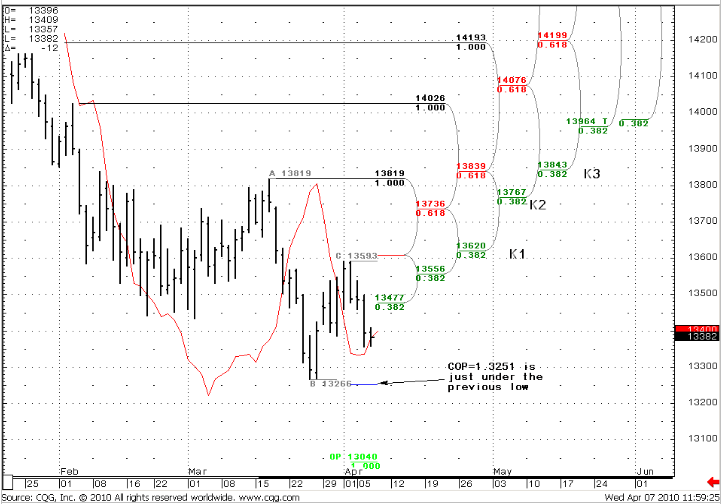
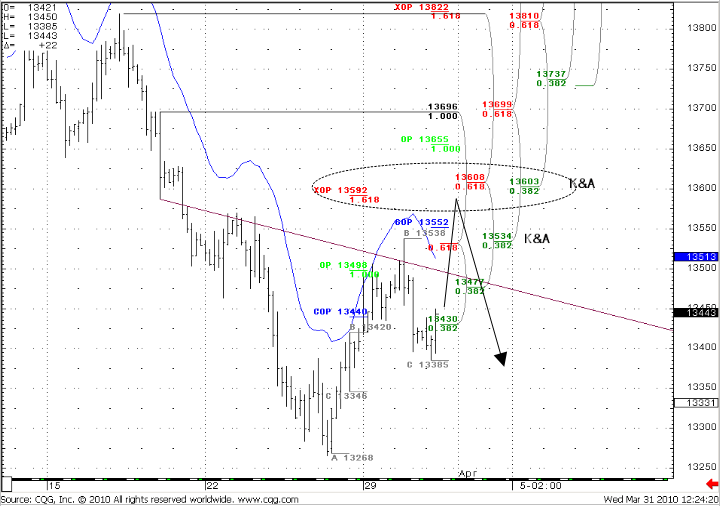
The market has reached a 4-hour XOP=1.3593 just under 1.3610-1.3620 daily Confluence resistance and has started to move down, according to our expectations (I leave the 4-hour previous week's chart). For now the daily trend is bullish, but if the market will close below 1.3380 – then the trend will turn bearish. The nearest daily target is COP=1.3251 just under the previous low. It means that very probably it (i.e. previous low) will not hold and stops will be touched. This will lead to stronger push downwad. OP = 1.3040 that is almost coincides with weekly XOP=1.3074.
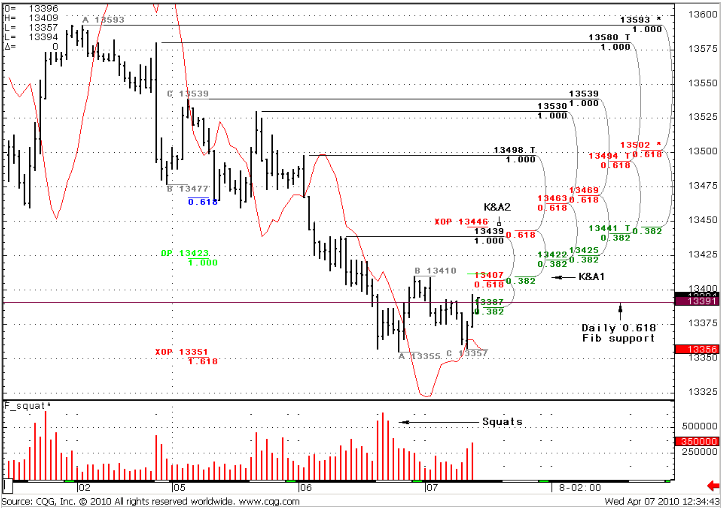
Hourly trend is also bullish. We see a very interesting combination – daily 0.618 Fib support at 1.3391 almost in the same place as daily trend reversal point. So, in near days much depends from strength of 1.3391 Fib support. Besides, closing above it will mean W&R of this level and possible move higher in nearest days.
So, prices has reached XOP=1.3351 at hourly time frame and forming something line double bottom. We have 2 agreements/confluence areas as a potential nearest targets for upper move – OP=1.3412 and XOP=1.3446 that coincides with 0.382* major hourly resistance level. And I think that if 1.3380-1.3391 will hold 1.3446 is the nearest target. By the way, there are some Fib-squats appearing in this area that add some strength to the support level here.
Daily EUR/USD
Hourly EUR/USD
4 Hour EUR/USD (previous week)
Trade possibilities (1):
Monthly
The nearest long-term target is COP=1.2880. I expect that we will see retracement higher from 1.28-1.30 area in IIQ.
Weekly
We have a down trend, no oversold conditions. Weekly nearest target is 1.3074-1.3112 area. Looks like 5th wave of Elliot’s wave pattern is forming (experts can comment this assumption on forum). If so, we should expect additional down leg right to our XOP target.
Daily
The daily situation is now at a breakeven point. Although we have an up trend both on daily and hourly charts, MACDP shows that it holds just to 1.3380 level. If market will close below it today – then the trend will turn bearish. Current daily 0.618 Fib support right in this area at 1.3391.
At the same time, thehourly market shows signs of possible upwards move – reached XOP=1.3351 and forming something like double bottom right in daily 0.618 support area. If market will close higher than 1.3391 - It will look like W&R of daily Fib support and lead to an upward move. The squats around here make support a bit more reliable. The nearest target in this scenario is 1.3446 area. Later we can calculate more targets.
Current European Forex Professional Weekly Signal - Forex Peace Army Forum
(1) “Trade possibilities” are not detailed trade signals with specific entries and exits. They are expectations about possible moves of the market during the week based on market analysis.
<!-- AddThis Button BEGIN -->
<div class="addthis_toolbox addthis_default_style">
<a class="addthis_button_facebook"></a>
<a class="addthis_button_email"></a>
<a class="addthis_button_favorites"></a>
<a class="addthis_button_print"></a>
<span class="addthis_separator">|</span>
<a href="http://www.addthis.com/bookmark.php?v=250&pub=fb-promotion" class="addthis_button_expanded">More</a>
</div>
<script type="text/javascript" src="http://s7.addthis.com/js/250/addthis_widget.js?pub=fb-promotion"></script>
<!-- AddThis Button END -->
General Notice: Information has been obtained from sources believed to be reliable, but the author does not warrant its completeness or accuracy. Opinions and estimates constitute author’s judgment as of the date of this material and are subject to change without notice. Past performance is not indicative of future results. This material is not intended as an offer or solicitation for the purchase or sale of any financial instrument. The opinions and recommendations herein do not take into account individual client circumstances, objectives, or needs and are not intended as recommendations of particular securities, financial instruments or strategies to particular clients. The recipients of this report must make their own independent decisions regarding any securities or financial instruments mentioned herein.