Sive Morten
Special Consultant to the FPA
- Messages
- 18,644
EUROPEAN FOREX PROFESSIONAL WEEKLY
Analysis and Signals
November 12, 2009
Analysis and Signals
November 12, 2009
Fundamentals
As we said on previous week, the release of October Non-Farm payrolls will be paramount to perpetuating current EUR/USD move. And it did. We’ve got another -190K in non-farm payrolls. If we take a look at statistics then we will see that US economy has lost more jobs in current recession than three previous recessions combined. Just look at the numbers – the total job loses since Jan 2008 at over 7.3 million people. In the recessions of early 80s, 90s and 2001 the total job loss was 7.02 million. What does it mean? Employment is a blood of economy, so when blood is not sufficient, the body can not function properly. As a result – we need external support for the body. In economy all the same – it means that Fed, ECB and other officials have to prolong their support programs in Q4 and even in 2010. And that means that we will not see Fed’s tighten till 2011.
There is another statistical moment that confirms this assumption. Usually Fed begins to tight rates, when banks reduce loan standards (conditions to borrowers) and make credit loans more accessible. These loan standards almost the same as a BBB-spread that shows risk premium for BBB rating borrower relative to riskless rate (US Treasury rate). So, when BBB-spread begins to tight it means that credits become cheaper and standards easier. So, for Fed’s tighten we need reducing of BBB spread for at least to 2% or lower. Now BBB spread is about 3 %. And banks still tighten credit policy rather than ease it. Fed usually wait for about 1-2 Q after tighten of the spread below 2%. Simple calculation gives us that the most optimistic time for tighten is an end of 2010, more probable – 2011.
Besides, now there is another question exist – why rhetoric about continuing supportive government’s program has appeared again? Well, I think that there is a risk exists that the whole World can get a “Lost Decade” in Economy. Lost Decade is a scenario of Japan’s economy. Japan’s authorities in early 90s (when Japan has fell is recession) had closed supportive programs too early. As a result they’ve got that they have now. Economy for 10 years can not recover pace that it had before recession. But nobody knows what we will receive if supportive programs will be in progress too long, because we even do not know for now what these programs are… Also worth noting here about Canada’s jobless claims that also had shown reducing after some periods of recovery. So the risk of W-shape is still exists.
Third moment that we have to pay attention to is a gold buying and diversification of reserves by Central Banks. During past week bank of India has bought 200 tons of gold. Russian Central Bank also pointed about reducing of USD share in reserves and a possibility of increasing gold government orders for buying. What do you think, when Central banks begin to buy gold? For past 2 months Central Banks have bought more gold that sell. Just look at the gold price. Gold will be in favor in any scenario – if it will be second leg of recession, or if it will be a recovery that corresponds with inflation. It can loose some price during the Fed’s tighten period, but for long-term period it is a good asset.
Why EUR/USD has continued to go up if it’s so bad? In this case people should close their equity positions, buy Treasuries or be in cash… Well, I think that reducing of jobs was not sufficient for that. Remember, people had seen a growth in Productivity, Construction spending, ISM indexes during the same week, and the rates are still low, and they will be low even more. Carry trade is so favorable… People have seen only what they have wanted to see – Fed will hold rates low for very long time, the recovery signs still exist. If jobs have fell for -250K, I’m sure, we could see strong S&P and EUR/USD down move.
Résumé: I think that situation is very stressful. There are very warning signs - rhetoric about continuation of government supportive programs, Gold buying. Recovery continues to loose pace. To my mind the probability of a second leg and a W-shape is growing. May be investors judges current situation not adequately enough or airily due fiscal year ending and holidays are near, but I worry about possibility of soon reversion of stock markets, if we will see couple just alike payrolls reports.
Basic macroeconomic issues:
1. Investors basically pay attention only to nearest perspective. Since FED rates tightening is too blurring, we should not to expect meaningful USD strengthen till next year (or till first signs of rates hike possibility);
2. USD will become stronger when investors will see this signs, so the expectations concerning EUR/USD rates parity will change;
3. We can expect growth in USD, if the possibility of second leg of recession will grow, and if investors will have large borrowing positions in USD;
4. EU economic recovery will have a time lag about 1-2 quarters compares to US recovering;
5. When EU rates hike expectation will appear, dollar will turn to weaken;
6. We can see temporary USD strengthen from time to time due some technical moments (risk aversion, stocks buying etc) till first signs of rates hike possibility appear.
7. The primary US economy data that will be under scrutiny – personal credit, spending, wages and employment, inflation. This is a final segment in chain, and it’s very important.
Technical
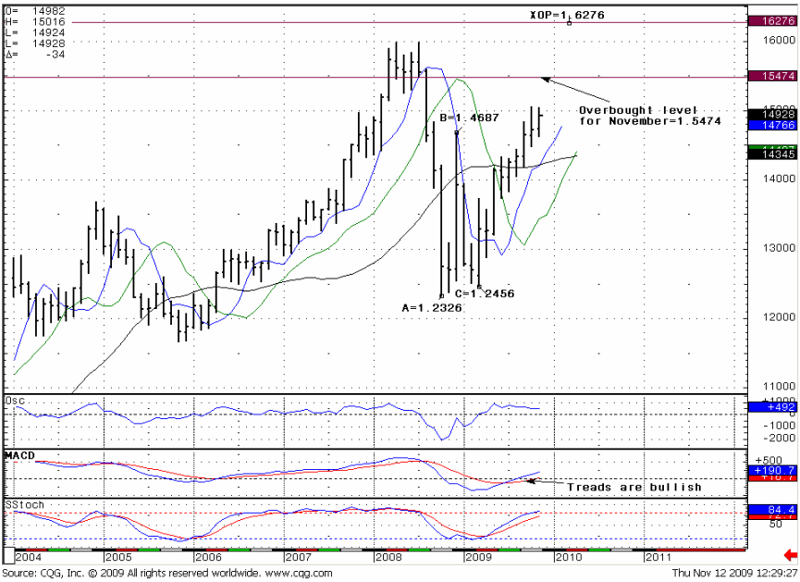
Monthly (EURO FX all sessions CME futures)
During previous week market has shown appreciation to COP=1.4992 level (not shown below, just check couple of previous researches). So, for now trend remains bullish, there is no overbought. Next target for Monthly chart is a 1.6276 level that is a Fibonacci expansion from ABC points shown at chart. Current oscillator number allows us estimate EUR/USD overbought level for November - 1.5474 area. If market will reach it in November, then we can expect consolidation or even retracement. Market will feel a pressure in this area.
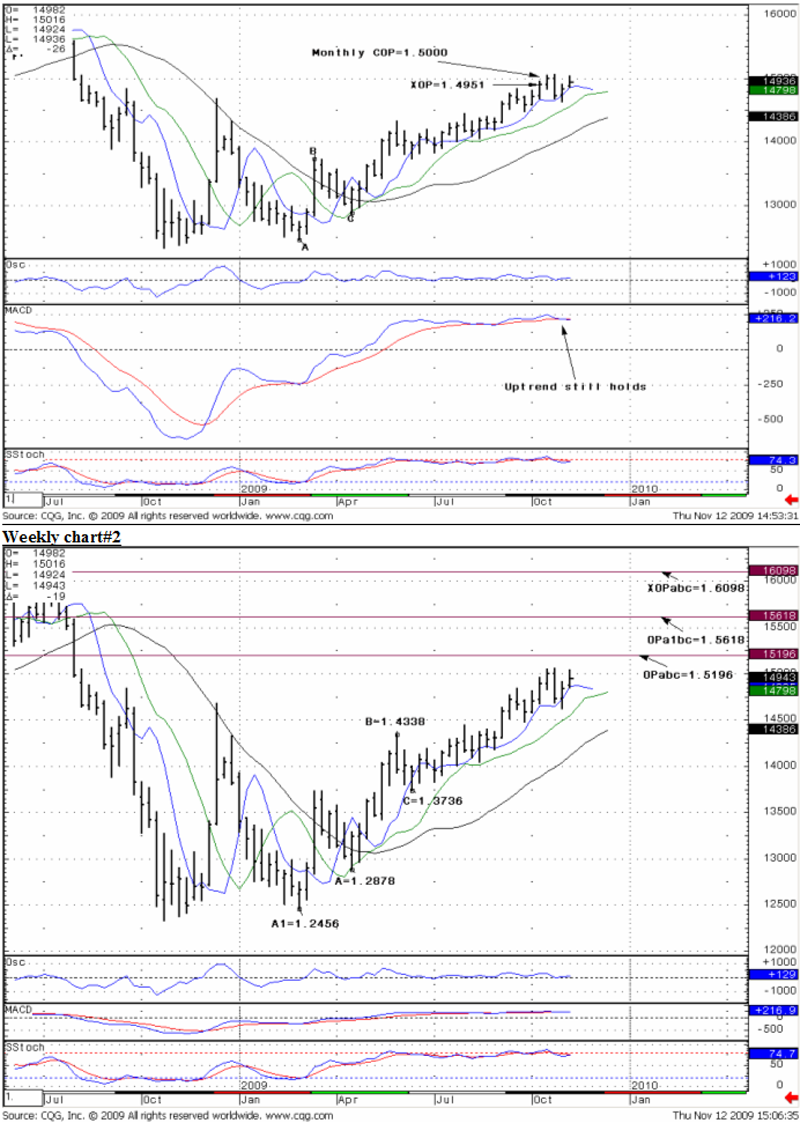
Weekly (EURO FX all sessions CME futures)
On the chart below we can see price appreciation of important targets reaching. (weekly XOPabc=1.4951 and monthly COP=1.5000 that is even more important). I think that weekly trends are still bullish – we do not see clear crossing of MACD lines, besides the angle of crossing is small. We should to estimate new targets for up move. Look at the Chart#2. The nearest target is 1.5196, next one is 1.5618 and the next is XOP=1.6098 that is very near to monthly target 1.6276.
Daily (EURO FX all sessions CME futures)
The daily trends are bullish for now, but market couldn’t break previous high and retraced. This retracement can continue. I’ve pointed possible levels of retracement. Two of them are very strong. COP=1.4779 coincides with 0.382 Fib support and OP=1.4613 with coincidence of Fib support levels. But weekly and monthly trends still bullish, that’s why we should expect not too deep retracement, if market intend to continue up move. And the nearest target=1.4779 is a more suitable for this purpose. If market will reach OP=1.4613 then daily trends can break down and this will be quite another picture.
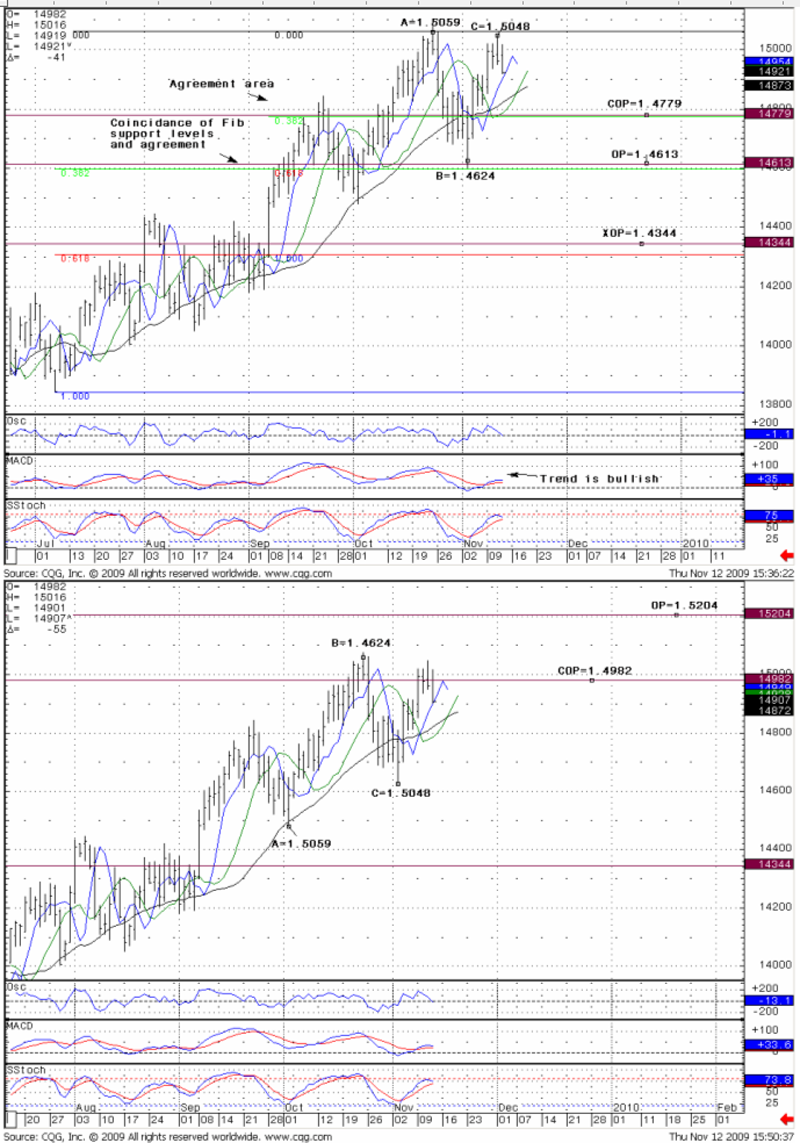
As for targets for up move – here they are. They are very close to weekly numbers, although they counted from different levels. Market has reached COP and retrace.
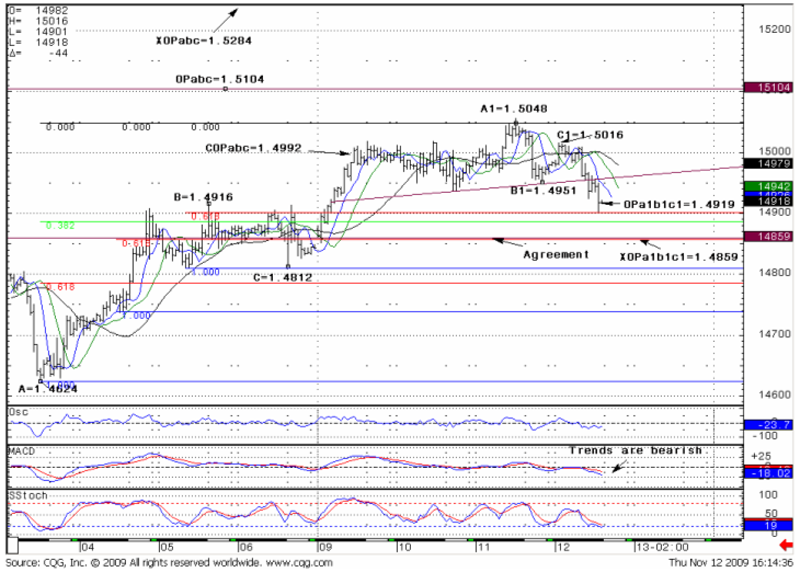
Hourly(EURO FX all sessions CME futures)
Well, hourly chart looks a bit complicated. Let’s check it from left to right. First, we see up move after payrolls release, market has reached COPabc=1.4992 and retrace. Next nearest target for up move is OP= 1.5104. Start of retracement allows us estimate A1-B1-C1 point and calculates retracement targets – OP=1.4919 that market has reached already and XOP=1.4859. OP target is in agreement with Fib conjunction levels in 1.4886-1.4901 area. This is very strong support. Besides, market has formed something like H&S structure – and the target of this formation is a length of move from Head to Neck line that equals an A1-B1 move. Trend is still bearish on hourly chart; we have no oversold level, so XOP is a reachable enough. Besides, it even higher then COP at daily graph.
But, if happen so that market go further, the next target is XOP=1.4859 that in agreement with 0.618 Fib support level. If it will happen, then possibly there will be a solid oversold level, and market should definitely retrace from there. The break below 1.48 will lead us to double top formation on daily chart and to deeper down move.
Trade EUR/USD possibilities:
Monthly, Weekly
Fundamentals still not in favor of USD. In long-term up move should continue. But for nearest 1-2 month we can see a technical retracement if investors reassess current economy situation and begin to run into quality.
Daily
Daily trend is bullish. For now we should wait when hourly trends will turn bullish. The best level for it is COP =1.4779. If market will break 1.4750-1.4800 consolidation and reach OP=1.4613 trends will turn bearish and up move will be under question
Hourly:
For now market reach OP=1.4919 near very strong support level. It’s a solid probability that retracement will stop here. When hourly trends will turn bullish we can receive an up move to the nearest target = 1.5104. Still, if market will reach XOP=1.4859 and daily trends will hold bullish, the up move can start from here. For now it is difficult to say more. Watch for my additional comments in forum topic.
General: Information has been obtained from sources believed to be reliable, but author do not warrant its completeness or accuracy. Opinions and estimates constitute author’s judgment as of the date of this material and are subject to change without notice. Past performance is not indicative of future results. This material is not intended as an offer or solicitation for the purchase or sale of any financial instrument. The opinions and recommendations herein do not take into account individual client circumstances, objectives, or needs and are not intended as recommendations of particular securities, financial instruments or strategies to particular clients. The recipient of this report must make its own independent decisions regarding any securities or financial instruments mentioned herein.
")