Sive Morten
Special Consultant to the FPA
- Messages
- 18,639
EUROPEAN FOREX PROFESSIONAL WEEKLY
Analysis and Signals
December 10, 2009
Analysis and Signals
December 10, 2009
Fundamentals
Recent news has stressed equilibrium in the markets. First and most obvious event – release of Non-farm payrolls data, that was much better that expected (-11K vs. -125K). Besides, the previous data was revised up from -190 K to -111K. As a result, we can say that Payrolls were positive for November. Also worth noting is that the average workweek also has shown growth, unemployment declined by 0.2%, and temporary employment also has picked up. So, the labor market has shown a strong up impulse on the previous week. Now everybody will look for stability and continuation of this impulse, particularly, will this impulse stimulate wage growth and then consumer spending. Additional positive movement (although not so important) has come from Consumer Credit indicator, that has eased lesser than expected - only for 3.5B$ vs. -9.3B$.
At the same time I think that not only these facts have lead to such growth of USD. Although, as we had pointed in previous researches, the dollar is still very attractive for carry trade (in fact USD is like a new JPY from the carry trade view) because of low rates, signs of growth in the economy and low inflation, the balance can change and equilibrium can reel in 2010. Why? Let’s look at situation in the EU. Germany and France are looking pretty good based on released data, but what about the others? The rating agencies have moved to downgrade Spain, Ireland and Greece. Although the ECB made liquidity highly available it does not monitor the direction of movement of this liquidity, how it was distributed…Looks like ECB didn’t take into account the fact that recovery pace at the periphery of the EU can be different. So, the exit from different fiscal EU government stimulus programs can be much longer than it was expected by investors and the ECB itself. Credit stress in the EU and the ballooning deficits of the UK and Japan remind the markets that the US economy is not the only one with problems. This fact has a chance to make 2010 into a year of greenback (but let’s not to be hasty). In general, strong up move in stocks was reasoned by world economy growth rather that positive US data. And some movements that should make investors worried, were blurred. Now they are going up on the surface.
Let’s see:
- S&P downgrades Spain’s outlook to negative;
- Irish public debt is expected to be 77.9% of GDP in 2010;
- Ex-BOE MPC member says that Greece may be the first major country in EU to default since WWII;
- Fitch says that they are not sure that Greece understands debt crisis.
I do not want to say that the USD will be in favor in 2010 – there are many other countries, EM, especially China that may influence on the force parity. I just want to point that situation can change drastically in definite circumstances.
Résumé: Although we see some signs of improvement in the US labor market, investors will need stability and continuation of November’s impulse. The EU situation shows serious problems and demands reassessing he current situation. If the situation in the EU will develop into negative scenario it can lead to a favor of the USD in 2010. The market is still very sensitive to the flow of risk. However, if the signs of global recovery cool, we can see “run into quality” again. If market macro figures will be disappointing during nearest 2 quarters, the market can rethink their attitude to US currency. At the end of the year funds start to diminish their positions in equities and other assets in favor of cash and short-term Treasuries. This can add additional pressure on EUR/USD pair.
Basic macroeconomic issues:
1. Investors basically pay attention only to the nearest perspective. Since FED rate tightening is too blurring, we should not to expect meaningful USD strengthening until next year (or till first signs of a rate hike possibility);
2. USD will become stronger when investors see these signs, so the expectations concerning EUR/USD rates parity will change;
3. We can expect growth in the USD, if the possibility of second leg of recession will grow, and if investors will have large borrowing positions in USD;
4. EU economic recovery will have a time lag about 1-2 quarters compared to the US recovering;
5. When EU rate hike expectations will appear, the dollar will turn to weakeness;
6. We can see temporary USD strengthening from time to time due some technical movements (risk aversion, stocks buying etc) until the first signs of a rate hike possibility appear.
7. The primary US economic data that will be under scrutiny are personal credit, spending, wages and employment, inflation. This is a final segment in the chain, and it’s very important.
Technical
Monthly (EURO FX all sessions CME futures)
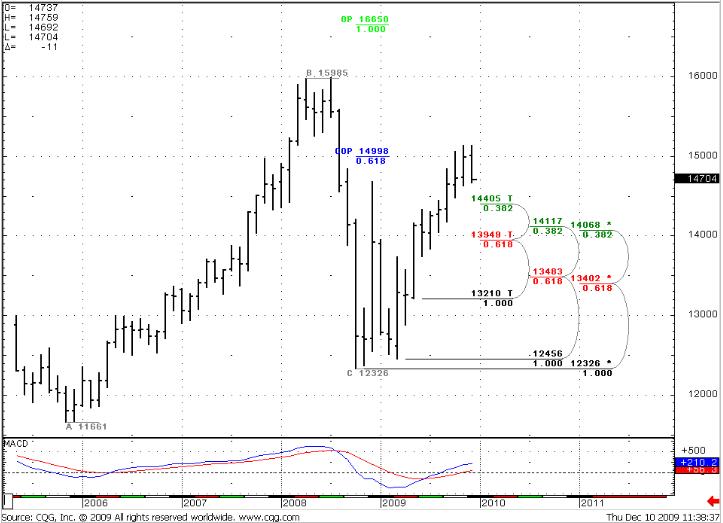
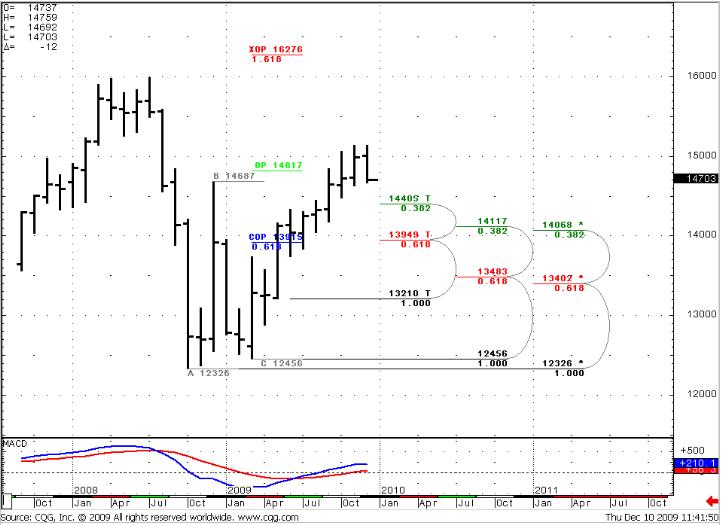
Well, looks like market has started a retracement, although the monthly chart does not indicate it yet. Nevertheless, it shows an appreciation of COP target that was reached – the market has not closed above it. We have no overbought/oversold situation. Monthly trend is still up; the nearest support level on monthly basis is 1.4405. As I say, we have an up trend, so the nearest monthly target for now is XOP=1.6276 (look at the second monthly chart).
Monthly #1
Monthly #2
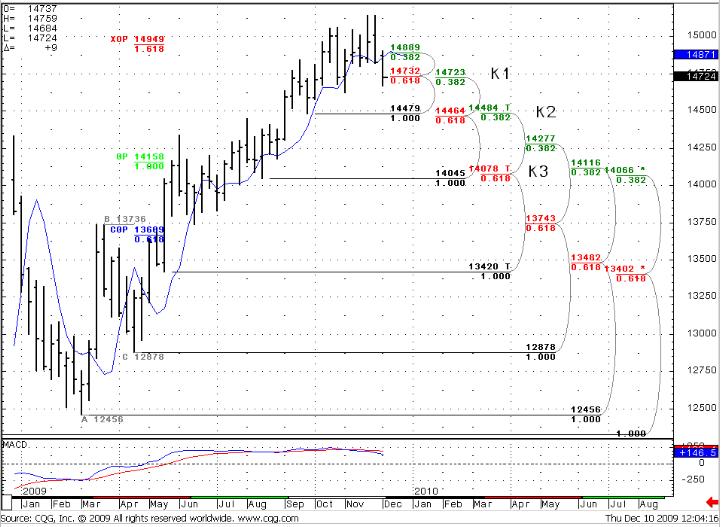
Weekly (EURO FX all sessions CME futures)
Although I’ve written on previous week that the picture is bullish, many fundamental circumstances have changed situation dramatically. The weekly trend turns bearish. As you can see, market has reached XOP target at 1.4950 (and COP at monthly term) and started a retracement. I’ve pointed out support levels (but not all of them, just the most important). We have three strong areas of Confluence support (marked as K). Although the first K-area is passed, the weekly market does not close under it, so this level is still in the game. K3 area is very important and strong because of it has 0.382 retracement of long-term low level. The nearest move target is a 1.4430 level – that makes an Agreement with K2 area. But, I expect that market will show some retracement higher, before it continues its down move (the reasons are in Daily part).
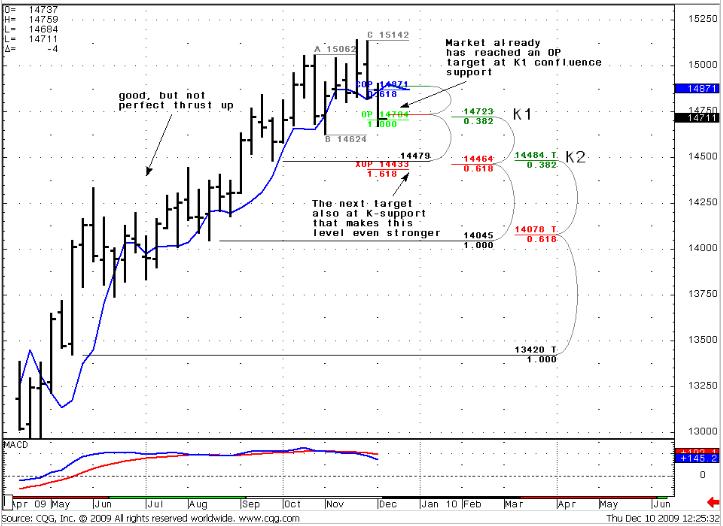
In general, on the weekly chart we have a bearish directional signal (look at weekly chart #2), although it not perfect and a bit tricky already to trade it, because it has reached an OP. Context for trade is strong enough to my mind – market has reached LPO at the Weekly and Monthly chart, weekly trend confirms down move. Anyway, for those who would like to try – S/L should be above the 1.4950 level, and, as I say, there is a great probability of upper retracement because of daily reasons, that can give additional opportunity to enter at better price…
Weekly #1
Weekly #2
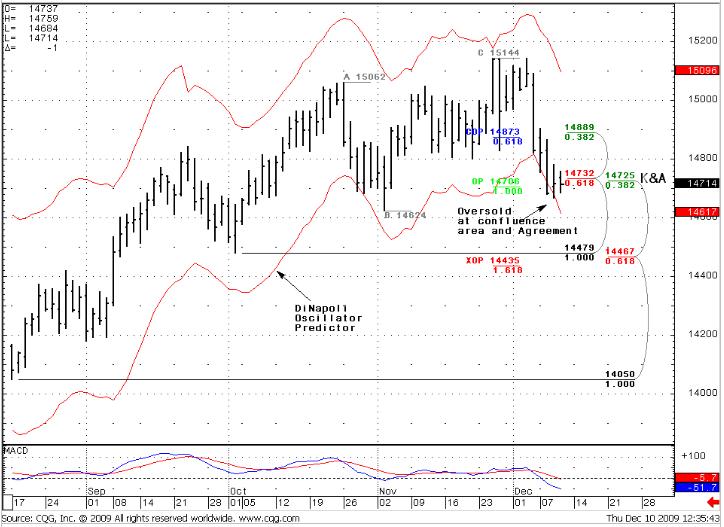
Daily (EURO FX all sessions CME futures)
First, I’ve added on chart DiNapoli Oscillator Predictor. That works in the same manner that a simple Oscillator, but shows the price at which market will be oversold (lower band) or overbought (upper band) for all later bars and for 1 bar forward. So, the picture on the daily chart is very interesting. In fact, we have DiNapoli “Stretch” directional pattern – a combination of oversold and strong support. Besides, as we’ve pointed out above, there is an OP also in this area. So, 1.47-1.4730 is strong enough to lead to some retracement higher. MACD shows a strong downtrend, so, if it will be – then only retracement, not a trend’s change. After retracement, you can try to enter in the Weekly signal that we’ve discussed earlier, if you want, of course.
Concerning correction up… There can be also a situation that the market will not go up and will stay in place instead. This one can happen because of reason for retracement – high oversold level, so market should correct an oversold. And this can happen two ways – up move for shorter term or staying at place a bit longer.
Daily
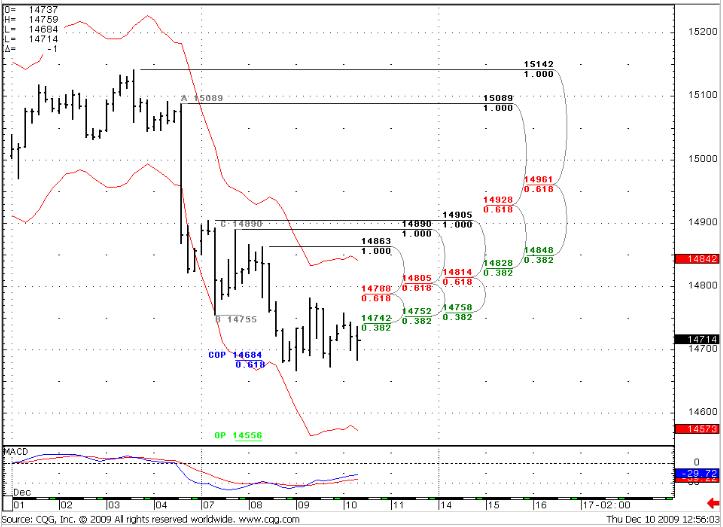
4-Hour (EURO FX all sessions CME futures)
4-hour trend turns bullish. Market has reached a COP just at daily Confluence support. For now it’s difficult to say, where the up move can stop (it’s not really even started), prices stand just at support level. But, it seems that 1.4850 level is a first beacon. At this level not only Fib resistance, but 4-hour overbought level also. But, this is just a proposal; we need to see how market will start to move upward. If I can be able to calculate target more precisely, I’ll post it on forum.
4-Hour
Trade EUR/USD possibilities (1):
Look’s like medium-term trend turns bearish. For the nearest time I expect retracement a bit higher – may be to 1.4850 level. Then, in my opinion, a down move should continue. If a retracement will take place, it may be not a bad idea to try to go short after it with s/l around 1.4970-1.50, t/p is around 1.4470, if your risk participation and account value allow you to trade it.
But I want to repeat that this signal has worked out its minimum demanded target (OP) already. And the possibility to reach XOP is much lower. It will depend from the pace of retracement. For now it looks like that XOP can be reached.
(1) “Trade possibilities” are not detailed trade signals with specific entries and exits. They are expectations about possible moves of the market during the week based on market analysis.
<!-- AddThis Button BEGIN -->
<div class="addthis_toolbox addthis_default_style">
<a class="addthis_button_facebook"></a>
<a class="addthis_button_email"></a>
<a class="addthis_button_favorites"></a>
<a class="addthis_button_print"></a>
<span class="addthis_separator">|</span>
<a href="http://www.addthis.com/bookmark.php?v=250&pub=fb-promotion" class="addthis_button_expanded">More</a>
</div>
<script type="text/javascript" src="http://s7.addthis.com/js/250/addthis_widget.js?pub=fb-promotion"></script>
<!-- AddThis Button END -->
General Notice: Information has been obtained from sources believed to be reliable, but the author does not warrant its completeness or accuracy. Opinions and estimates constitute author’s judgment as of the date of this material and are subject to change without notice. Past performance is not indicative of future results. This material is not intended as an offer or solicitation for the purchase or sale of any financial instrument. The opinions and recommendations herein do not take into account individual client circumstances, objectives, or needs and are not intended as recommendations of particular securities, financial instruments or strategies to particular clients. The recipients of this report must make their own independent decisions regarding any securities or financial instruments mentioned herein.