Sive Morten
Special Consultant to the FPA
- Messages
- 18,630
EUROPEAN FOREX PROFESSIONAL WEEKLY
Analysis and Signals
December 17, 2009
Due to Holidays the next researches will be posted on Dec, 28 2009 and Jan 06, 2010
Analysis and Signals
December 17, 2009
Due to Holidays the next researches will be posted on Dec, 28 2009 and Jan 06, 2010
Fundamentals
During last week the most important moments were macro data, the FOMC statement (yesterday) and the situation in EU that we’ve touched on in previous research. The data was mixed, but my judgment is that it had an advance towards a shallow recovery. Although the NAHB index and Empire were set back, the PPI and Industrial Production were greater that expected. The housing market was in line with expectations and I think that there is no up trend still. So, we can characterize the macro data picture as “in a row with small +”. The main thing that I suppose and the most important one – we do not see any reversal in economic growth. Small and unstable pace – yes, but no reversal down, and it’s good.
Concerning FOMC rhetoric, it wasn’t unexpected. There was only one moment that worth to noting here. The FOMC has pointed that they also see signs of improvement and need to wait for stability and a signs that the economy can support this improvement itself without any fiscal support programs by government. Also it was pointed out that some supportive programs can be closed sooner that expected. In general, it was a very careful statement with a modest inkling on improvement.
The most intriguing situation is in the EU. EUR/USD came under heavy selling pressure as the combination of poor economic data and credit concerns. First, the ZEW Economic Sentiment figures out of Germany and the Euro-Zone fell. The pull-back is consistent with the morose commentary of the ECB and EU officials regarding the macro landscape. It worth noting that there was a dark tone in both ECB and EU rhetoric. Officials are highlighting the vulnerability and fragility of the economy. Additionally some have gone so far as to state that a double-dip recession cannot be ruled out. The credit situation has attracted too much attention to structural problems of the Euro-Zone. Greek officials are trying to assuage the fears of the market by ensuring a budget deficit of -3% of GDP in 2013 but have presented no viable solution. Greece’s entrance into the Euro-Zone was meant to protect the country against shocks but instead it lowered interest rates to a level that were simply too low for Greece’s fundamentals. The uncovering of how vast and deep this debt problem truly is will be an ongoing saga.
Résumé: The situation in Greece shows that nobody knows what the consequences will bring us crisis and when they will be passed by world economy. For now it is clear that the crisis can’t come as a lion and go away as a lamb. The debt problem is a first round of it - Dubai, the situation in the EU. Who or what will be the next? A global sovereign debt crisis could take years to materialize especially if there are continue worries over economic strength. These fears will keep people looking to the dollar. And for now circumstances are in favor of the US – stronger data, clearer situation.
Basic macroeconomic issues:
1. Investors basically pay attention only to the nearest perspective. Since FED rate tightening is too blurring, we should not to expect meaningful USD strengthening until next year (or till first signs of a rate hike possibility);
2. USD will become stronger when investors see these signs, so the expectations concerning EUR/USD rates parity will change;
3. We can expect growth in the USD, if the possibility of second leg of recession will grow, and if investors will have large borrowing positions in USD;
4. EU economic recovery will have a time lag about 1-2 quarters compared to the US recovering;
5. When EU rate hike expectations will appear, the dollar will turn to weakeness;
6. We can see temporary USD strengthening from time to time due some technical movements (risk aversion, stocks buying etc) until the first signs of a rate hike possibility appear.
7. The primary US economic data that will be under scrutiny are personal credit, spending, wages and employment, inflation. This is a final segment in the chain, and it’s very important.
Technical
Monthly (EURO FX all sessions CME futures)
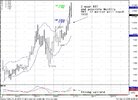
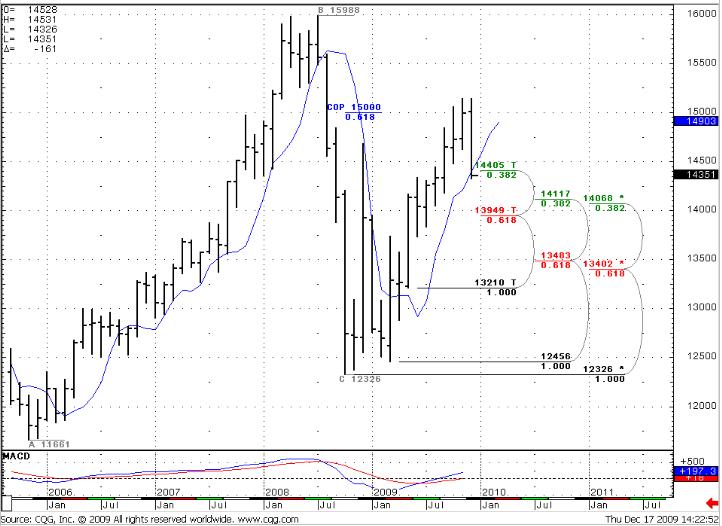
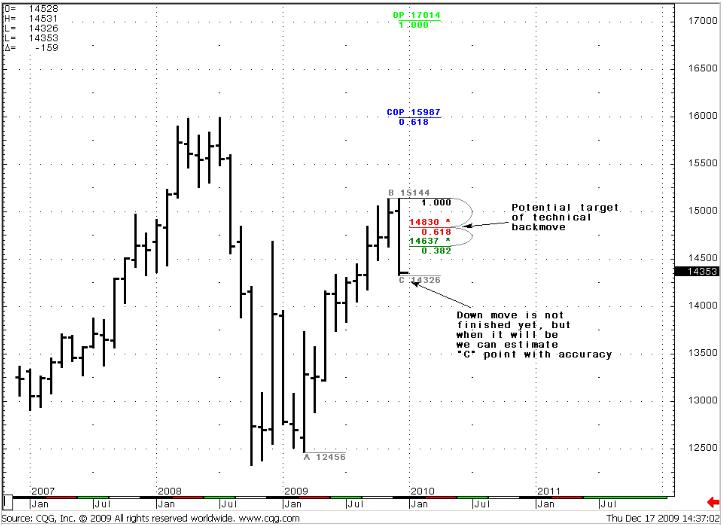
The market has reached a first support level at 1.4405. We see no oversold/overbought and the trend is up still. So, the nearest up target is the same for now 1.6276. Another interesting movement concerning the monthly chart – is a long up move. Usually this kind of movement has a strong momentum. That’s why I expect some move back. Most probably it will happen regardless to the trend that will be after that. It can change, it can stay up, so this move has a solid probability to happen because it is technical, not fundamental. The target of this move is around 1.4800-1.4830 area for now. If the market will go deeper in nearest future this area also will be a bit lower.
Anyway this is a monthly chart and we will have time to discuss this situation soon. Besides, we need to see any signs of up turnover on the weekly and daily charts first.
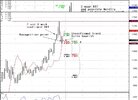
Second thing - I suppose that this down move will give us a “C” point to calculate expansions higher to estimate potential targets for a continued up move (look at Monthly #2 chart).
Monthly #1
Monthly #2
Weekly (EURO FX all sessions CME futures)
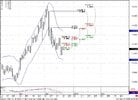
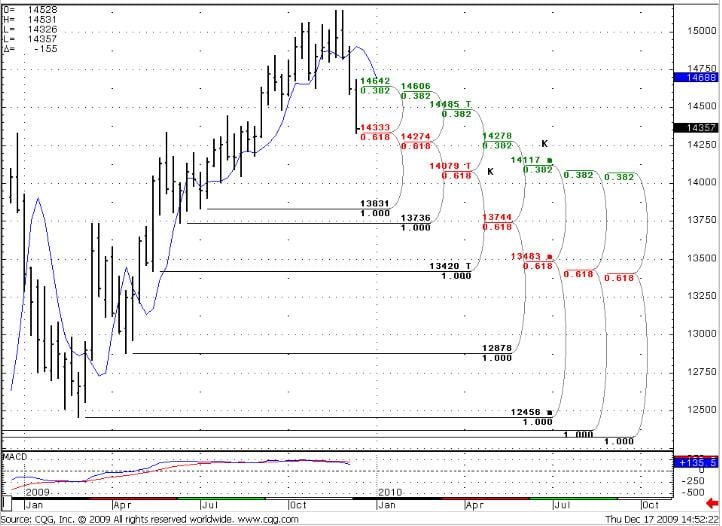
The target from the previous week (1.4435) was achieved. The market has broken through two Confluence areas – 1.4720-1.4730 and 1.4464-1.4484 (see previous research) and reached 1.4333 Fib support. So, for now there are two strong support areas (Marked by “K”) – 1.4270-1.4280 and 1.4080-1.4085. We see a bearish trend, no oversold level. Taking into consideration that I‘ve talked in Monthly part, we need carefully watch for signs of possible up turn. The probability is higher that these signs can appear near strong support levels.
Weekly
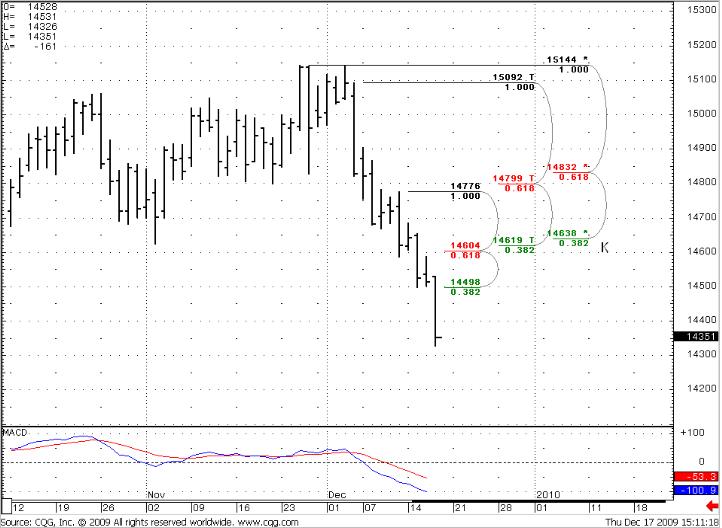
Daily (EURO FX all sessions CME futures)
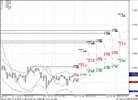
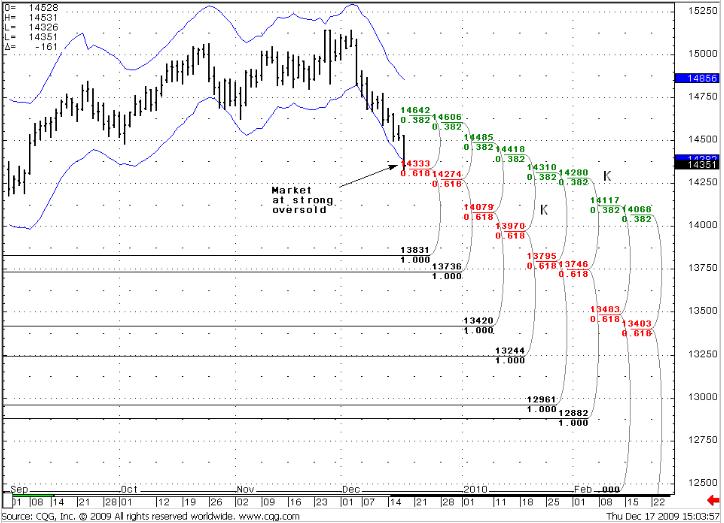
The market is highly oversold on the Daily time frame and near Fib support level (Daily#1 chart). Also we see a strong Confluence area at 1.4275-1.4280. So, I think that the market can not pass through this area in oversold condition – it should retrace higher (Daily chart#2). I do not know exactly where up retracement will start, but it should happen above 1.4270-1.4330 area. The maximum of this retracement will give us a “C” point also, to calculate possible targets for down move.
According to Daily #2 chart, the most probable level at which retracement can finish is a 1.4605-1.4620 confluence area for now. But if the market will make a new current low then these levels also will change. Besides, oversold condition also will fade there. So, to determine precisely these potential levels, we need to look at lower time frames in the future. I am writing all these things just to explain the way that situation will develop.
Daily #1
Daily #2
Trade EUR/USD possibilities (1):
Monthly
I expect a technical retracement up due to market momentum. I think it should happen regardless to trend that will be. Taking into consideration the current situation on the daily chart (strong support and oversold at 1.4270-1.4330) it can start from this level. Anyway we need to see signs of this move. I do not see them for now.
Weekly
No oversold, trend is bearish. Two strong support areas that can lead to retracement up due situation on Monthly and daily time frames.
Daily
We need to closely look at lower time frames. If they will show signs of reversal up, that will mean that the 1.4270-1.4330 area holds and even the possibility that this is the start of the move to the monthly target.
And my thoughts in general on situation – I will be waiting for signs of a reversal up on daily and weekly charts. I suppose that these signs will appear near strong support levels (which one I do not know yet) and will be confirmed by 1-4 Hour charts. Then there will be a good possibility to go long with the monthly target. The monthly trend is still bullish.
(1) “Trade possibilities” are not detailed trade signals with specific entries and exits. They are expectations about possible moves of the market during the week based on market analysis.
<!-- AddThis Button BEGIN -->
<div class="addthis_toolbox addthis_default_style">
<a class="addthis_button_facebook"></a>
<a class="addthis_button_email"></a>
<a class="addthis_button_favorites"></a>
<a class="addthis_button_print"></a>
<span class="addthis_separator">|</span>
<a href="http://www.addthis.com/bookmark.php?v=250&pub=fb-promotion" class="addthis_button_expanded">More</a>
</div>
<script type="text/javascript" src="http://s7.addthis.com/js/250/addthis_widget.js?pub=fb-promotion"></script>
<!-- AddThis Button END -->
General Notice: Information has been obtained from sources believed to be reliable, but the author does not warrant its completeness or accuracy. Opinions and estimates constitute author’s judgment as of the date of this material and are subject to change without notice. Past performance is not indicative of future results. This material is not intended as an offer or solicitation for the purchase or sale of any financial instrument. The opinions and recommendations herein do not take into account individual client circumstances, objectives, or needs and are not intended as recommendations of particular securities, financial instruments or strategies to particular clients. The recipients of this report must make their own independent decisions regarding any securities or financial instruments mentioned herein.