Sive Morten
Special Consultant to the FPA
- Messages
- 18,621
EUROPEAN FOREX PROFESSIONAL WEEKLY
Analysis and Signals
December 28, 2009
Due to Holidays the next researches will be posted on Jan 06, 2010
Analysis and Signals
December 28, 2009
Due to Holidays the next researches will be posted on Jan 06, 2010
Fundamentals
There was not much data that could shake the market in the previous week. A general characteristic that we can appoint to US data is “Improving”. Let’s see:
- Inflation: CPI was in a row with expectations (0.4%), PPI showed growth 1.8% instead of the 0.8% that expected. This is even more important because PPI and CPI are lagging indicators of inflation. For real inflation we should look at commodity prices and its relative growth to growth in interest rates. During the last week Oil prices (and CRB index also) showed solid growth despite USD strengthening.
- Housing market: Building permits have grown for 30K in November; Housing starts – 50K; Existing home sales 0.5M; New Home sales has shown decline for 50K, but I think that this is not a strong negative fact. We should watch for primary and secondary housing market together. The point is that huge inventory of existing homes is pressing on the primary market. Now we see that existing homes inventory has contracted much in November and this is a very good sign for growth in the building sphere. I suppose that there should be additional contraction about 1.5-2Mln units in existing homes inventory until we will see growth in new home sales;
- Employment: Weekly claims data shows 3-4 declines in a row, previous Non-farm payrolls has shown growth (including revised data), Unemployment declined to 10%.
- FOMC statements: The FOMC has pointed that it also sees an improvement in the economy, but they need time to be sure that economy will show stability in growth pace. Also the FOMC has announced that the majority of stimulus programs will be closed on 01 Feb 2010.
- Industrial production and Capacity Utilization: shows solid surging. IP for 0.8%, CU from 70.6% to 71.3%. Although we do not see substantial growth in Personal income/spending, we do not see decline also. Besides, personal income is a last component in the chain and will show increases when companies will feel improvements and are ready for expansion;
- Different confidence and sentiment indexes also show improvements.
The main issue that can make a negative influence on USD in the long-term future is the healthcare reform. This program demands about 871B USD. It will be difficult to borrow this sum, because the current level of borrowing and deficit is already above demand and leads to growth in interest rates. This additional sum also will stimulate inflation. But the most important that it can increase taxes and can significantly reduce the pace of recovery, hiring activity and investment, especially in the current stage when the economy is still weak.
We do not know exactly how circumstances will turn, maybe EU banking system problems can outweigh the US spending, but in general this is a negative factor for the USD in the long-term.
Returning to the EU situation, Moody’s has reduced Greece's rating to A2 (from A1) and confirmed Ireland's rating. ECB’s Nowonty has made it clear that the ECB will not bailout Greece leaving the responsibility of restructuring to the Greeks and a possible rescue on the shoulders of the IMF or fellow Euro-land members. The market must also be concerned about Ireland. Honan stated that the Irish government may be forced to increase its stake in Irish banks to 50%. Given rhetoric from ECB officials, the health of the entire Euro-land banking system is in question. A story indicates that some E450B in capital may have to be raised to meet capital requirements. ECB Stark went on to state that new capital rules will slow growth and that he fully expects the banking system to shrink. Moreover, he mentioned that banks should not be too reliant on liquidity. It is this draining of liquidity from its emergency levels that has started to unveil the vulnerabilities of the European banking system. If the situation does not stabilize, the removal of assistance will unmask the broken financial system.
Résumé: It looks like the short-term dollar strength remains intact. The rally seems to be a function of better US data and worse conditions elsewhere. I think that in nearest term we see new EUR/USD down move. But in long term perspective there are some factors that could reinstate the dollar bear trend in 2010.
Technical
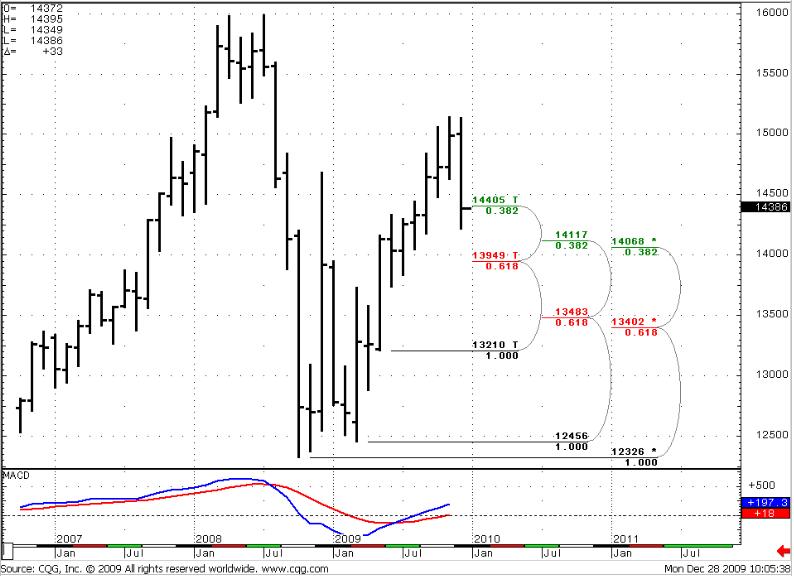
Monthly (EURO FX all sessions CME futures)
The picture didn’t change much during the time that has passed since my previous comments. I keep the previous comments, just update the charts…
Market has reached a first support level at 1.4405. December has not closed yet, and we see some retracement up from the minimum, so, possibly this level still will be in the game, although there was a penetration of it (If market will close above it). We see no oversold/overbought, the trend is up still. So, the nearest up target is the same for now 1.6276. Another interesting movement concerning the monthly chart – is a long up move. Usually this kind of movement has a strong momentum. That’s why I expect some move back. Most probably it will happen regardless of the trend that will be after that. It can change, it can stay up, so this move has a solid probability to happen, because it is technical, not fundamental. The target of this move is around 1.4780 area for now. If market will go deeper in nearest future this area also will be a bit lower.
Anyway this is a monthly chart and we will have time to discuss this situation soon. Besides, we need to see any signs of up turnover on the weekly and daily charts first.
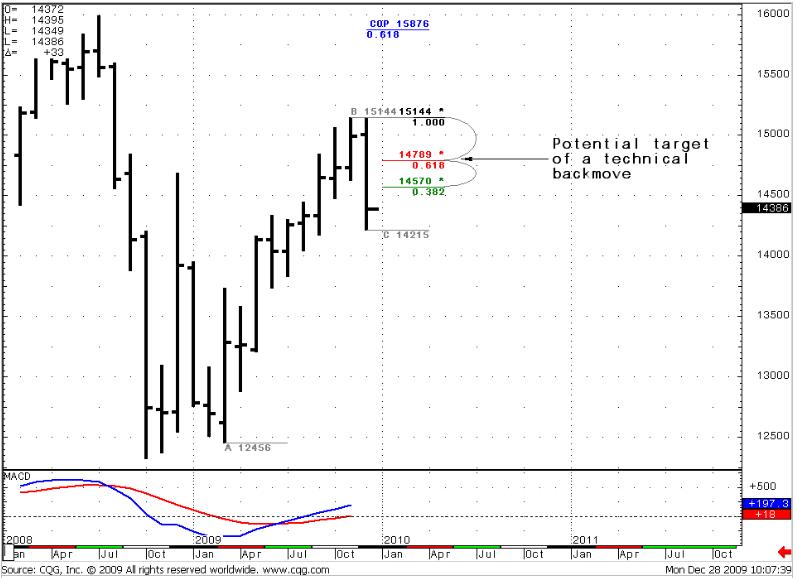
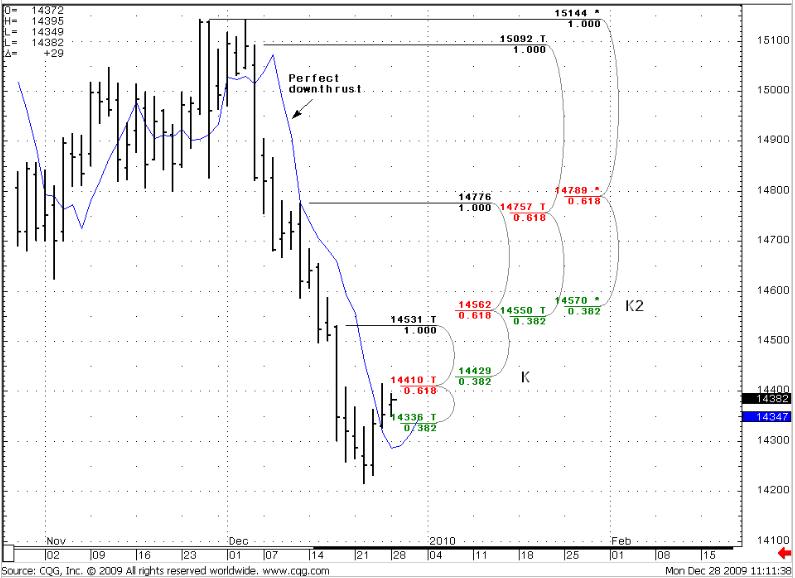
Second thing - I suppose that this down move will give us a “C” point to calculate expansions higher to estimate potential targets for a continued up move (look at Monthly #2 chart).
Monthly #1
Monthly #2
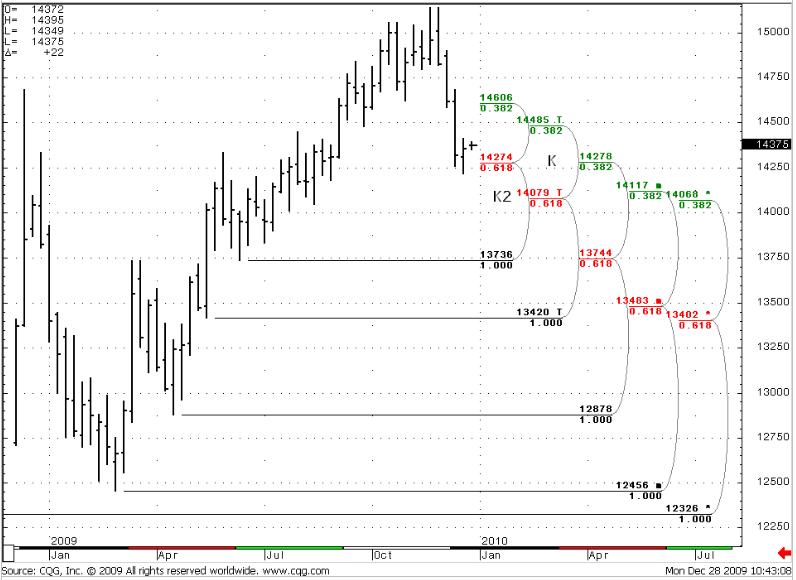
Weekly (EURO FX all sessions CME futures)
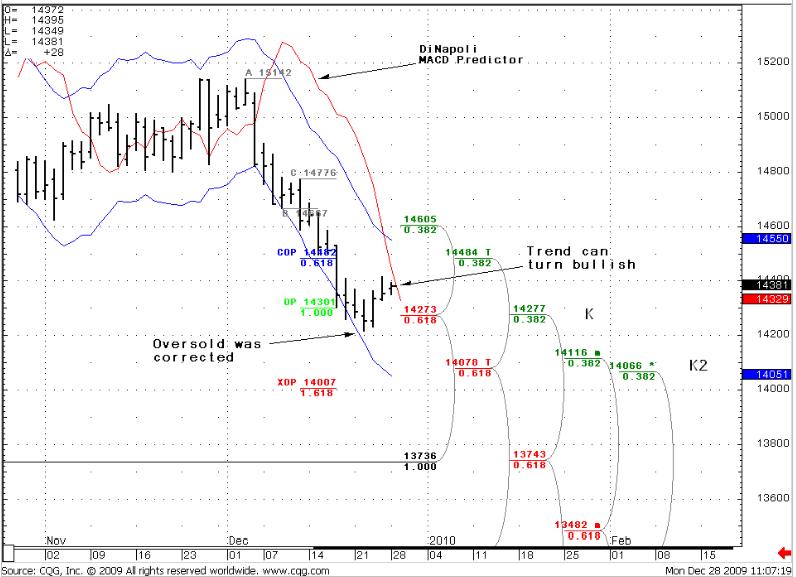
On a weekly chart Confluence area 1.4274-1.4278 holds. The market has started retracement up. The weekly trend is bearish, no oversold. Also an important thing that I would like to talk about is a K2 Confluence area 1.4068-1.4079. This area includes 0.382 from a major reaction point. It’s very important support.
Weekly
Daily (EURO FX all sessions CME futures)
The daily chart is the most interesting one and has at least two possibilities to trade. The market has reached a strong weekly (and daily) Confluence area with a strong oversold level, reached OP at 1.4301 and started a retracement higher. During this retracement the market already has corrected oversold to neutral. Besides, the market is near to change trend to bullish.
The daily potential trade is not yet come to pass. As you can see on Daily#2 chart, the market already has a close above the 3x3 MA. For a clear signal we need close below it, and then second close above. This is call Double Repo trade. I can't estimate a specific target for it yet, but potentially it can be around the K2 resistance area. But the conditions of confirmation are very strict. The example of this kind of trade is present in recent Trade Description (although on hourly chart).
The second possibility for trade discussed below in hourly time-frame.
Daily #1
Daily #2
Hourly (EURO FX all sessions CME futures)
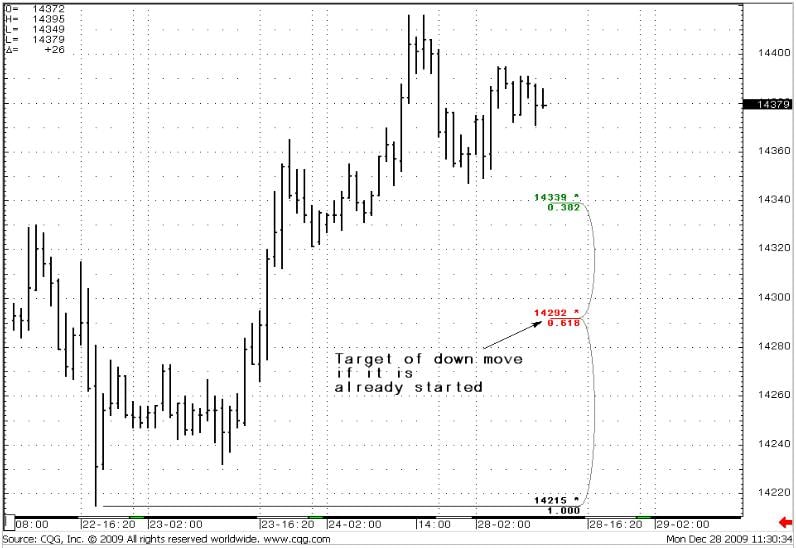
The trend on the hourly chart turns bearish, during the recent up move market has reached COP=1.4404 at 1.4405 Fib resistance level (that makes an Agreement by the way) and began a down move. Although an additional up move is still possible to happen, it does not change the idea of the trade. We should get a down pullback to the 0.618 support of the whole up move on the hourly chart, because of strong daily down thrust that has strong momentum. The current target of this down move is shown on the hourly#2 chart.
Hourly #1
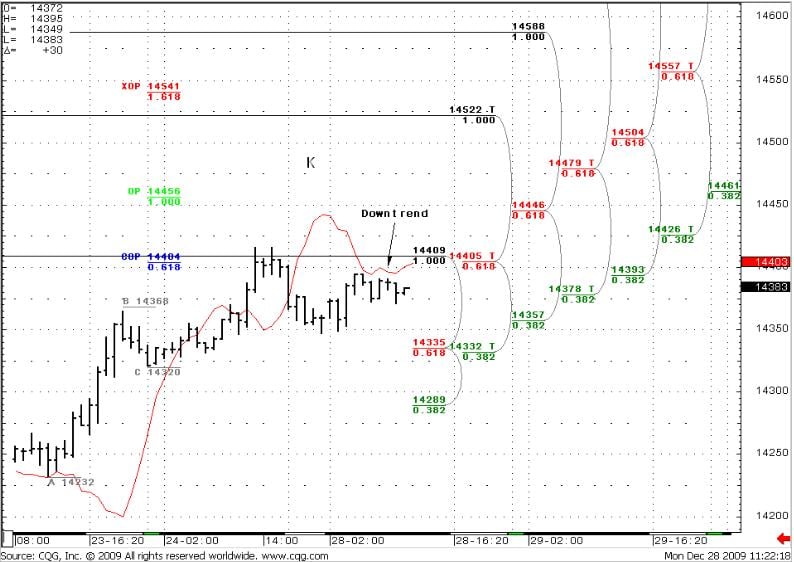
Hourly #2
Trade EUR/USD possibilities (1):
Monthly
I expect technical retracement up due to market momentum. I think it should happen regardless to trend that will be. Taking into consideration the current situation on daily chart it can start from this level. But we have no confirmation of the signal yet.
Weekly
No oversold, the trend is bearish. Looks like a retracement has started form 1.4250 Confluence area.
Daily
Good opportunity for a bull trade can appear soon. But we need to see strict confirmation of this signal. The context that we already have for that trade looks good.
Hourly
This potential bearish trade will be the component of a daily development (as a result we should see close below 3x3 MA). There is a risk although, that the up move is not finished yet. It can reach a K area at 1.4475-1.4480 level. Anyway, when the down move will start, the target is the 0.618 Fib support of the whole up move.
(1) “Trade possibilities” are not detailed trade signals with specific entries and exits. They are expectations about possible moves of the market during the week based on market analysis.
<!-- AddThis Button BEGIN -->
<div class="addthis_toolbox addthis_default_style">
<a class="addthis_button_facebook"></a>
<a class="addthis_button_email"></a>
<a class="addthis_button_favorites"></a>
<a class="addthis_button_print"></a>
<span class="addthis_separator">|</span>
<a href="http://www.addthis.com/bookmark.php?v=250&pub=fb-promotion" class="addthis_button_expanded">More</a>
</div>
<script type="text/javascript" src="http://s7.addthis.com/js/250/addthis_widget.js?pub=fb-promotion"></script>
<!-- AddThis Button END -->
General Notice: Information has been obtained from sources believed to be reliable, but the author does not warrant its completeness or accuracy. Opinions and estimates constitute author’s judgment as of the date of this material and are subject to change without notice. Past performance is not indicative of future results. This material is not intended as an offer or solicitation for the purchase or sale of any financial instrument. The opinions and recommendations herein do not take into account individual client circumstances, objectives, or needs and are not intended as recommendations of particular securities, financial instruments or strategies to particular clients. The recipients of this report must make their own independent decisions regarding any securities or financial instruments mentioned herein.