EURUSD Forex Forecast (Updated Daily)

eurusd daily movement

last week i had huge expectation interest rate would be changed, but ecb has no surprises yet. but inflation in uk gave good movement yesterday.

now price howering within inchmoku kinko hyo which is toped at around 1.3624 got to see if eurusd could manage and close above that price this week to retest 1.4000
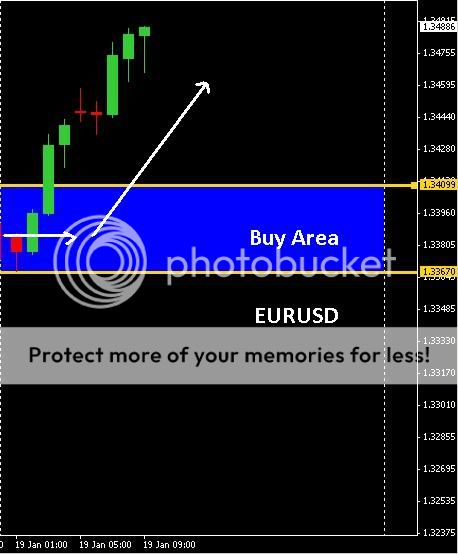
 
EURUSD Forex Forecast January 19, 2011

Hello everyone,

Today we expect the EURUSD to head North between the 1.33670 and 1.34099 barrier area.
Here is a Visual of our Forecast for January 19, 2011

Jan-19_01.jpg


Note that all analysis are personally edited and approved by Forex Analyst Navin Prithyani.

Regards,
Angela
 
Timing and completeness

Hi,
I have been following these forecasts and from what I can see so far they look good, I have a few questions.

1. You are posting these charts late in the day, presumably you are saying that these are the charts that you are sending to your subscribers much earlier but just posting here as examples, after the event?

2. There are days missing from the sequence e.g. 5th, 6th, 18th Jan. What are we to make of this? That you did not issue a forecast on those days or that the results were horrible and you did not want to show them? Can you tell us what happened on those days?

3. On some charts where the latest shown price is not in the Buy or Sell area you show an arrow indicating that appears to indcate that the price has to get back to that Buy/Sell area before then indicating which way it is expected to move after that. But today (19 Jan) you show the initial arrow horizontal and then climbing. Since the latest price on the chart is already way above the Buy Area does this mean that the opporunity is lost or that users would have to wait for a retracement to the Buy/Sell area?

Thanks,
Graham
 
Hello Graham,

To answer your questions, possibly different time zone clash.
The day's that are missing there either is not a forecast for that day, due to personal business not the analyst.
I'm afraid I can not answer questions 3.
I am still trying to learn as much as I can and that seems like a very advanced question for me :)

Thank you for the compliments though, please do follow the thread for more posts to come :)

Thanks,
Angela

Hi Angela,

I agree with Graham, that the Chart you posted today is not corresponding to the market happening of the time you submitted it.
It has nothing to do with time difference in Countries, because at the time you submitted it, the market was already far away from it.
In the image I attached, I marked with blue the area you refer as buy area, where the lowest point you mention is 125 pips away from the current rate at that very moment. It looks to me more like the chart of the day before.

Sometimes the posts are in queue and it can take several hours before they show up. Did this happen with the specific post?

BTW I noticed that your posts counter is always 0. Why is that?
 

Attachments

  • time.gif
    time.gif
    19.3 KB · Views: 31
Hi F-man,

I'm a secretary, but to view the chart that I have posted and to view your chart, you are suggesting different times, please note the time of the chart.

The chart is for the 19th, and I see that on your chart you have marked MY chart to reflect a different time frame. So I would have to say yes, time is a factor here, and to correct myself not the time zone. You can not tell me that My chart is late when you look at my chart and put it to your current 20:00 hour time frame when I posted this chart for the early morning.

The chart does show 4 hour intervals, and the time is located on the chart. Looking at it from your prespective of your chart, you are suggesting that my chart is for the 20:00 hour of January 19th. When the chart I posted is indeed for the hour of 04:00. Over all both charts reflect the same.

Please do recheck the time of my chart, again and if you can not see what I am saying let me know.

Kind Regards,
Angela

Hi Angela,

I prefer, instead of spending time to check what happened yesterday to wait and analyse the next chart that you are going to post.
When do you plan to post the next one? (Please mention also your time zone, when mentioning time)
 
Back
Top