EURUSD Technical Analysis by GetKnowTrading

GetKnowTrading

Recruit
Messages
83
Hi to all of you.

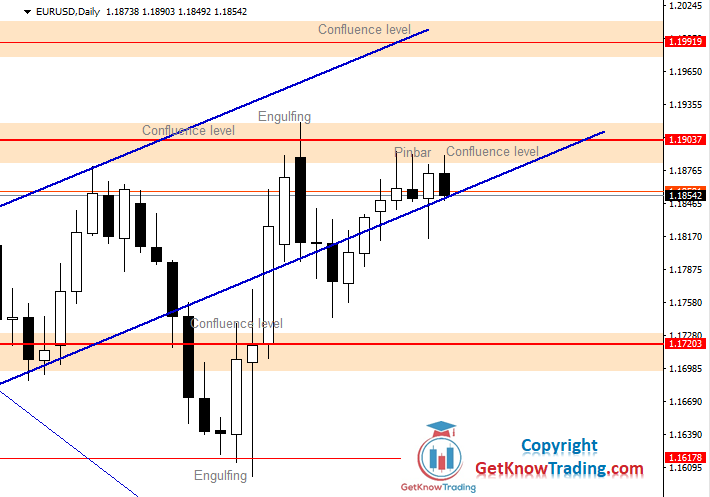
I would like to share my analysis on EURUSD pair which I like to trade and to analyse. I hope you will like it. Feel free to check it out and leave a comment.

This week price reached $1.16178 level and then make a pullback to $1.16700 – $1.17000 area.

The price did just that and reached uptrend channel support level which is a confluence of horizontal resistance and uptrend support line. From there the price returned back to $1.16178, but since then the price changed from the bearish into the bullish sentiment.

When the price reaches $1.19000 – $1.19300 level we could see the price making a pullback back to $1.18200 before moving further up. The $1.18200 is an uptrend channel support area which will stop the price from falling down to $1.17000.


EURUSD Daily Forecast 07_11_2020.png
 
In the previous analysis I have pointed out that the two things can happen.

the pair could reach $1.19000
and then make a pullback to $1.18200

Both points were realized last week in just one day, on Monday.

Since the price broke below the uptrend channel support line and it bounced back to the same level I am now open to sit and wait.


EURUSD Daily Forecast 14_11_2020.png
 
In the analysis from the last week I said that the market does not look too bullish that would move the price easily up to $1.19000. The market overview shows just that.

The pip range this week was 80 pips and it means that the price was in the indecision area. The middle of the range area between $1.17000 and $1.19000 is still holding the price from large movements.

I am expecting the price will try to break above $1.19000, but before doing that it could make a pullback to the area between $1.18150 – $1.18200 which is the current support that held the price two times this week.

EURUSD Daily Forecast 21_11_2020.png
 

The market week behind us has done a huge move forward. The price has done two things I have mentioned in the previous week forecast.

The price:

Made a pullback to $1.18150 – $1.18200 area
Bounced back above $1.19000

New highs for EURUSD are in this order.
First high is around $1.20800 where the price will probably stop and make a pullback. This level acted in the past as a strong resistance.

On the chart it is visible that the uptrend channel resistance line is making a confluence of resistance at that area together with the horizontal resistance line.
EURUSD Daily Forecast 28_11_2020.png
 

After reaching the $1.20000 level the price bounced down as a reaction to strong sellers and buyers who took the profits.
Strong resistance level acted as a strong psychological level(round number) that forced buyers to exit and sellers to enter.

At the $1.20800 level price could find support to move higher and head towards $1.25000.

The first resistance level that is stopping the price reaching $1.25000 is $1.22845. It is an area around $1.3000 level.
EURUSD Daily Forecast 05_12_2020.png
 

EURUSD chart shows the price behaviour in the previous week. What is visible is the price pullback from $1.21793 to $1.20800 which is the first support level.

The daily close of Thursday candle was not above previous daily candles close, $1.21430 level, which is now an important resistance level to break in order to continue moving up.

I am bullish oriented for now until the price is above $1.20000 and until the price reaches $1.25000.
EURUSD Daily Forecast 12_12_2020.png
 

At the beginning of the week the price has stalled at that level. The price returned back to the previous uptrend channel resistance line and then bounced back up.
The next day, on Tuesday, the price made an indecision candle, but the candle closed with price above $1.21430.

The next week will be a slow week due to holiday, but I am expecting the price to reach the $1.25000 level eventually.
The next resistance will be again on the $1.22845 and after that $1.24000. What we can see is that the price for now does not have any strong resistance except $1.24000 level.
EURUSD Daily Forecast 19_12_2020.png
 

In the previous week forecast I have mentioned that the pair could make a retrace back to $1.21793 which happened already on Tuesday.

The price retraced back strongly and formed a bullish Pinbar. The Pinbar shows us that the market is still supported with strong buyers waiting on the support level. The $1.21793 level is a confluence of support.

The market is moving steadily to the upside. The resistance levels are $1.22845 and $1.24000 which will hold the price from reaching $1.25000.
EURUSD Daily Forecast 26_12_2020.png
 

We had EURUSD making a bullish candle on the confluence support area right at the start of the week.

As I said in the previous week EURUSD forecast the support $1.21793 was the support that holds the price from falling down.

We can expect the price to reach a confluence level of support and from there move up. The $1.22845 is the resistance that will be harder to break above.

When that happens the price will have $1.24000 level as a harder level before it reaches $1.25000
EURUSD Daily Forecast 02_01_2021.png
 

The return inside range was strong. Two large bearish candles have wiped two weeks’ bulls’ work.

The price stopped at the support level $1.21793.

That level is the previous confluence of support which is now preventing the price from falling down.

If the price does not close below $1.21600 it could stay inside the range between $1.21793 and $1.22845.
EURUSD Daily Forecast 09_01_2021.png
 
Back
Top