STRATEGIST
Private, 1st Class
- Messages
- 3
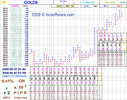
EUR/USD
H4 graph
The pair keeps trading along a sideways trend (“O-O+”) between two key levels – 1.4390 (a very strong resistance) and 1.4215 (turning level). This trend is transforming into a “triangle” figure, which is being formed now and has its top at level 1.4425, where the 4th wave of this figure is supposed to emerge. Basically, we may consider the figure as such that will turn the sideways trend either upwards or downwards, so we should take the levels into consideration anyway.
There are two variants of events to proceed:
1. If the pair breaks above level 1.4425, the “triangle” figure may be treated as an uptrend-continuing figure. This way, the market sets the target of growth to level 1.4580. However, there is a very strong resistance on the way up – level 1.4500 (the higher boundary of “C-C+” sideways trend weekly). So, we may try to open buy positions above 1.4425, then it is necessary to close them right before approaching 1.4500 and buy additionally only upon break above ~1.4545.
2. The “triangle” figure is becoming the figure bearing a downtrend in case the pair breaks below level 1.4215 (gets below “B” and “O” trend lines); in such case the pair will get to essential support 1.4085 (“P” trend lines).
Personal prejudice:
I wouldn’t trade for buying while the pair is located above level 1.4545, since there are a whole lot of important resistances, which won’t let the market to pass them easily – the market is going to twitch. It is more secure to sell after drop below level 1.4215 with the target set to 1.4085.