Real-Forex.com
Banned
- Messages
- 1
Forex Daily review- 27.06.2012
Tracking the EUR/USD pair
Date: 26.06.2012 Time: 17:29 Rate: 1.2492
Daily chart
Last Review
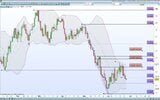
The price did not succeed to close above the 1.2670 price level and created a sharp descending move while the price is currently located under the 1.2519 price level. Closure of the candle under this level at the end of the trading day will indicate that the 1.2436 support level will be its first target. Breaking this level will probably lead the price towards the last low at the 1.2290 price level.
Current review for today
As it was written in yesterday’s review, the price did close under the 1.2519 price level and descend towards the mentioned support level. Breaking of this level in a proven way will probably lead the price to check the last low at the 1.2290 price level. in addition, it is possible to see that the price is currently located under the moving average of the Bollinger Bands, this is a sign that the pair is currently Bearish. In case the price will stop at the current level, it is possible that it will perform a correction in size of between a third and two thirds of the last downtrend which started at the 1.2750 price level (more about it in the 4 hour chart review).
You can see the chart below:

4 Hour chart
Date: 26.06.2012 Time: 17:42 Rate: 1.2494
Last Review
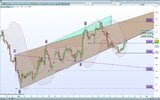
Since the last review it looks like the “Wolfe waves” pattern is fulfilling its destination. The price seem to make its way towards this pattern target which is located on the crossing of the price with the line connecting between points 1 and 4. This target is around the last low on the 1.2290 price level. It is possible to see how the Bollinger’s moving average is creating a sharp angle downwards and will be a dynamic resistance that will try to stop any movement upwards.
Current review for today
The price reached the 1.2440 support level which stopped the downtrend and it is possible that from this point we will see the a move upwards to the Bollinger moving average and the closest resistance at the 1.3535 price level, the general direction stays as it was- the “Wolfe waves” pattern target, meaning the crossing of the price with the line connecting points 1 and 4.
You can see the chart below:

GBP/USD
Date: 26.06.2012 Time: 17:57 Rate: 1.5633
4 Hour chart
Last Review
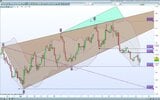
Since the last review it looks like the “Wolfe waves” pattern is fulfilling its destination. The price seem to make its way towards this pattern target which is located on the crossing of the price with the line connecting between points 1 and 4. This target is around the last low on the 1.5400 price level. It is possible to see how the Bollinger’s moving average is creating a sharp angle downwards and will be a dynamic resistance that will try to stop any movement upwards.
Current review for today
The last downtrend (red broken line) stopped at the 1.5540 price level and at the moment it is after a correction in size of between a third and two thirds by Fibonacci. As long as the price does not breach the 1.5690 price level, it is possible to assume that the “Wolfe waves” pattern is still valid, breaking the 1.5540 price level will strengthen the downtrend towards the pattern target on the crossing of the price with the line connecting points 1 and 4. On the other hand, breaking of the 1.5686 price level will lead the price towards the last peak on the 1.5777 price level.
You can see the chart below:

AUD/USD
Date: 26.06.2012 Time: 18:11 Rate: 1.0059
4 Hour chart
Last Review
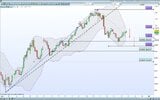
The price has broken the ascending trend line which connects the lows (black broken line), and even created a descending price structure by breaking the 1.0008 price level. At the moment the price is establishing on the 0.9980 price level, this is a 38.2% Fibonacci correction level of the last uptrend (blue broken line). Breaking of this level will indicate that the price will continue towards its first target on the 0.9940 price level, this is a target level of the “One in, one out” pattern (red broken lines). Breaking of this level will indicate that the price will continue its movement down towards the 0.9900 price level which is a 50% correction level of the mentioned uptrend. On the other hand, stoppage of the price at the current level followed by breaking the 1.0075 price level will indicate that the price will check again the last peak area on the 1.0224 price level.
Current review for today
The price did not succeed to breach the 0.9980 price level and made a move upwards to the 1.0075 resistance level. Proven breaking of this level will sign that it is possible to see the price continues towards the last peak on the 1.0224 price level. On the other hand, stoppage of the price at the current area and breaking the 0.9980 price level will indicate that it is possible that the price will descend towards its first target on the 0.9940 price level, which is the “One in, one out” pattern target (red broken lines). Breaking of this level will probably continue the move downwards to the 0.9900 price level, which is a 50% Fibonacci correction level of the uptrend marked in blue broken line.
You can see the chart below:

Important announcements for today:
13.30 (GMT+1) USD – Core Durable Goods Orders (Monthly)
15.00 (GMT+1) USD – Pending Home Sales (Monthly)
Provided by Real-Forex.com
Tracking the EUR/USD pair
Date: 26.06.2012 Time: 17:29 Rate: 1.2492
Daily chart
Last Review
The price did not succeed to close above the 1.2670 price level and created a sharp descending move while the price is currently located under the 1.2519 price level. Closure of the candle under this level at the end of the trading day will indicate that the 1.2436 support level will be its first target. Breaking this level will probably lead the price towards the last low at the 1.2290 price level.
Current review for today
As it was written in yesterday’s review, the price did close under the 1.2519 price level and descend towards the mentioned support level. Breaking of this level in a proven way will probably lead the price to check the last low at the 1.2290 price level. in addition, it is possible to see that the price is currently located under the moving average of the Bollinger Bands, this is a sign that the pair is currently Bearish. In case the price will stop at the current level, it is possible that it will perform a correction in size of between a third and two thirds of the last downtrend which started at the 1.2750 price level (more about it in the 4 hour chart review).
You can see the chart below:

4 Hour chart
Date: 26.06.2012 Time: 17:42 Rate: 1.2494
Last Review
Since the last review it looks like the “Wolfe waves” pattern is fulfilling its destination. The price seem to make its way towards this pattern target which is located on the crossing of the price with the line connecting between points 1 and 4. This target is around the last low on the 1.2290 price level. It is possible to see how the Bollinger’s moving average is creating a sharp angle downwards and will be a dynamic resistance that will try to stop any movement upwards.
Current review for today
The price reached the 1.2440 support level which stopped the downtrend and it is possible that from this point we will see the a move upwards to the Bollinger moving average and the closest resistance at the 1.3535 price level, the general direction stays as it was- the “Wolfe waves” pattern target, meaning the crossing of the price with the line connecting points 1 and 4.
You can see the chart below:

GBP/USD
Date: 26.06.2012 Time: 17:57 Rate: 1.5633
4 Hour chart
Last Review
Since the last review it looks like the “Wolfe waves” pattern is fulfilling its destination. The price seem to make its way towards this pattern target which is located on the crossing of the price with the line connecting between points 1 and 4. This target is around the last low on the 1.5400 price level. It is possible to see how the Bollinger’s moving average is creating a sharp angle downwards and will be a dynamic resistance that will try to stop any movement upwards.
Current review for today
The last downtrend (red broken line) stopped at the 1.5540 price level and at the moment it is after a correction in size of between a third and two thirds by Fibonacci. As long as the price does not breach the 1.5690 price level, it is possible to assume that the “Wolfe waves” pattern is still valid, breaking the 1.5540 price level will strengthen the downtrend towards the pattern target on the crossing of the price with the line connecting points 1 and 4. On the other hand, breaking of the 1.5686 price level will lead the price towards the last peak on the 1.5777 price level.
You can see the chart below:

AUD/USD
Date: 26.06.2012 Time: 18:11 Rate: 1.0059
4 Hour chart
Last Review
The price has broken the ascending trend line which connects the lows (black broken line), and even created a descending price structure by breaking the 1.0008 price level. At the moment the price is establishing on the 0.9980 price level, this is a 38.2% Fibonacci correction level of the last uptrend (blue broken line). Breaking of this level will indicate that the price will continue towards its first target on the 0.9940 price level, this is a target level of the “One in, one out” pattern (red broken lines). Breaking of this level will indicate that the price will continue its movement down towards the 0.9900 price level which is a 50% correction level of the mentioned uptrend. On the other hand, stoppage of the price at the current level followed by breaking the 1.0075 price level will indicate that the price will check again the last peak area on the 1.0224 price level.
Current review for today
The price did not succeed to breach the 0.9980 price level and made a move upwards to the 1.0075 resistance level. Proven breaking of this level will sign that it is possible to see the price continues towards the last peak on the 1.0224 price level. On the other hand, stoppage of the price at the current area and breaking the 0.9980 price level will indicate that it is possible that the price will descend towards its first target on the 0.9940 price level, which is the “One in, one out” pattern target (red broken lines). Breaking of this level will probably continue the move downwards to the 0.9900 price level, which is a 50% Fibonacci correction level of the uptrend marked in blue broken line.
You can see the chart below:

Important announcements for today:
13.30 (GMT+1) USD – Core Durable Goods Orders (Monthly)
15.00 (GMT+1) USD – Pending Home Sales (Monthly)
Provided by Real-Forex.com