Real-Forex.com
Banned
- Messages
- 1
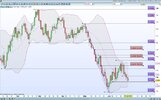
Tracking the EUR/USD pair
Date: 27.06.2012 Time: 16:48 Rate: 1.2456
Daily chart
Last Review
As it was written in yesterday’s review, the price did close under the 1.2519 price level and descend towards the mentioned support level. Breaking of this level in a proven way will probably lead the price to check the last low at the 1.2290 price level. In addition, it is possible to see that the price is currently located under the moving average of the Bollinger Bands, this is a sign that the pair is currently Bearish. In case the price will stop at the current level, it is possible that it will perform a correction in size of between a third and two thirds of the last downtrend which started at the 1.2750 price level (more about it in the 4 hour chart review).
Current review for today
For the moment the price is trying to check once again the 1.2457 support level, breaking of this level in a proven way will probably continue the downtrend, at first stage towards the lower Bollinger band, and towards the last low at the 1.2290 price level as the second target. On the other hand, stoppage of the price at the current area and it is possible that the price will perform a correction in size of between a third and two thirds of the last downtrend which started at the 1.2750 price level.
You can see the chart below:

4 Hour chart
Date: 27.06.2012 Time: 17:01 Rate: 1.2458
Last Review
The price reached the 1.2440 support level which stopped the downtrend and it is possible that from this point we will see the a move upwards to the Bollinger moving average and the closest resistance at the 1.3535 price level, the general direction stays as it was- the “Wolfe waves” pattern target, meaning the crossing of the price with the line connecting points 1 and 4.
Current review for today
It is possible to see that the price stayed under the Bollinger’s moving average which is used as a dynamic resistance, as long as the price is under this MA it is located in the bearish area of the Bollinger bands. Breaking of the 1.2440 price level will probably lead the price towards the “Wolfe waves” pattern target on the crossing of the price with the line connecting between points 1 and 4 (around the last low at the 1.2290 price level). on the other hand, stoppage at the current area will sign that it is possible to see a correction in size of a third of the last downtrend (blue broken line), meaning the 1.2560 price level.
You can see the chart below:

GBP/USD
Date: 27.06.2012 Time: 17:13 Rate: 1.5556
4 Hour chart
Last Review
The last downtrend (red broken line) stopped at the 1.5540 price level and at the moment it is after a correction in size of between a third and two thirds by Fibonacci. As long as the price does not breach the 1.5690 price level, it is possible to assume that the “Wolfe waves” pattern is still valid, breaking the 1.5540 price level will strengthen the downtrend towards the pattern target on the crossing of the price with the line connecting points 1 and 4. On the other hand, breaking of the 1.5686 price level will lead the price towards the last peak on the 1.5777 price level.
Current review for today
It is possible to see that after the price has stopped at the 1.5540 price level for the first time, it made an ascending move towards the trend line connecting the lows (the line connecting between points 2 and 4) and stopped at this area. It is possible to assume that the short move upwards was actually a correction to the last downtrend (red broken line) and as it is written on yesterday’s review, breaking of the 1.5540 price level will probably continue the downtrend towards the “Wolfe waves” pattern target around the 1.5400 price level.
You can see the chart below:

AUD/USD
Date: 27.06.2012 Time: 19:17 Rate: 1.0074
4 Hour chart
Last Review
The price did not succeed to breach the 0.9980 price level and made a move upwards to the 1.0075 resistance level. Proven breaking of this level will sign that it is possible to see the price continues towards the last peak on the 1.0224 price level. On the other hand, stoppage of the price at the current area and breaking the 0.9980 price level will indicate that it is possible that the price will descend towards its first target on the 0.9940 price level, which is the “One in, one out” pattern target (red broken lines). Breaking of this level will probably continue the move downwards to the 0.9900 price level, which is a 50% Fibonacci correction level of the uptrend marked in blue broken line.
Current review for today
The price is currently struggling at the 1.0075 price level in its attempt to breach it. Proven breaching of this level will indicate that it is possible that the price will continue towards the last peak at the 1.0224 price level. On the other hand, stoppage of the price at this area and breaking the 0.9980 price level will lead the price towards its first target on the 0.9940 price level, this is the “One in, one out” pattern target (red broken lines). Breaking of this level will probably lead the price towards the 0.9900 price level, this is a 50% Fibonacci correction level of the uptrend described with blue broken line.
You can see the chart below:

Important announcements for today:
09.30 (GMT+1) GBP – Current Account
13.30 (GMT+1) USD – Unemployment Claims
Review brought to you by Real Forex | ECN broker
Date: 27.06.2012 Time: 16:48 Rate: 1.2456
Daily chart
Last Review
As it was written in yesterday’s review, the price did close under the 1.2519 price level and descend towards the mentioned support level. Breaking of this level in a proven way will probably lead the price to check the last low at the 1.2290 price level. In addition, it is possible to see that the price is currently located under the moving average of the Bollinger Bands, this is a sign that the pair is currently Bearish. In case the price will stop at the current level, it is possible that it will perform a correction in size of between a third and two thirds of the last downtrend which started at the 1.2750 price level (more about it in the 4 hour chart review).
Current review for today
For the moment the price is trying to check once again the 1.2457 support level, breaking of this level in a proven way will probably continue the downtrend, at first stage towards the lower Bollinger band, and towards the last low at the 1.2290 price level as the second target. On the other hand, stoppage of the price at the current area and it is possible that the price will perform a correction in size of between a third and two thirds of the last downtrend which started at the 1.2750 price level.
You can see the chart below:
4 Hour chart
Date: 27.06.2012 Time: 17:01 Rate: 1.2458
Last Review
The price reached the 1.2440 support level which stopped the downtrend and it is possible that from this point we will see the a move upwards to the Bollinger moving average and the closest resistance at the 1.3535 price level, the general direction stays as it was- the “Wolfe waves” pattern target, meaning the crossing of the price with the line connecting points 1 and 4.
Current review for today
It is possible to see that the price stayed under the Bollinger’s moving average which is used as a dynamic resistance, as long as the price is under this MA it is located in the bearish area of the Bollinger bands. Breaking of the 1.2440 price level will probably lead the price towards the “Wolfe waves” pattern target on the crossing of the price with the line connecting between points 1 and 4 (around the last low at the 1.2290 price level). on the other hand, stoppage at the current area will sign that it is possible to see a correction in size of a third of the last downtrend (blue broken line), meaning the 1.2560 price level.
You can see the chart below:
GBP/USD
Date: 27.06.2012 Time: 17:13 Rate: 1.5556
4 Hour chart
Last Review
The last downtrend (red broken line) stopped at the 1.5540 price level and at the moment it is after a correction in size of between a third and two thirds by Fibonacci. As long as the price does not breach the 1.5690 price level, it is possible to assume that the “Wolfe waves” pattern is still valid, breaking the 1.5540 price level will strengthen the downtrend towards the pattern target on the crossing of the price with the line connecting points 1 and 4. On the other hand, breaking of the 1.5686 price level will lead the price towards the last peak on the 1.5777 price level.
Current review for today
It is possible to see that after the price has stopped at the 1.5540 price level for the first time, it made an ascending move towards the trend line connecting the lows (the line connecting between points 2 and 4) and stopped at this area. It is possible to assume that the short move upwards was actually a correction to the last downtrend (red broken line) and as it is written on yesterday’s review, breaking of the 1.5540 price level will probably continue the downtrend towards the “Wolfe waves” pattern target around the 1.5400 price level.
You can see the chart below:
AUD/USD
Date: 27.06.2012 Time: 19:17 Rate: 1.0074
4 Hour chart
Last Review
The price did not succeed to breach the 0.9980 price level and made a move upwards to the 1.0075 resistance level. Proven breaking of this level will sign that it is possible to see the price continues towards the last peak on the 1.0224 price level. On the other hand, stoppage of the price at the current area and breaking the 0.9980 price level will indicate that it is possible that the price will descend towards its first target on the 0.9940 price level, which is the “One in, one out” pattern target (red broken lines). Breaking of this level will probably continue the move downwards to the 0.9900 price level, which is a 50% Fibonacci correction level of the uptrend marked in blue broken line.
Current review for today
The price is currently struggling at the 1.0075 price level in its attempt to breach it. Proven breaching of this level will indicate that it is possible that the price will continue towards the last peak at the 1.0224 price level. On the other hand, stoppage of the price at this area and breaking the 0.9980 price level will lead the price towards its first target on the 0.9940 price level, this is the “One in, one out” pattern target (red broken lines). Breaking of this level will probably lead the price towards the 0.9900 price level, this is a 50% Fibonacci correction level of the uptrend described with blue broken line.
You can see the chart below:
Important announcements for today:
09.30 (GMT+1) GBP – Current Account
13.30 (GMT+1) USD – Unemployment Claims
Review brought to you by Real Forex | ECN broker