Sive Morten
Special Consultant to the FPA
- Messages
- 18,639
Monthly
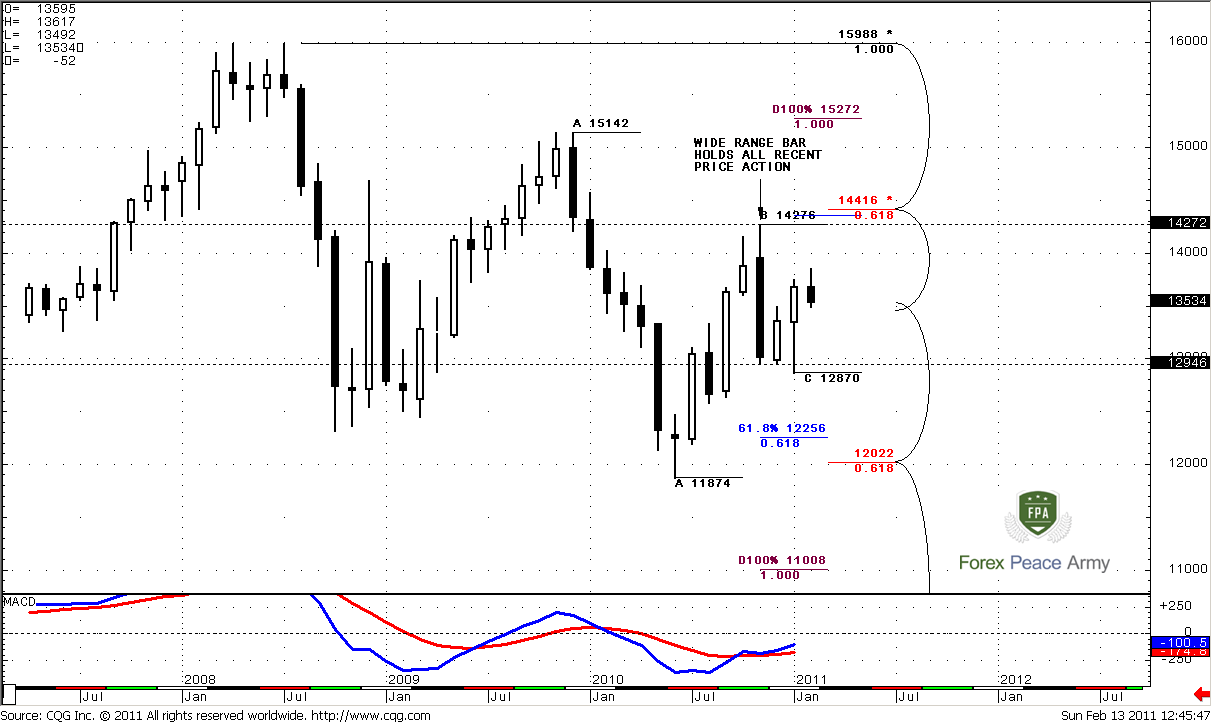
I leave monthly analysis intact, because there is nothing really new here. Again – the wide range bar holds the price action for 3 months already, so, the main event for us will be the moment of breakout of its range. Before this moment, I suppose, monthly analysis will be a bit boring…
Although Trend holds bullish, market still stuck with the range of a huge nasty bar. This is quite common, when after strong move market stands in their range for some time. Currently we see it on monthly time frame. Nevertheless, the nearest upside target is 0.618 Fib expansion is at 1.4354 that creates an Agreement with 5/8 Fib resistance at 1.4416. The nearest downside target is 1.2256, Fib support stays at 1.2022, but it has been tested once already.
Weekly
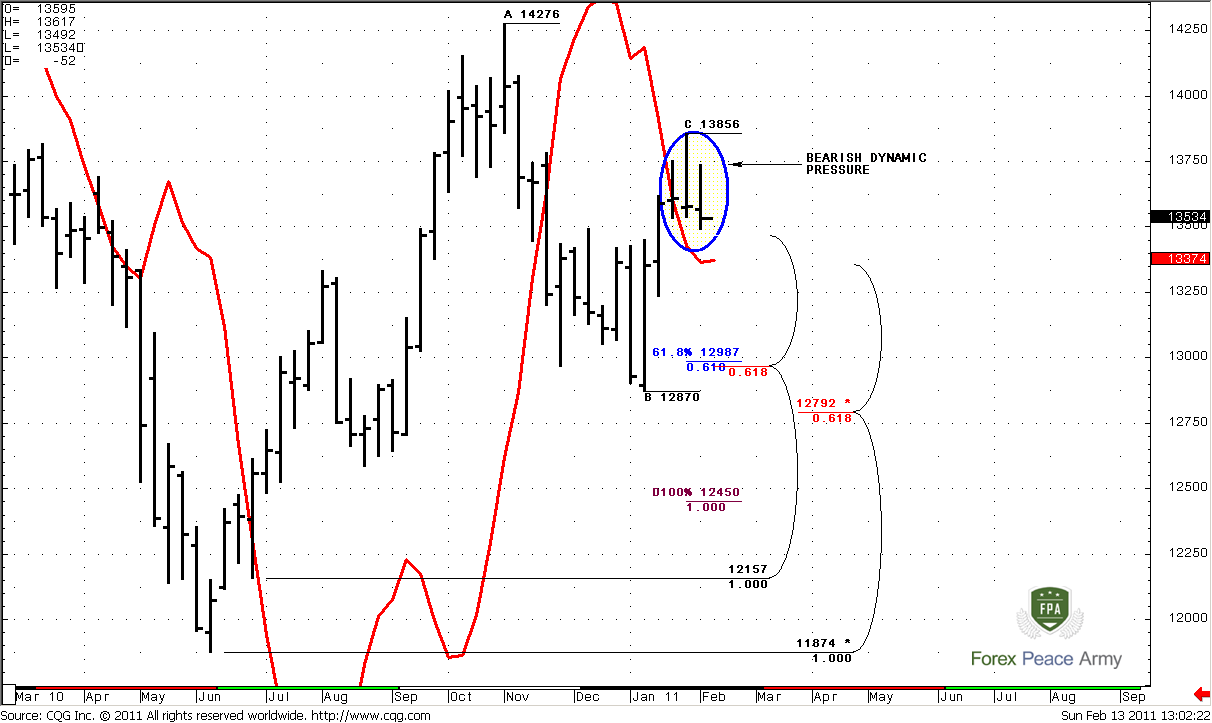
Weekly time frame has an extremely important pattern for midterm period. This is a bearish Dynamic Pressure (DP) that could be determined with DiNapoli MACD Predictor (red line on the chart). This gives me some bearish confidence, although I prefer to see some confirmation of this pattern. So, what is a nature of DP?
In general DP is a divergence of price action and MACDP line. Look at the fragment in circle, see – although trend holds bearish, the price action does not confirm this fact – market creates lower highs, and week by week market closes near the lows. This is bearish dynamic pressure. If market will shift trend to bearish soon, then I expect move at least to nearest target at 1.2987, that also an Agreement with 5/8 Fib support, although it has been tested ones already. So, be careful if you’re bullish, watch for this price behavior.
Daily
Ok, on previous week we’ve discussed the DRPO pattern that now shows strength. Usually, DRPO never stops at 0.618 target, and as a rule reaches 100% Fib expansion, that stands at 1.3385. Let’s take a look at Friday’s price action. Market has reached 1.3520 target that we’ve discussed in daily video. Also we’ve said that possibly market-makers should clear the previous lows, that has happened also – see the circle on the chart, this is W&R. So, Due to this reasons I expect some retracement up, that could be used for entering on the short side.
Just below the market daily confluence support at 1.3472-1.3479, weekly pivot support 1 at 1.3438 that coincides with monthly pivot point. Let’s take a look at resistances to estimate where is suitable level to enter short.
#1
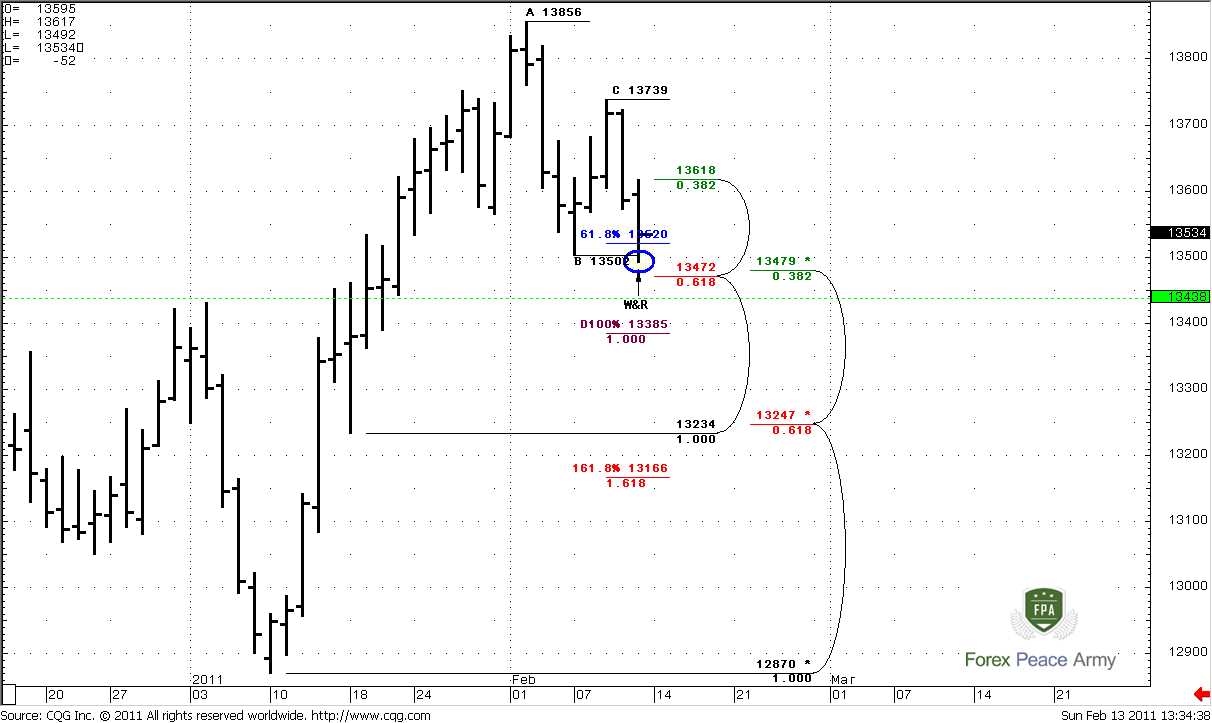
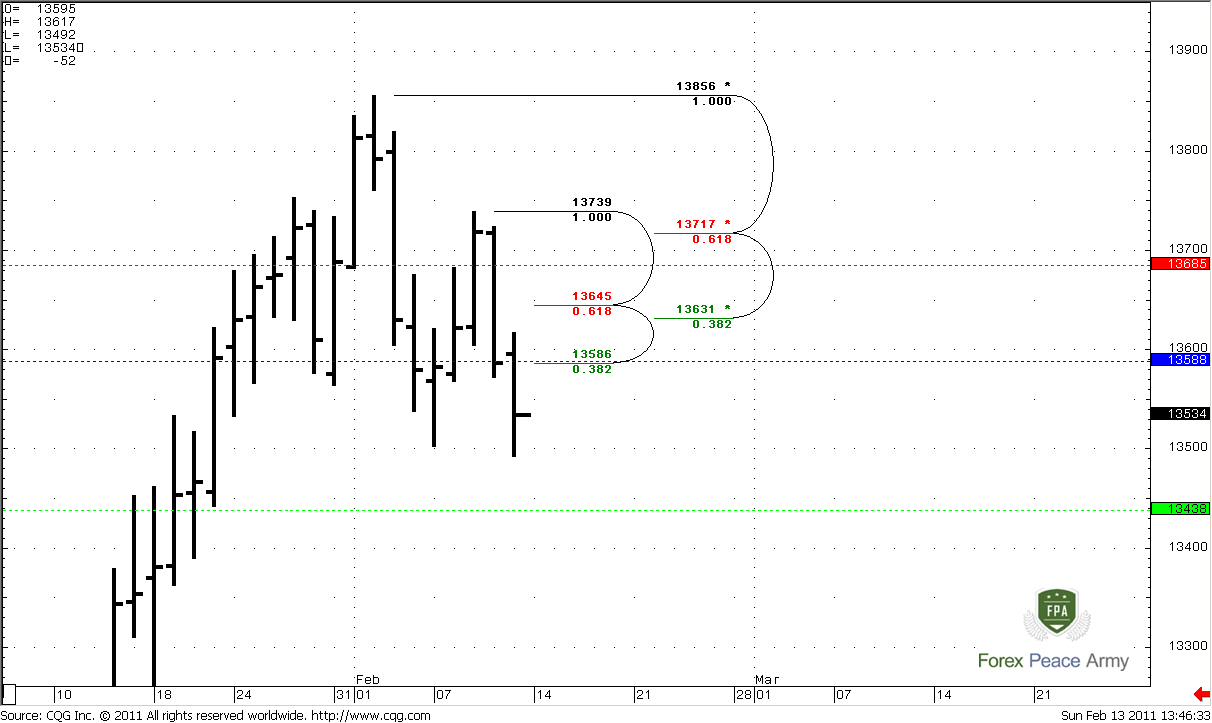
Well, guys, I think you see all stuff by yourself already. Still, the first area of resistance is 1.3586-1.3588, that includes Fib resistance and weekly pivot point. Next area is rather strong – daily Confluence resistance 1.3631-1.3645, just above this area 1.3685 is weekly pivot resistance 1. The last Fib 5/8 resistance stands at 1.3717 – very close to previous local high. So, any retracement, even to 1.3717 will be suitable and will not cancel bearish bias, but I prefer to see retracement not deeper than to 1.3685 (pivot resistance 1), better to 1.3650. Understand, if this is really DRPO, market has reached just 0.618 target – if it intends to go lower and there is a bearish power still on the market – it should not show deep retracement. It will be perfect, if retracement will be just till 1.3586.
#2
4-Hour
Here we clearer can see Friday’s W&R. So, market at LPO, shows W&R, I think we should expect some bouncing to the upside. On 4-hour chart we see excellent thrust down, and first close above 3x3 already. So, it could be DRPO “Buy” or B&B “Sell”. At the same time I can’t exclude appearing of new lows during DRPO – look at ABC pattern (although BC leg is too blur), OP at 1.3465, so if market will start to form DRPO, it could establish new lows. And return to our talks about depth of a possible retracement – if it will be DRPO, then retracement should be at least to daily K-area.

Conclusion:
I have a bearish view on EUR/USD currently, even on medium-term period. Market is forming bearish dynamic pressure on weekly time frame, that potentially could lead to 1.30 (we’ll see it a bit later).
On daily time frame, DRPO is still in play, and potentially, I suspect that market will reach 1.3385. But currently market stands at LPO and has shown W&R – this could lead to some bounce to the upside.
If you’re intraday trader – wait for some directional signal – B&B, DRPO “Buy” or failure DRPO. If market will accomplished DRPO “Buy” - you may enter Long. During the forming process be aware of new low possibility, because 4-hour OP target is at 1.3465.
If you’re day trader – wait the end of retracement, or DRPO failure pattern at 4-hour chart.
Track daily videos and updates, we will definitely talk about it.
The technical portion of Sive's analysis owes a great deal to Joe DiNapoli's methods, and uses a number of Joe's proprietary indicators. Please note that Sive's analysis is his own view of the market and is not endorsed by Joe DiNapoli or any related companies.
I leave monthly analysis intact, because there is nothing really new here. Again – the wide range bar holds the price action for 3 months already, so, the main event for us will be the moment of breakout of its range. Before this moment, I suppose, monthly analysis will be a bit boring…
Although Trend holds bullish, market still stuck with the range of a huge nasty bar. This is quite common, when after strong move market stands in their range for some time. Currently we see it on monthly time frame. Nevertheless, the nearest upside target is 0.618 Fib expansion is at 1.4354 that creates an Agreement with 5/8 Fib resistance at 1.4416. The nearest downside target is 1.2256, Fib support stays at 1.2022, but it has been tested once already.
Weekly
Weekly time frame has an extremely important pattern for midterm period. This is a bearish Dynamic Pressure (DP) that could be determined with DiNapoli MACD Predictor (red line on the chart). This gives me some bearish confidence, although I prefer to see some confirmation of this pattern. So, what is a nature of DP?
In general DP is a divergence of price action and MACDP line. Look at the fragment in circle, see – although trend holds bearish, the price action does not confirm this fact – market creates lower highs, and week by week market closes near the lows. This is bearish dynamic pressure. If market will shift trend to bearish soon, then I expect move at least to nearest target at 1.2987, that also an Agreement with 5/8 Fib support, although it has been tested ones already. So, be careful if you’re bullish, watch for this price behavior.
Daily
Ok, on previous week we’ve discussed the DRPO pattern that now shows strength. Usually, DRPO never stops at 0.618 target, and as a rule reaches 100% Fib expansion, that stands at 1.3385. Let’s take a look at Friday’s price action. Market has reached 1.3520 target that we’ve discussed in daily video. Also we’ve said that possibly market-makers should clear the previous lows, that has happened also – see the circle on the chart, this is W&R. So, Due to this reasons I expect some retracement up, that could be used for entering on the short side.
Just below the market daily confluence support at 1.3472-1.3479, weekly pivot support 1 at 1.3438 that coincides with monthly pivot point. Let’s take a look at resistances to estimate where is suitable level to enter short.
#1
Well, guys, I think you see all stuff by yourself already. Still, the first area of resistance is 1.3586-1.3588, that includes Fib resistance and weekly pivot point. Next area is rather strong – daily Confluence resistance 1.3631-1.3645, just above this area 1.3685 is weekly pivot resistance 1. The last Fib 5/8 resistance stands at 1.3717 – very close to previous local high. So, any retracement, even to 1.3717 will be suitable and will not cancel bearish bias, but I prefer to see retracement not deeper than to 1.3685 (pivot resistance 1), better to 1.3650. Understand, if this is really DRPO, market has reached just 0.618 target – if it intends to go lower and there is a bearish power still on the market – it should not show deep retracement. It will be perfect, if retracement will be just till 1.3586.
#2
4-Hour
Here we clearer can see Friday’s W&R. So, market at LPO, shows W&R, I think we should expect some bouncing to the upside. On 4-hour chart we see excellent thrust down, and first close above 3x3 already. So, it could be DRPO “Buy” or B&B “Sell”. At the same time I can’t exclude appearing of new lows during DRPO – look at ABC pattern (although BC leg is too blur), OP at 1.3465, so if market will start to form DRPO, it could establish new lows. And return to our talks about depth of a possible retracement – if it will be DRPO, then retracement should be at least to daily K-area.
Conclusion:
I have a bearish view on EUR/USD currently, even on medium-term period. Market is forming bearish dynamic pressure on weekly time frame, that potentially could lead to 1.30 (we’ll see it a bit later).
On daily time frame, DRPO is still in play, and potentially, I suspect that market will reach 1.3385. But currently market stands at LPO and has shown W&R – this could lead to some bounce to the upside.
If you’re intraday trader – wait for some directional signal – B&B, DRPO “Buy” or failure DRPO. If market will accomplished DRPO “Buy” - you may enter Long. During the forming process be aware of new low possibility, because 4-hour OP target is at 1.3465.
If you’re day trader – wait the end of retracement, or DRPO failure pattern at 4-hour chart.
Track daily videos and updates, we will definitely talk about it.
The technical portion of Sive's analysis owes a great deal to Joe DiNapoli's methods, and uses a number of Joe's proprietary indicators. Please note that Sive's analysis is his own view of the market and is not endorsed by Joe DiNapoli or any related companies.
") Hi Mate Good too see you are trying too learning
Hi Mate Good too see you are trying too learning