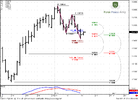
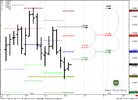
FOREX PRO Weekly 14-18 February, 2011

B&B Buy signal

Hi Sive

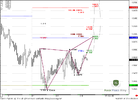
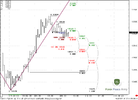
Thanks for your reply. Following your way of explanation of this B&B buy signal with potentially forming ‘W’ shape in the retracement move upside, can we assume that the first part of this ‘W’ shaped wave could be considered as ABC(top) pattern and then, entering the market on some suitable poolback from the top.

If this could be the case, what would be that ENTRY level, as well as - the corresponding EXIT level (maybe in terms of Fiv Expansion)?

Thanks!
 
EUR/USD Daily Update, Tue 15, February 2011

Good day,
Although we've expected some bouncing from 1.3520 - that has not happened and market has accelerated to the downside and reached:
1. Daily K-area at 1.3475-1.3479
2. Weekly pivot support +monthly pivot at 1.3438
3. Gartley AB=CD target at 1.3420 area.
At the same time, daily trend is strongly bearish.

So, if you are day trader - you have no context for enter long. Also you should not enter short also - because market stands at strong support and just has reached AB-CD target, it's ready for pullback.
I suggest you wait for pullback to enter short, and here is a couple of comments:
There are two areas that could appear to be suitable for open shorts - 1.36 (Daily K-resistance +weekly pivot) and 1.3690 (weekly pivot resistance 1+5/8Fib resistance) - watch intraday charts for Sell signals around them.

If you're intraday trader - you may use current situation for scalp Buy trades, but this should be just fast trade - not "Buy&Hold". The profit objectives are the same 1.36 or 1.3690, depending on how market will behave around them.

And common note - if market will take high at 1.3720 and hold above it - then bears' dominating will be under question. If bears are still strong - this should not happened.
 

Attachments

  • EUR_D_15_02_11.PNG
    EUR_D_15_02_11.PNG
    41.3 KB · Views: 215
  • EUR_D1_15_02_11.PNG
    EUR_D1_15_02_11.PNG
    40.7 KB · Views: 212
  • EUR_4H_15_02_11.PNG
    EUR_4H_15_02_11.PNG
    48.9 KB · Views: 213
EUR/USD Butterfly is forming

Nice butterfly is forming on hourly EUR chart. The first 1.272 target is 1.3590
 
Nice butterfly is forming on hourly EUR chart

Nice butterfly is forming on hourly EUR chart. The first 1.272 target is 1.3590

Hi Sive,

If possible, could you please attach this chart for improving our learning skills.

Thanks.
 
Hi Sive,

Thank you so much for your analysis you certainly know what you are talking about. I am a new trader but, I can easily follow your Charts descriptions.

Thank you for your emails. And is all FREE !!!!

Julia
Aussie Trader
 
eur/usd thanks

Thank you once again sive for your advise its good its true and its steady.
something that is rare in forex.
so i thank you
trimax:)
 
GBP/USD butterfly also?

Hi Sive

On gbp/usd also 1hr butterfly is forming... I am attaching the chart. Can you please tell me your opinion.

Thanks
Mili
 

Attachments

  • gbp-usd chart.gif
    gbp-usd chart.gif
    46.9 KB · Views: 173
Hi Sive,

If possible, could you please attach this chart for improving our learning skills.

Thanks.

Sure, Alf
look at attachement

Hi Sive

On gbp/usd also 1hr butterfly is forming... I am attaching the chart. Can you please tell me your opinion.

Thanks
Mili

Yes, Mili.
There are even two batterflies - one of them seems to be accomplished already, the other (big) is still forming...
 

Attachments

  • eur_1h_14_02_11.gif
    eur_1h_14_02_11.gif
    26.2 KB · Views: 174
EUR/USD Daily Update, Wed 16, February 2011

Good morning,
today we will start directly from intraday charts.

On hourly chart trend is bullish, and will remain bullish till 1.35-1.3510 area roughly. Now there are two patterns is forming - Butterfly and AB-CD, with targets around 1.3590-1.3600. So, what do we have around this area:
1. 1.272 target of Butterfly "Sell"
2. Target of AB-CD
3.Weekly pivot point at 1.3588
4. Daily K-resistance 1.3580-1.3619.

So, if you're day trader - wait for reaching of this area, drop your time frame and look for "Sell" signals.

If your are intraday trader - take a look at 15-min chart.
You can anticipate of reaching 1.36 (this is the target of this trade), entering Long with s/l below 1.3495. You may enter partially at first K-support and Agreement at 1.3516 and again at next support 1.3500-1.3508. Risk/reward ratio is nice. One thing that you do not want to see - shifting hourly trend to bearish, and this could only happen, if market will break 1.3490-1.350 area, that's why, we place stop right there -below 1.3495.
 

Attachments

  • EUR_1H_16_02_11.PNG
    EUR_1H_16_02_11.PNG
    42.7 KB · Views: 143
  • EUR_15m_16_02_11.PNG
    EUR_15m_16_02_11.PNG
    41.3 KB · Views: 145
Back
Top