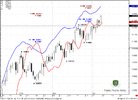
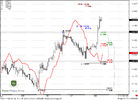
FOREX PRO Weekly April 04-08, 2011

EUR/USD 4 hr

Dear Sive

Thanks for your analysis.

In the weekly research you had mentioned a 4hr butterfly sell from 1.4370 region. Is that not valid because as you mentioned wash and rinse of previous highs and with all the doom and gloom ahead is that not a possibility?

Thanks in advance.

Mili
 
All currencies analysis

Dear Sive

This is completely irrelevant to the current thread but I wanted to ask you this since some time.

Some time back you did 3 major pair currency analysis - EUR/USD, GBP/USD and USD/JPY. That analysis use to give us a lot of options in case we could not trade one we could use the other pairs.

Is that something you could consider doing again? I know you are very busy and its difficult to do it but if you could do that it could be great.

Thanks a lot for your help.

Mili

Hi Mili,
well, it does not depend on me only. This is up to FPA administration mostly.
The point is that forumers not very interested in JPY, GBP, NZD and AUD pairs so much as EUR. Their attendance of those researches was much lower than EUR.
Sometimes as I see something interesting somewhere else, I can replace EUR for other pair. But not simulteniously.
That's why we've decided to keep only EUR analysis. Besides, Giant #2 does some work with AUD and NZD...
 
Thank you and where's to learn more

Dear Mr. Morten,

I've been wanting to write to thank you.

So ... Thank you :).

No I'm serious, i've been following you since your first post. I didn't like Elliot wave back then (like counting waves and sub waves and sub sub waves and so on and so on and that's elliot waves is not an indy) but thanks to the way you show it here (using many fibs in multiple TF), I enjoy it now.

Where did you learn Elliot wave in the first place anyway and do you have any recommendation or at least suggestion where/what we should learn more about Elliot wave (beside Robert Prechter's books and elliotwave.com).

Also I notice that you use MA that shifted forward. What and why is that ?, I use MA 1 just to help me count the waves.

I ask you this cause I'm not using DiNapoli (don't understand it), rarely use fibs (I use Band 20 and 10, and RSI 8) and trade in much lower MTF (like 1 minute). So it require much more discipline from myself.

Thank you very much for your guidance here. I really mean it.
 
EUR/USD Daily Update, Fri 08, April 2011

Good morning,
Market has shown real strength yesterday, and retraced precisely till 1.4230 area - area, that we do not want to see be broken to the downside (From bullish perspective). Market holds bull trend and accelerates up furhter.
So, today we have only bullish context for trading.

Meantime, If you're day traders or higher time frame - be aware of strong area of resistance around 1.44-1.4450. THere are some targets of larger time frames stand here. Also this is an area of monthly Agreement with major 5/8 Fib resistance from all time high.

On daily time frame trend is bullish. I see the only trend that could be done today - is entering long from 14320 with stop somewhere below 1.4270. Possible target is 1.4420.
Daily is not in overbought condition - all trends are bullish. So it's possible to enter from nearest Fib support.

P.S.
If you've tired from trading a bit and from all this stuff - FPA has released new chapters in Forex Military School. Get some rest and watch new pictures. Today is Friday :)
https://www.forexpeacearmy.com/forex-forum/forex-military-school/
 

Attachments

  • EUR_D_08_04_11.PNG
    EUR_D_08_04_11.PNG
    45.2 KB · Views: 125
  • EUR_1H_08_04_11.PNG
    EUR_1H_08_04_11.PNG
    43.4 KB · Views: 114
Last edited:
Hi Sive,

On my chart 1.4420 target is hit. (Without the possibility to enter at 1.4320/30 area). What about next target? Thanks.
 
Dear Mr. Morten,

I've been wanting to write to thank you.

So ... Thank you :).

No I'm serious, i've been following you since your first post. I didn't like Elliot wave back then (like counting waves and sub waves and sub sub waves and so on and so on and that's elliot waves is not an indy) but thanks to the way you show it here (using many fibs in multiple TF), I enjoy it now.

Where did you learn Elliot wave in the first place anyway and do you have any recommendation or at least suggestion where/what we should learn more about Elliot wave (beside Robert Prechter's books and elliotwave.com).

Also I notice that you use MA that shifted forward. What and why is that ?, I use MA 1 just to help me count the waves.

I ask you this cause I'm not using DiNapoli (don't understand it), rarely use fibs (I use Band 20 and 10, and RSI 8) and trade in much lower MTF (like 1 minute). So it require much more discipline from myself.

Thank you very much for your guidance here. I really mean it.

Interesting that you mention reading since the first post, then mention Elliot Waves. Mr. Morten uses Dinapoli's technical analysis, which might resemble the waves, but in reality is much more of a simple TA, and has been explained by Mr. Morten repeatedly in posts you apparently have read. Look for Joe Dinapoli's book, not here, as requested by Mr. Morten. I promise it will be the best analysis you will ever learn. This forum offers a way to double check your application of dinapoli levels, not so much a trading plan you should follow, but a way to confirm that your analysis is correct.

Also to the person who wants different pairs: if you see something post it, and Sive or someone will reply back to you. I am currently stalking a USD/CHF short on the weekly timeframe

Monthly looks bearish
Weekly also looks bearish if it closes below 3x3 DMA
Daily I would be looking to enter on a retrace up to .9145 area with target at 61.8% or .8799
Sive what do think?
 

Attachments

  • 2011-04-08-TOS_CHARTS.png
    2011-04-08-TOS_CHARTS.png
    47.8 KB · Views: 75
  • wkly2011-04-08-TOS_CHARTS.png
    wkly2011-04-08-TOS_CHARTS.png
    56.8 KB · Views: 66
  • daily2011-04-08-TOS_CHARTS.png
    daily2011-04-08-TOS_CHARTS.png
    67.9 KB · Views: 64
Dear Sive

Thanks for your analysis.

In the weekly research you had mentioned a 4hr butterfly sell from 1.4370 region. Is that not valid because as you mentioned wash and rinse of previous highs and with all the doom and gloom ahead is that not a possibility?

Thanks in advance.

Mili

Mili, this butterfly has shown some retracement, and we might say, that it partially has worked, but currently it absolutely cancelled by further upside price action.

Dear Mr. Morten,

I've been wanting to write to thank you.

So ... Thank you :).

No I'm serious, i've been following you since your first post. I didn't like Elliot wave back then (like counting waves and sub waves and sub sub waves and so on and so on and that's elliot waves is not an indy) but thanks to the way you show it here (using many fibs in multiple TF), I enjoy it now.

Where did you learn Elliot wave in the first place anyway and do you have any recommendation or at least suggestion where/what we should learn more about Elliot wave (beside Robert Prechter's books and elliotwave.com).

Also I notice that you use MA that shifted forward. What and why is that ?, I use MA 1 just to help me count the waves.

I ask you this cause I'm not using DiNapoli (don't understand it), rarely use fibs (I use Band 20 and 10, and RSI 8) and trade in much lower MTF (like 1 minute). So it require much more discipline from myself.

Thank you very much for your guidance here. I really mean it.

HI,
I'm not an expert with EW theory. When I've interested it, I've found that it's simple to see past waves, but you hardly can say where you're now, due to possible subwaves progression. So, I've found that this approach is not suitable for me.
But, there is one book, that shows very scrutiny approach to EW:

Glenn Neely "Mastering Elliot Wave: Presenting the Neely Method: The First Scientific, Objective Approach to Market Forecasting with the Elliott Wave Theory "

May be it helps...

Hi Sive,

On my chart 1.4420 target is hit. (Without the possibility to enter at 1.4320/30 area). What about next target? Thanks.

Hi, Alf
Well, I'll take a look during weekend, prepare new weekly research and we find out that :)
Also to the person who wants different pairs: if you see something post it, and Sive or someone will reply back to you. I am currently stalking a USD/CHF short on the weekly timeframe

Monthly looks bearish
Weekly also looks bearish if it closes below 3x3 DMA
Daily I would be looking to enter on a retrace up to .9145 area with target at 61.8% or .8799
Sive what do think?

Hi Josh,
My thought is as follows:
1. On monthly time frame market has accomplished 1.27 Butterfly "Buy". Although trend is bearish - I do not want to sell in this circumstances.
2. On weekly there are couple of moments. First - there could be 3-Drive Buy and market has accomplished 3d drive already.
Form the other side - there is a bearish stop grabber, that could renew prevous lows. Also bullish divergence with MACD. Although I do not rely on it too much, but taking in consideration that it appears right at monthly target - it could make big sense.

So.My thought is:
It's possible some bearish move with establishing of new lows due to stop grabber, but in general - market has strong bullish potential.
So, if you intend to enter short - your target should be near the previous lows.
 
Interesting that you mention reading since the first post, then mention Elliot Waves. Mr. Morten uses Dinapoli's technical analysis, which might resemble the waves, but in reality is much more of a simple TA, and has been explained by Mr. Morten repeatedly in posts you apparently have read. Look for Joe Dinapoli's book, not here, as requested by Mr. Morten. I promise it will be the best analysis you will ever learn. This forum offers a way to double check your application of dinapoli levels, not so much a trading plan you should follow, but a way to confirm that your analysis is correct.

Also to the person who wants different pairs: if you see something post it, and Sive or someone will reply back to you. I am currently stalking a USD/CHF short on the weekly timeframe

Monthly looks bearish
Weekly also looks bearish if it closes below 3x3 DMA
Daily I would be looking to enter on a retrace up to .9145 area with target at 61.8% or .8799
Sive what do think?

Dear Mr Morten and Joshnix,

To Mr Morten : I assume you also using pattern like Scott Carney's Harmonic Trader ?

To Joshnix: thank you for straightening me up. I must be fast skiper reader or I think EW is so deep in my head :) LOL at me. It just that when I see mr. Morten charts I (can) see EW or EW can explain it. I should also say that I've been following Mr. Morten comments from beginning. Not easy to explain things when english is not main language. Thanks again anyway. Maybe I should learn DiNapoli and shut my self up :).
 
Last edited:
Back
Top