Sive Morten
Special Consultant to the FPA
- Messages
- 18,669
Monthly
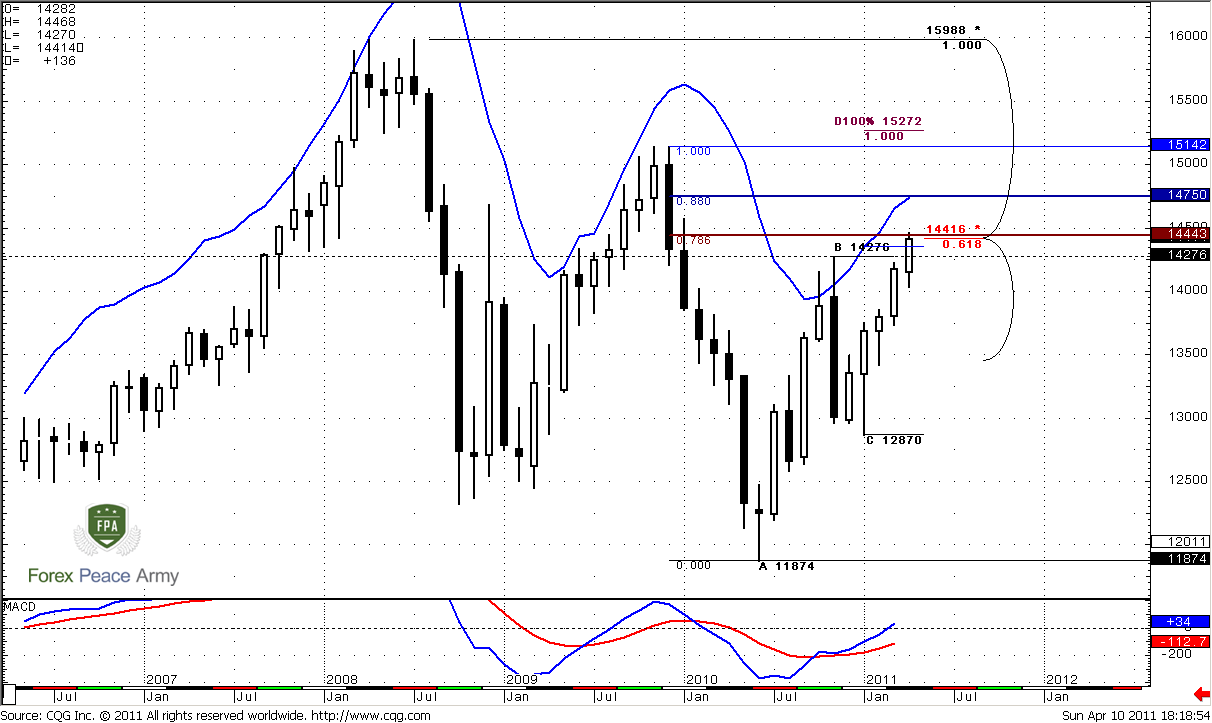
Our long-term target around 1.4350-1.44 has bit hit. We can see that as trend, as price action are strongly bullish and market is not at overbought, but 1.4420-1.4450 is an area of resistance. It includes 5/8 major Fib resistance from all time high, 0.786 Fib resistance from recent downswing. Also market has pieced 1.4354 target a bit, but we know that 50 pips on monthly chart is nothing. From that point of view I do not want to buy right now.
Although you can see that next target from our ABC pattern is 1.0 Fib extension at 1.5272 – it’s not absolutely logical, because it’s beyond monthly overbought area. I rather would like appoint as April target 1.4750 area. First, because this is monthly overbought level, second – because this is 0.88 resistance.
So, my conclusion about monthly time frame is as follows:
- Next nearest target is 1.4750;
- Although trend and price action are strongly bullish, market stands at resistance. So I prefer to see some signs that market has enough momentum and power to break it before entering long.

Weekly
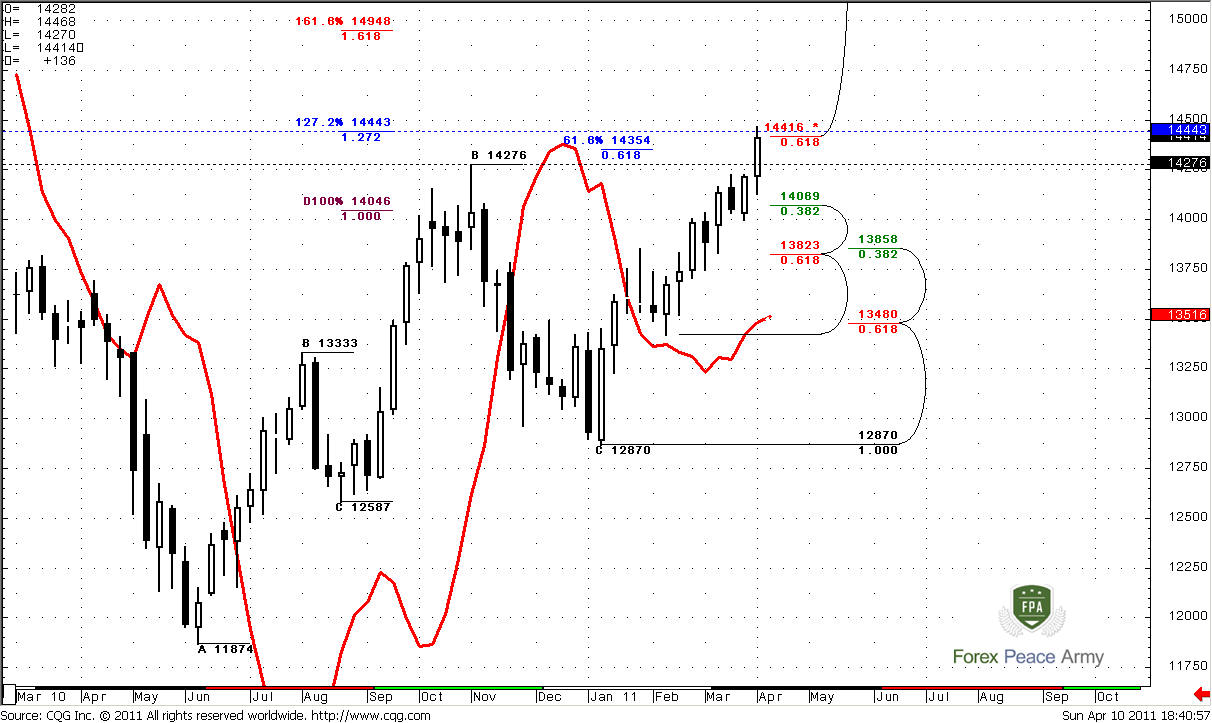
On the chart #1 we see almost the same picture as during previous week. The major difference though, is that market has hit some targets. This is 0.618 Fib extension from monthly ABC pattern and 1.27 extension from weekly AB-CD at 1.4443 right at Fib resistance 1.4416. Next target at weekly time frame is 1.618 Fib extension at 1.4950.
Trend is strongly bullish. If pullback will happen there are couple of areas to watch for:
1.4089 – nearest Fib support that could hold the market, because both trends are bullish, there is no overbought. So retracement could be shallow;
1.3823-1.3858 Weekly Confluence support.
#1

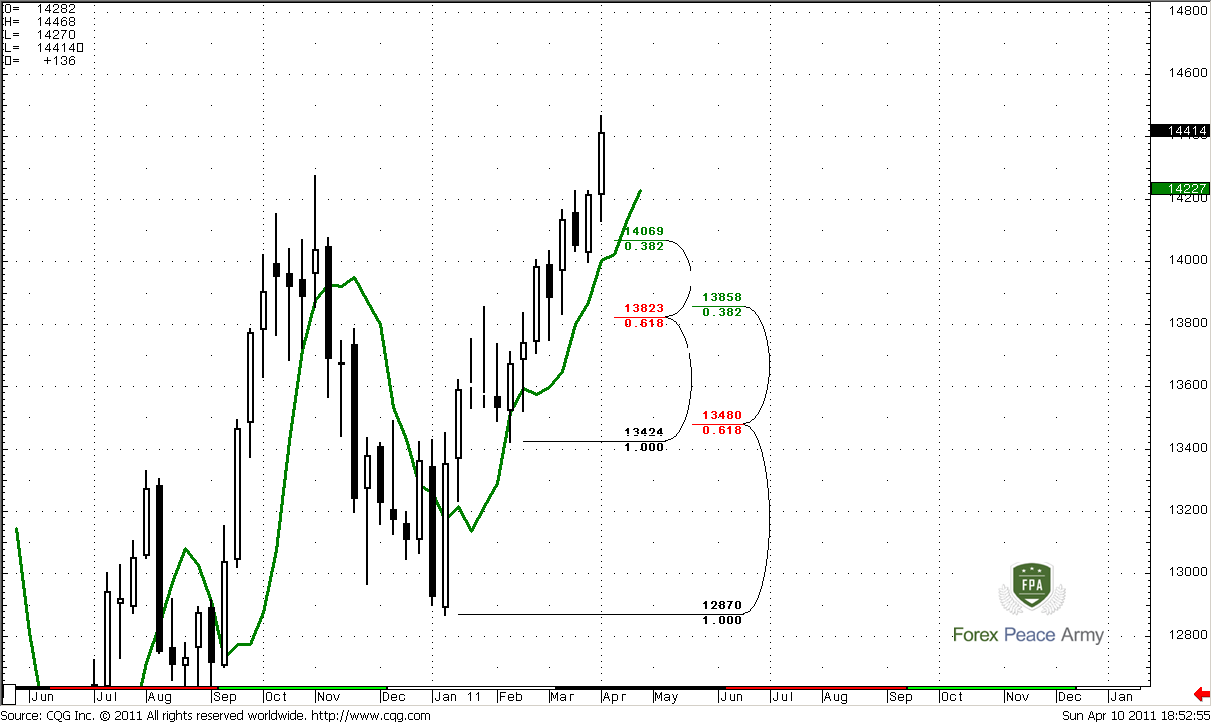
Now take a look at chart #2. We have an excellent thrust up that tells us couple important things. First, this thrust could be a context for possible directional signal – DRPO “Sell” or B&B, for instance. And such kinds of signals on weekly time frames promise solid moves. Second – it tells us, that there was no solid retracement yet – not even 3/8 during whole thrust up. Hence, there are a lot of stops very close to market. And, as we’ve said, market stands at area of resistance. So there are a lot of solid perspectives could appear on coming week.
#2

Daily
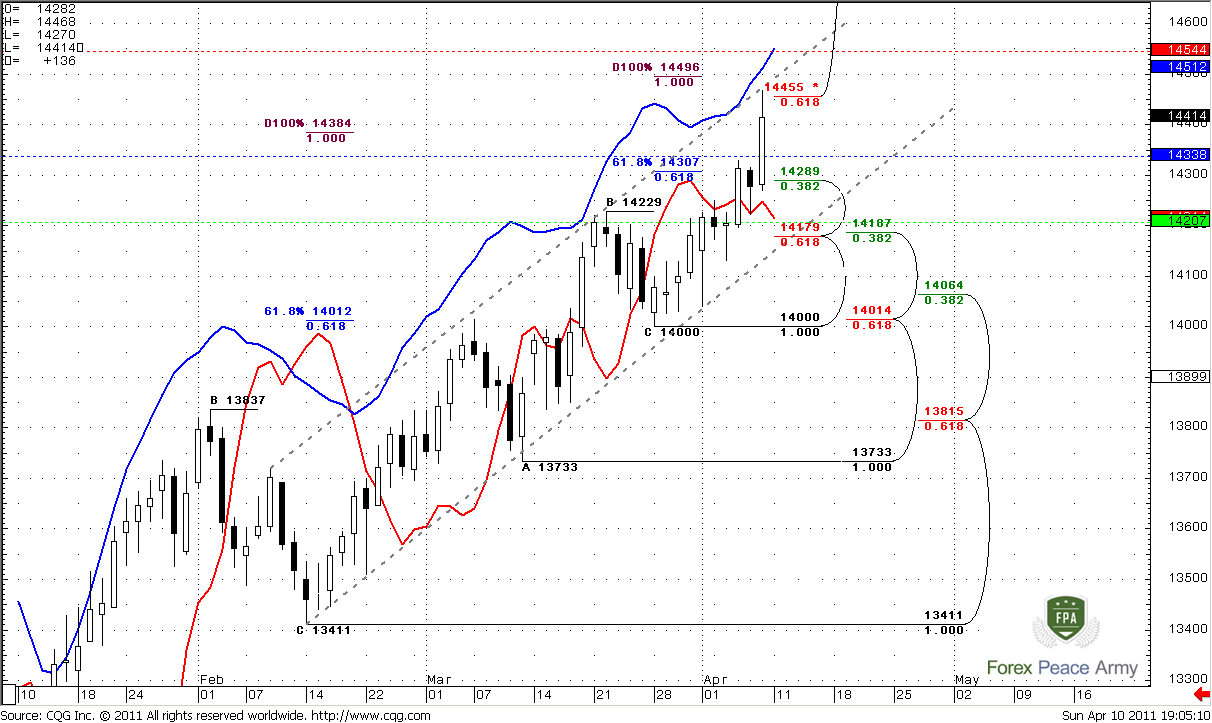
I bag your pardon, my chart is overload a bit, but this is for space saving. So, currently market shows real strength to the upside. Trend is bullish, price action is also bullish. Market has hit daily target at 1.4384 and even exceeded it a bit. Just above the market very important area – 1.45-1.4540. Not just because of psychological issue of 1.45, but also because of daily overbought at 1.4512, AB-CD target from recent pattern at 1.4496 and 1.4544 – weekly pivot resistance 1. So, I suppose that its not a time to buy into – better to wait some pullback. Beside, it could turn to weekly directional pattern…
Now about support areas… As usual, colored dash lines are pivot levels. Take a note that market rises in parallel channel. Form this perspective – it should not break down its lower border. Otherwise daily bullish bias will be under question. The lower border of the channel coincides with daily Confluence support at 1.4179-1.4187, weekly pivot support 1 at 1.4207, previous highs at 1.4229 and finally, daily trend will remain bullish only till that area. Tada! We’ve found crucial level for nearest days – this area should hold.
Also keep in mind that all trends are bullish, market is not at overbought at any time frame (here it is close to it, but still not at it). So, it should not show deep retracement if bulls are still in charge.

Intraday
Well, here I do not see any important yet, so I do not have even a chart here. Market has closed right after strong up thrust. Potentially it could lead to some directional patterns on hourly or 4-hour time frames. But there is nothing yet…
May be during Monday trading session our long-term resistance will influence somehow on price action. When and if retracement will start we will be able to estimate potential levels with more precise.
Conclusion:
Position traders:
Hold longs.
Intraday traders:
Retracement is not started yet, but market stands near strong resistance and I think that we should wait for some more clear signs of further price action. But theoretically – all trends are bullish, market not at overbought. So, retracement could be shallow. Very important level to watch is 1.4180-1.42
The technical portion of Sive's analysis owes a great deal to Joe DiNapoli's methods, and uses a number of Joe's proprietary indicators. Please note that Sive's analysis is his own view of the market and is not endorsed by Joe DiNapoli or any related companies.
Our long-term target around 1.4350-1.44 has bit hit. We can see that as trend, as price action are strongly bullish and market is not at overbought, but 1.4420-1.4450 is an area of resistance. It includes 5/8 major Fib resistance from all time high, 0.786 Fib resistance from recent downswing. Also market has pieced 1.4354 target a bit, but we know that 50 pips on monthly chart is nothing. From that point of view I do not want to buy right now.
Although you can see that next target from our ABC pattern is 1.0 Fib extension at 1.5272 – it’s not absolutely logical, because it’s beyond monthly overbought area. I rather would like appoint as April target 1.4750 area. First, because this is monthly overbought level, second – because this is 0.88 resistance.
So, my conclusion about monthly time frame is as follows:
- Next nearest target is 1.4750;
- Although trend and price action are strongly bullish, market stands at resistance. So I prefer to see some signs that market has enough momentum and power to break it before entering long.

Weekly
On the chart #1 we see almost the same picture as during previous week. The major difference though, is that market has hit some targets. This is 0.618 Fib extension from monthly ABC pattern and 1.27 extension from weekly AB-CD at 1.4443 right at Fib resistance 1.4416. Next target at weekly time frame is 1.618 Fib extension at 1.4950.
Trend is strongly bullish. If pullback will happen there are couple of areas to watch for:
1.4089 – nearest Fib support that could hold the market, because both trends are bullish, there is no overbought. So retracement could be shallow;
1.3823-1.3858 Weekly Confluence support.
#1

Now take a look at chart #2. We have an excellent thrust up that tells us couple important things. First, this thrust could be a context for possible directional signal – DRPO “Sell” or B&B, for instance. And such kinds of signals on weekly time frames promise solid moves. Second – it tells us, that there was no solid retracement yet – not even 3/8 during whole thrust up. Hence, there are a lot of stops very close to market. And, as we’ve said, market stands at area of resistance. So there are a lot of solid perspectives could appear on coming week.
#2

Daily
I bag your pardon, my chart is overload a bit, but this is for space saving. So, currently market shows real strength to the upside. Trend is bullish, price action is also bullish. Market has hit daily target at 1.4384 and even exceeded it a bit. Just above the market very important area – 1.45-1.4540. Not just because of psychological issue of 1.45, but also because of daily overbought at 1.4512, AB-CD target from recent pattern at 1.4496 and 1.4544 – weekly pivot resistance 1. So, I suppose that its not a time to buy into – better to wait some pullback. Beside, it could turn to weekly directional pattern…
Now about support areas… As usual, colored dash lines are pivot levels. Take a note that market rises in parallel channel. Form this perspective – it should not break down its lower border. Otherwise daily bullish bias will be under question. The lower border of the channel coincides with daily Confluence support at 1.4179-1.4187, weekly pivot support 1 at 1.4207, previous highs at 1.4229 and finally, daily trend will remain bullish only till that area. Tada! We’ve found crucial level for nearest days – this area should hold.
Also keep in mind that all trends are bullish, market is not at overbought at any time frame (here it is close to it, but still not at it). So, it should not show deep retracement if bulls are still in charge.

Intraday
Well, here I do not see any important yet, so I do not have even a chart here. Market has closed right after strong up thrust. Potentially it could lead to some directional patterns on hourly or 4-hour time frames. But there is nothing yet…
May be during Monday trading session our long-term resistance will influence somehow on price action. When and if retracement will start we will be able to estimate potential levels with more precise.
Conclusion:
Position traders:
Hold longs.
Intraday traders:
Retracement is not started yet, but market stands near strong resistance and I think that we should wait for some more clear signs of further price action. But theoretically – all trends are bullish, market not at overbought. So, retracement could be shallow. Very important level to watch is 1.4180-1.42
The technical portion of Sive's analysis owes a great deal to Joe DiNapoli's methods, and uses a number of Joe's proprietary indicators. Please note that Sive's analysis is his own view of the market and is not endorsed by Joe DiNapoli or any related companies.