FOREX PRO Weekly April 11-15, 2011

Hi, Mjunkyard,
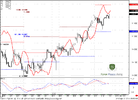
Generally because most forumers hardly will be able to trade it in time. Sometimes we discuss the possibility of trading retracement, but if it happens on hourly or 4-hour chart, and if it somewhere near the start point.
Unfortunately we can't trade any retracement blindly, just because pivot stands below current market - we need initial signs that it has started...
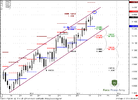
But today market was near 100% retracement target already...
Dear Sive;
Thank you so much for your response!
I guess that my question is as following. I saw the Eur reaching 1.4512 and i remembered from your analysis that it's the overbought level. And then i saw the retracement starting, so i sold. My problem was that i didn't know how to calculate the target.
So the question is how to calculate the target in a retracement.
(since i didn't know how i took 50 pips, which is not bad, but it wasn't professional.)
thanks again for all your guidance and teaching.
sincerely
mjunkyard

Oh, I see.
Well, there are three basic approaches:
1. If you have Osc Predictor and you've sold at some reason at overbought -the target could be, when market will reach the middle area between the bands of oscillator. Or when DOSC=0 -that is the same;
2. Or, you can calculate intraday target with ABC pattern.
3. If somewhere below your entry point strong support area - you also could use it as a target.
 
EUR/USD Daily Update, Wed 13, April 2011

Good morning,
market has shown nice upside price action yesterday. All trends are bullish (monthly, weekly daily), market is neither oversold nor overbought, So we do not have any barriers to go up futher except just one.

On daily time frame market has hit 100% extension target at 1.4496. Normal price action suggests that market could show some retracement down, but this is not a rule of thumb - sometimes it not happens.
If we will take a look at recent price action - we can see that market develops in upside channel for 2+ months. And from that perspective, I think that market could hit 1.4540-1.4550 area before retracement. 1.4540-1.4550 - weekly pivot resistance an upper border of the channel. Besides, 1.45 is a psychological also, so market-makers could trigger public to starting enter Long, when they pierce 1.45 to upside - then it could turn to W&R and they will grab public's stops...

This assumption partially confirmed by intraday charts:
On 4-hour and hourly charts trends are bearish, also you can see MACD divergence on 4-hour chart, but price action does not support that.
Be aware of upper breakout to 1.4540-1.4550. Also here you can see couple of hourly AB-CD targets.
So, my thoughts are:
We should not think about entering short before market will hit 1.4540-1.4550. And then sit on our hands and watch for bearish signals. If they will not come - then we will search for possiblity to enter long. But now- be careful, market makers like to play with public, around such levels as 1.45, showing failing breakouts...
 

Attachments

  • EUR_D_13_04_11.PNG
    EUR_D_13_04_11.PNG
    43.6 KB · Views: 143
  • EUR_4H_13_04_11.PNG
    EUR_4H_13_04_11.PNG
    44.3 KB · Views: 139
  • EUR_1H_13_04_11.PNG
    EUR_1H_13_04_11.PNG
    44.8 KB · Views: 141
1.45 Eur/usd

Dear Sive

Thanks for the analysis.

I know that you trade futures and we trade spots and hence our charts are different.

You mentioned that 1.45 is psychological barrier, but in the spot market this was broken yesterday.. so should we account for that fact anymore or should we move on to the next stop which could be 1.46? How do we take this important point that you mentioned into consideration.

Look forward to hearing from you.

Thanks
Mili

Hi, Mili
1.45 is not just "1.45" pips to pips, it's an area rather.
The point is that market makers could show failure breakout, and when public will move in, - they will try to grab public's stops. This is very probable in current environment.
So, I think that market should hit 1.4550 area - and then we'll see...
 
Future vs Spot

Good morning Sive,

Thank you first again for your wonderful analysis,
I sincerely hope you have no plans of leaving here soon ..

I have a short question for you:

It seems to me that the difference between Future and Spot prices is about 20 pips (could be 19 or 18 too),
I was wondering is this is a constant or not?

It would make it easier to trade; for example if you say that there is a resistance at 1.4544 - I could just go and say: Oh, thats 1.4564 on my MT4
without having to consult my charts to look up the difference using highs and lows.

Is the difference always 20 pips?

(please excuse me from asking if you have explained this somewhere already,
but I would like to hear it from you personally :))

With Kind Regards,

Adam Wyn-Roberts
 
Di Napoli pack

There is this Di Naploli pack that is available in their CIS website for $195. It has Oscillator predictor, detrended oscillator, MACD. Stochastic and the displaced moving averages. They come in trade station ELS format. Are the Di Napoli levels, confluences and agreements already built into these? I trade using Dukascopy jforex platform. Will it be compatible? Again what other benefits do you gain by using CQG and what is the cost? I am sorry to bother you really.
Oh, I see.
Well, there are three basic approaches:
1. If you have Osc Predictor and you've sold at some reason at overbought -the target could be, when market will reach the middle area between the bands of oscillator. Or when DOSC=0 -that is the same;
2. Or, you can calculate intraday target with ABC pattern.
3. If somewhere below your entry point strong support area - you also could use it as a target.
 
Good morning Sive,

Thank you first again for your wonderful analysis,
I sincerely hope you have no plans of leaving here soon ..

I have a short question for you:

It seems to me that the difference between Future and Spot prices is about 20 pips (could be 19 or 18 too),
I was wondering is this is a constant or not?

It would make it easier to trade; for example if you say that there is a resistance at 1.4544 - I could just go and say: Oh, thats 1.4564 on my MT4
without having to consult my charts to look up the difference using highs and lows.

Is the difference always 20 pips?

(please excuse me from asking if you have explained this somewhere already,
but I would like to hear it from you personally :))

With Kind Regards,

Adam Wyn-Roberts

Hi Adam,
yes, currently it's about 20 pips, but it is not constant. The difference depends on interest rates difference (ECB and FED) and time to expiration of futures contract. The lesser time till expiration - the lesser difference.
The better way for you is to apply the same tools that I do to the same highs and lows but on your chart. In that way - you will always get right numbers.


There is this Di Naploli pack that is available in their CIS website for $195. It has Oscillator predictor, detrended oscillator, MACD. Stochastic and the displaced moving averages. They come in trade station ELS format. Are the Di Napoli levels, confluences and agreements already built into these? I trade using Dukascopy jforex platform. Will it be compatible? Again what other benefits do you gain by using CQG and what is the cost? I am sorry to bother you really.

CQG is very expensive. IT makes sense to use it when your assets 100K+.
Per month it will cost about 800-1000$. If you will use only spot Forex+DiNapoli full pack.
DiNapoli uses CQG...

Concerning CIS - I do not know exactly, but looks like you'll get for 195 indicators pack only;
it's better to read about it on Napoli web site. There should be an explanation.
AS I know CIS is just a module, a tool - you need to upload price data somehow from MT4 into trade station or CIS itself if it allows to do that.
 
Jyotiprakash Pal,
At what price did you enter the market and what was the basis (trigger)
In your chart, there is the pink pattern to the right and the white patterns to the left, what fib level (reaction numbers) do they represent?
There is also the words "search pattern" at the top left corner of the chart, is it a software you instal? if so how does it work? What do you mean by moving your stop loss to green?[/B]
Briliant analysis once again sir ! market straight jump from 161.8! :D now moving my stoploss too green and watching .. as u advised ! Hats off!
 
dukascopy

There is this Di Naploli pack that is available in their CIS website for $195. It has Oscillator predictor, detrended oscillator, MACD. Stochastic and the displaced moving averages. They come in trade station ELS format. Are the Di Napoli levels, confluences and agreements already built into these? I trade using Dukascopy jforex platform. Will it be compatible? Again what other benefits do you gain by using CQG and what is the cost? I am sorry to bother you really.

hello ayoayo! I have the same problem but seems you are ahead. I do not have an account at Dukascopy yet. if you find the answer to your question please do not keep it just for yourself.
 
Back
Top