Sive Morten
Special Consultant to the FPA
- Messages
- 18,651
FUNDAMENTALS
Recent headlines and comments in media mostly suppose that week was boring. Data was mostly in a row with expectation, bringing nothing interesting and enforces markets to stay on the same expectations - Fed's 25 points change in May and pause. But, by FPA view - it is not boring, once you take a view on inflation in complex. We still think that there were few very reasonable comments but they were not announced enough in media. This is actually the key to what we could get as from the Fed as from the US economy in nearest few months.
MARKET OVERVIEW
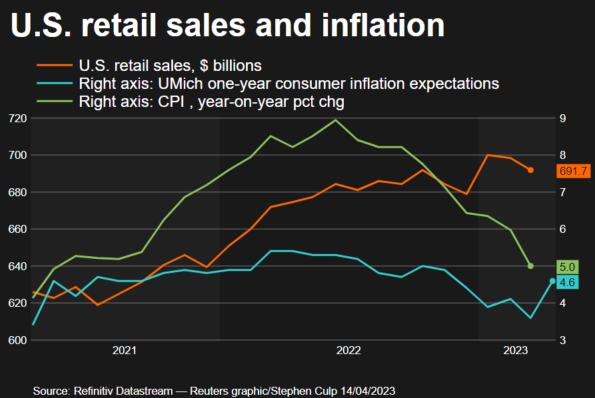
The dollar index bounced off a one-year low against a basket of currencies on Friday after some March retail sales components were not as weak as some economists had feared, while a key Federal Reserve official warned that the U.S. central bank needs to continue hiking interest rates to bring down inflation. Core retail sales, which correspond most closely with the consumer spending component of gross domestic product, slipped 0.3% last month. However, despite March's fall, the gains in January and February put consumer spending firmly on track to accelerate in the first quarter.
Other data on Friday showed U.S. consumer sentiment inched up in April, but households expected inflation to rise over the next 12 months. Production at U.S. factories also fell more than expected in March, but eked out a modest gain in the first quarter.
Fed Governor Christopher Waller said on Friday that despite a year of aggressive rate increases, U.S. central bankers "haven't made much progress" in returning inflation to their 2% target and need to move rates higher still.
Atlanta Fed President Raphael Bostic, meanwhile, said one more quarter-percentage-point interest rate hike can allow the Fed to end its tightening cycle with some confidence that inflation will steadily return to its 2% target.
Chicago Fed President Austan Goolsbee also said that a U.S. recession is certainly feasible as the Fed's steep rate-hikes over the past year filters fully through the economy.
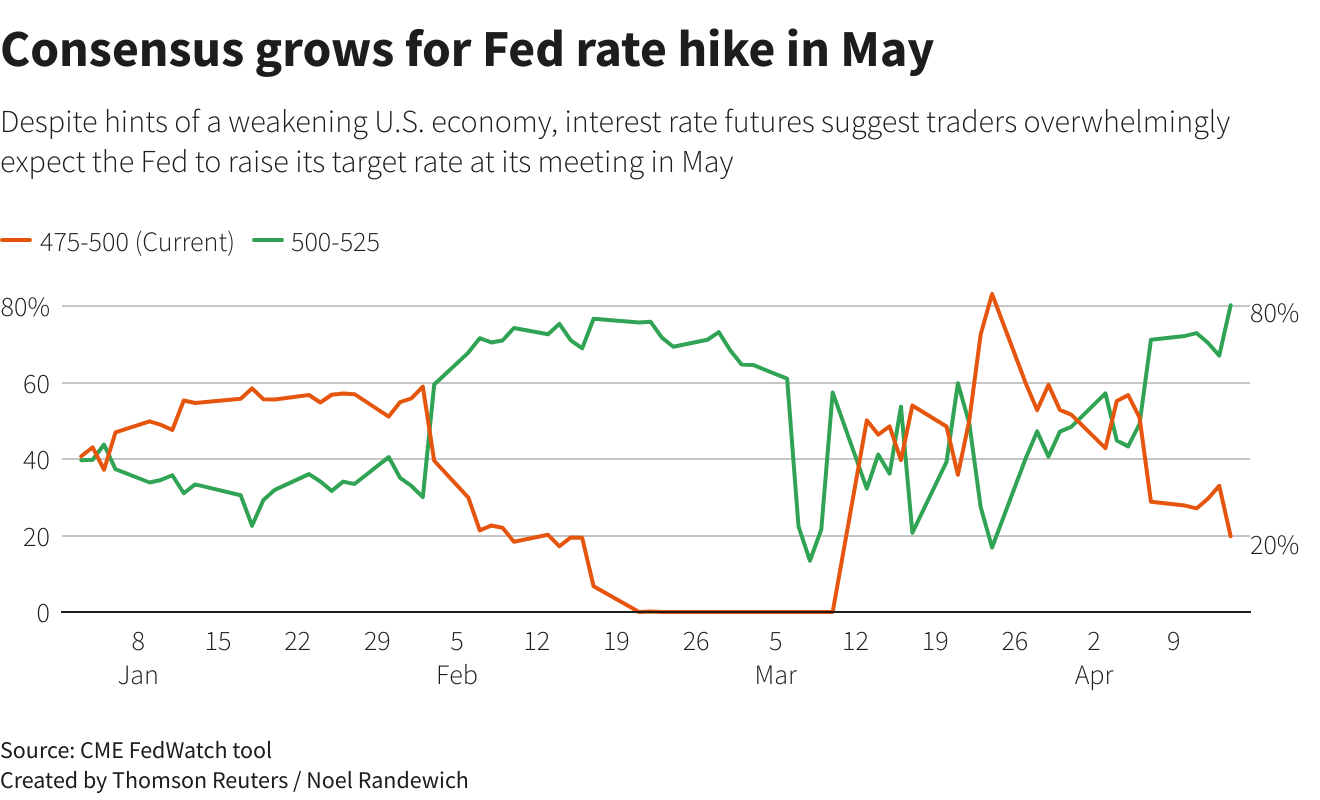
Fed funds futures traders are pricing in an 81% probability that the Fed will hike by an additional 25 basis points at its May 2-3 meeting.
Inflation, as measured by the Fed's preferred gauge, remains more than double the U.S. central bank's 2% target, and for now policymakers seem agreed that another rate increase at their May 2-3 meeting is warranted. But the potential for a worse-than-expected credit crunch remains elevated in the wake of the Silicon Valley Bank and Signature Bank collapses last month, which raised concerns of a larger financial panic.
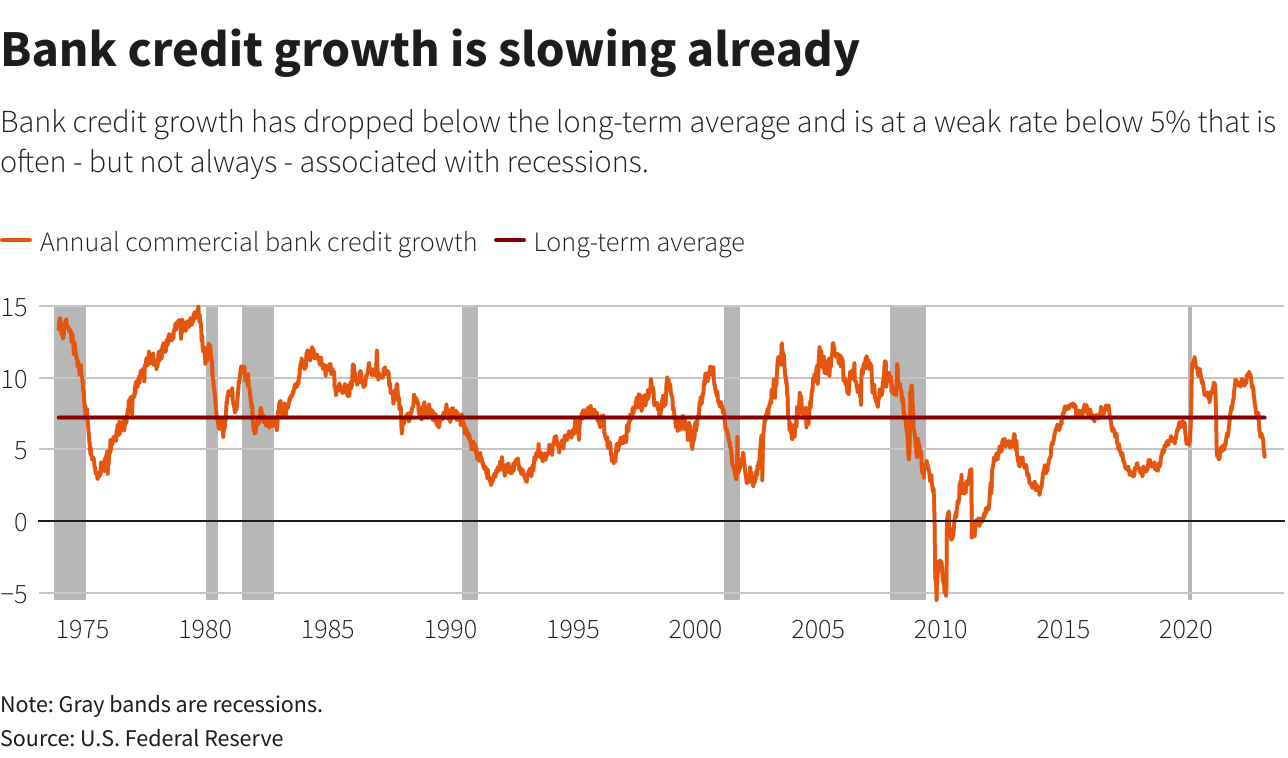
Results for the last quarter of 2022 showed a net share of around 45% of banks were tightening standards for commercial and industrial loans, the survey question seen as the best barometer for the direction of lending. Up sharply in the last three surveys, that is already near levels associated with recession. Tighter credit is hitting an already-slowing economy, with key sectors showing stress.
Small businesses are already reporting tightened profit margins, a recent Bank of America study found. With their reliance on bank loans, lines of credit and credit cards, tougher financing conditions may land particularly hard on that segment of the economy, a key source of employment.
Americans said last month that access to credit was at its toughest level in nearly a decade, as they also braced for higher levels of inflation over the next few years, a report from the New York Fed said Monday.
Meanwhile, households project that inflation a year from now would stand at 4.7%, versus February’s 4.2%. That was the first increase in year-ahead expected inflation since October. Inflation three years from now is seen at 2.8%, from 2.7% the prior month, while five years out, survey respondents said they expected inflation at 2.5%, down from the prior month’s 2.6%. The rise in inflation expectations could prove to be a new challenge for the Federal Reserve’s effort to lower inflation.
The U.S. economy is at risk of shrinking in the second quarter, BofA Global Research wrote in a client note, following recent economic data that hinted that the Federal Reserve's aggressive interest rate hikes were cooling the economy. BofA pointed to data from April 3 showing U.S. manufacturing activity slumped in March to the lowest level in nearly three years as new orders plunged.
Warren Buffett said people should not be panicked about the banking industry or the safety of U.S. bank deposits, despite the recent failures of Silicon Valley Bank and Signature Bank. The billionaire chairman of Berkshire Hathaway Inc said that while more banks "will go bust," the industry's recent problems do not resemble those that helped trigger the 2008 global financial crisis.
Mr. W. Buffet probably has some cognitive dissonance, as he sold a bulk of his banking portfolio in February - The Berkshire chief said he sold certain bank stocks after seeing signs of trouble in their earnings. Buffett's company has pared or fully disposed of numerous financial stocks in recent years, including JPMorgan, Goldman Sachs, Wells Fargo, PNC Financial, US Bancorp, and BNY Mellon. The investor emphasized that he didn't see problems at all of them. And now he tells that everything is OK, no problems. We could only reply on it - "physician, heal thyself".
Economists at Goldman Sachs no longer expect the U.S. Federal Reserve to raise interest rates in June, according to a research note published on Wednesday following data that showed consumer prices cooled faster than expected in March.Goldman Sachs had previously expected consecutive rate hikes at the Fed's May and June meetings. Economists led by Jan Hatzius said in the research note they still expect a rate hike in May.
One more quarter-percentage-point interest rate hike can allow the Federal Reserve to end its tightening cycle with some confidence inflation will steadily return to the U.S. central bank's 2% target, Atlanta Fed President Raphael Bostic said. Recent inflation data, including this week's reports of slowing consumer price increases and falling producer price inflation, "are consistent with us moving one more time," Bostic told Reuters in an interview on Thursday. "We've got a lot of momentum suggesting that we're on the path to 2%."
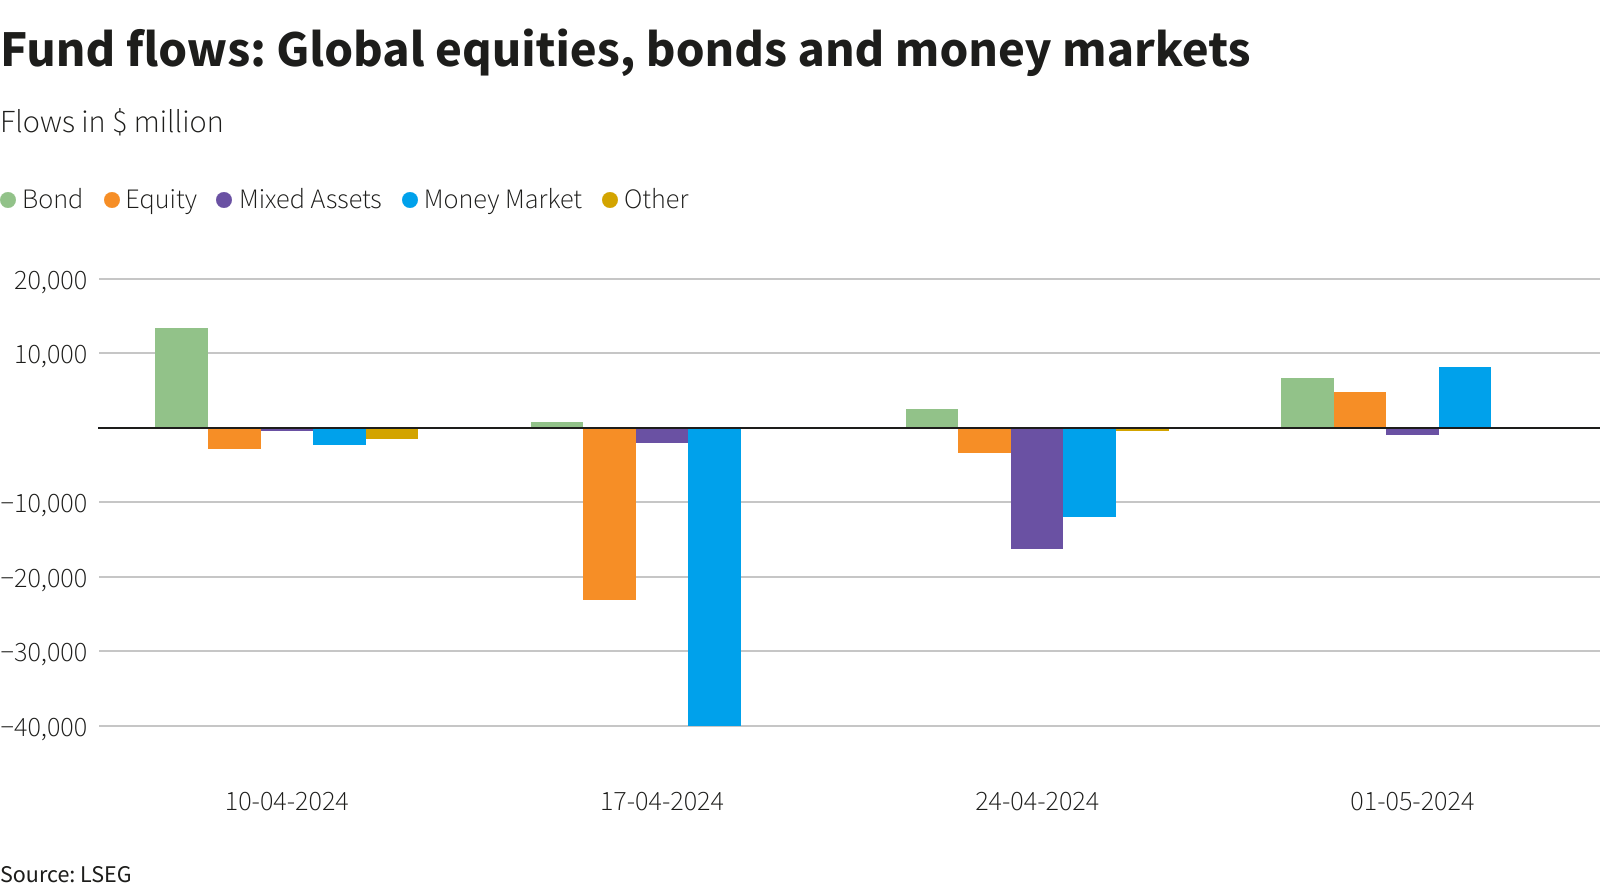
Funds in the global money market drew a net $40.83 billion worth of inflows compared with a net $61.12 billion worth of purchases in the previous week, data from Refinitiv Lipper showed. Money market funds continue "to benefit from high U.S. real rates that forces deposits out of the banking system," brokerage Jefferies said in a note to clients.
Investors have moved $538 billion into cash funds over the past eight weeks as they pulled money out of bank deposits after the collapse of Silicon Valley Bank, according to Bank of America figures released on Friday. BofA, citing EPFR data, said investors put $51.6 billion into money market funds in the week to Wednesday as the outsized flows continued.
BofA said $65 billion has flowed into Treasury funds this year, in the best start to a year ever recorded. It said $2.3 billion flowed into bonds in the week to Wednesday, in a third straight week of inflows.
LET'S GET TO THE BOTTOM OF THIS STUFF
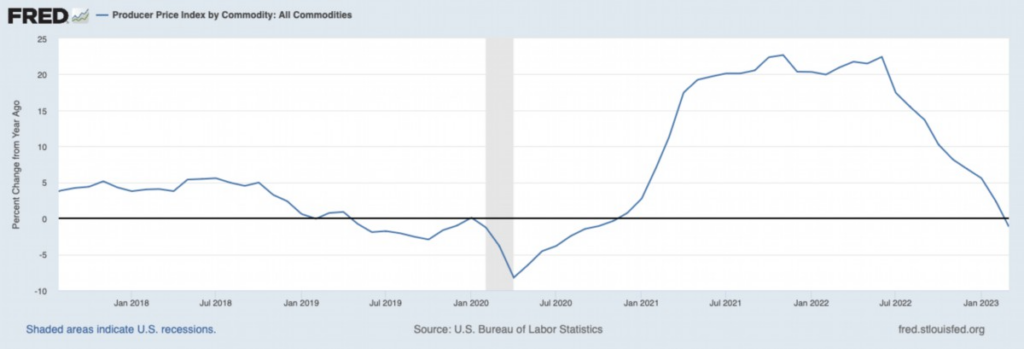
Indeed, whatever tells anybody - we see deflationary processes and it is stupid to deny it. Our favorite PPI all commodities index drops even faster than common CPI:
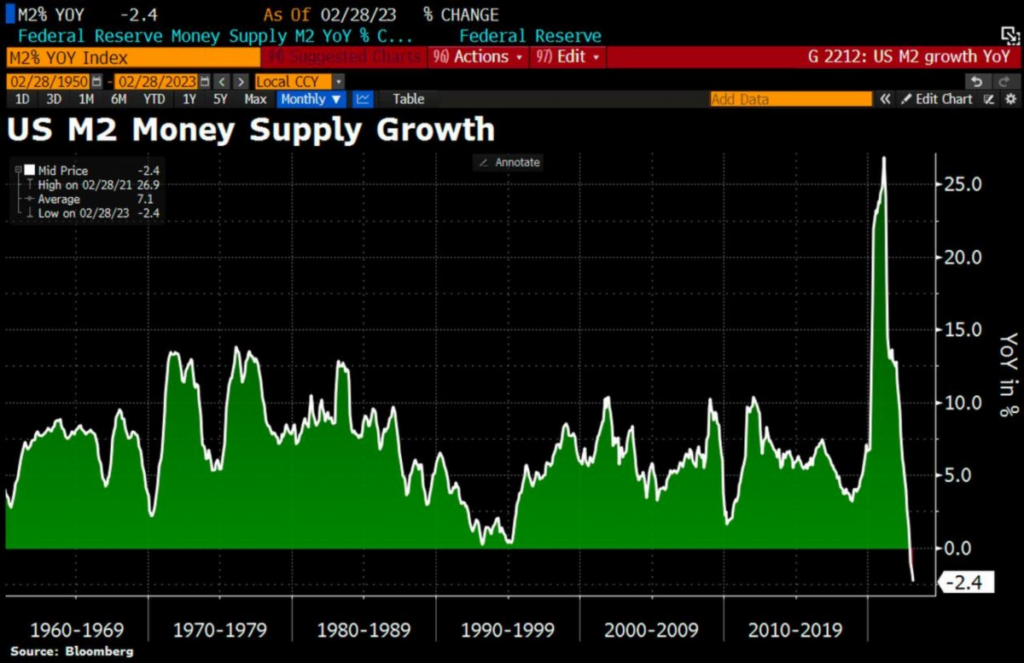
Meantime, CPI is slowing down but - Core CPI stands stubbornly high and around the same 5% levels. Experience has shown, raising the rate and other ways of tightening monetary policy (the Fed was very actively reducing the money supply due to the sale of securities on the balance sheet) gave a result, but not quite what was expected.
Actually, many experts say this, for example, JPMorgan CEO Jamie Dimon: "People should be prepared for higher rates for a longer period." But raising rates (or maintaining the current ones) in a declining economy will only accelerate the recession. But the same we hear from Fed representatives, such as Waller, Goolsby, who said that "moderate recession possible". Previously we already quoted BlackRock. As a result - market expectations of Fed rate have changed - added another 25bp increase on June 14th.
But to understand why inflation is dropping - either because of monetary policy and M2 supply cut or because of degradation in production and manufacturing sector? You need just to take a look at some charts. Last week we've shown you drop in production across the Globe. Now take a look at Retail Sales and everything becomes clear. For some case I put here few another important indicators - Semiconductor global sales and China inflation level. Take a look - both shows significant drop, which clearly indicates slowdown in a whole global economy.

But here we're also interested in sudden jump of 1-year inflationary expectations (actually they have jumped not only for 1 year horizon). What now Fed is going to do? All time while Fed was rising rate the forward inflation rates were falling. Here we need to make a comment. How is it that industrial inflation turns into deflation, consumer inflation somehow falls, and people expect prices to rise? First is - it means the lack of trust into regulators authorities, such as Fed and US Treasury. When the yield of "short" securities is greater than "long" ones, and for a long time, we can safely say that the market is in a very unstable state. Previously, this was generally a very convincing sign of a recession, but now, when the whole system is in the "red" zone, it is not necessary to talk about any stable indicators. Inevitably, investors start to get nervous, which does not add stability.
Second, is purely economical explanation. As companies reduce prices against the background of falling demand, their debt grows. As well as constant expenses go nowhere. These expenses are re-distributed over less amount of goods, which leads to price rising. That's why only monetary tools are not working. Finally, if company comes to bankruptcies and/or closure of production - other producers raise prices. This is no longer a market economy, it is an economy in falling markets, a completely different logic works.
Thus, while banking sector has reported well (at least WF, Citi and JPM) and feels good, we can't say the same about households. As we've mentioned above - consumer loans conditions are becoming stricter, expenses rising. Spending in real prices are stagnating. In general Retail Sector signals on a big problems.

Based on this short piece of data we could conclude two things - inflation is dropping due real sector slowdown, but not because of the Fed efforts. Second is - long term inflationary expectations are rising, which puts under question early and stable inflation decreasing, especially core numbers. Inflation now mostly stands high due to service sector - all "handmade" which is mostly concentrated in service sector is expensive.
So, the rope around the Fed's neck is getting tighter. In an economy caught in a debt refinancing loop, if asset prices do not rise, tax revenues tend to stagnate. The budget deficit is increasing - In the first 3 months of 2023, the deficit reached $679 billion. A 134% jump compared to the first quarter of 2022 ($291 billion).
The latest data from the tax Service (IRS) confirms that the average level of receipts has decreased by about 10% compared to last year. The US on their way to a $2 trillion hole in the budget. The Fed, in the official protocol, confirmed the approach of a "weak recession". Daly and other Fed speakers are becoming more dovish, but core inflation is steady and rising, which will force another rate hike in May and more probable in June. This in turn means that overall financial conditions once again will become tighter. The question is what the margin of safety on this tighteness?
Steve Hanks in his video convincingly proves that inflation in the United States should fall to 2-5% and stay there for a long time. What is important is that economic growth will continue. We would completely agree with this point of view if we were talking about the period before 2008 - everything would have been like that, as Steve says. Then, let me remind you, the world economy had not yet reached the limit of productivity and any monetary stimulus fell on fertile ground - freshly printed money was always willing to produce and supply additional goods and services. But since 2008, everything has changed - the performance limit, in all likelihood, has been reached and the system no longer works like that.
A few words about the performance limit. To find it, you need to analyze the global GDP (because the economy is global, the data on individual states have long been indicative). According to the IMF, GDP in 2008 amounted to $63.75 trillion. which is $86.7 trillion at current prices. (yes, yes, my little friends, the cumulative inflation was 36%, and this is still understated official data). In 2022, global GDP was $100.2 trillion. , real growth 15.5%.
The population during the same period (from 2008 to 2022) grew from 6.789 billion to 8.0 billion people. i.e. 18%.
In other words, the real created GDP per capita in the world fell by 2% : from $12,771 to $12,525. Of course, it behaved differently in individual countries, but this is already a matter of redistribution and not production. Therefore, development is stalling globally, and the global crisis and all sorts of other outrages.
In relation to the discussed problem of inflation in the United States, this means the following:
1) it is very impossible to increase the physical volume (Q), especially since 80% of the US GDP consists of services, and services are concentrated around goods - in order to wind up services on them (trade margin, logistics, financial, information, insurance services, etc. .) they must physically be there. And China and India, which supply these goods for the most part, firstly, cannot greatly increase supplies, and secondly, they no longer want to, especially China.
2) accordingly, any movement around the money supply mainly affects prices. From the equation MV = PQ, an increase in the money supply (M2) without an increase in Q obviously leads to an increase in P, that is, inflation. With the reduction of M2, it is a little more difficult, but if the reduction of M2 occurs due to worsening lending conditions as it is now (that is, the M2 / MO multiplier is decreasing), then this just leads to a drop in Q, (the collapse of the services market, first of all), and not to a decrease in P .
3) so -
There are two reasons.
The first reason is that inflation will accelerate one way or another, because with the transformation of the global financial system and the change of the economic leader, it has always been so - in the 1880s-1890s, in the 1970s. And now we are also fragmenting world trade and the energy market and God knows what else. In this situation, the money supply squeeze and rate manipulation mainly affect economic growth, but not prices. Prices stop rising when there is an excess of goods and/or the involvement of hitherto unoccupied new labor resources in the economy outstrips the emission. And this is nowhere to be found now.
The second reason is that previously, with a single "dollar-centric" capital market, all the others somehow played in favor of the main reserve currency and this allowed even with a relatively small issue to have a huge internal debt and low inflation. Now there are at least two centers: one in the USA and the other in Eurasia, and competition has already begun slowly for capital. EU, Russia and Iran are banned and doomed to mutual partnership but the rest of the players can still choose. And now it is clear that the world will be divided roughly in half, (and not at current exchange rates) and, accordingly, the US will have to share part of the global emission income. which is also a pro-inflationary factor.
Thus, 5-5.6% for the dollar is most likely a local minimum. It can go lower, but at the cost of a deep economic downturn, which apparently they will not go to, because they are more expensive for themselves. Therefore, the way of inflation upward is by 11-12%, and then again at the moment down by 8-9%. The only question is the speed of movement, but it depends on purely political events: whether the BRICS currency will be introduced, how fast the yuanization, roublatization and rupiization will go in Eurasia. It seems that it could take a year or two. That is, a new peak of inflation is somewhere by October-November, and a new local minimum is by February-March next year.
Speaking on short-term tactical issues - we're closely watching on US Treasury cash balance. The US Treasury increased spending from its accounts at the Fed and spent another $54.1 billion in a week, Yellen had only $86.6 billion left in the accounts at the Fed on April 12, in 4 weeks $191 billion of fresh dollars from the US budget fell into the financial system. This does not mean, of course, that Madame has run out of resources: there is still an opportunity to borrow about $300 billion ("emergency measures") and the expected April taxes. We wait for how long...
Trust in banks has not been restored and some market participants prefer to place money not in banks. In this part, the most interesting thing in the next two weeks - how much Yellen will be able to collect taxes – this may create tension with the liquidity of some banks, given the ongoing outflow of funds to MMF.
Meantime, ECB considers more aggressive tactic with interest rate. Decreasing worries about the state of the financial system means that interest rates could rise by half a percentage point when the European Central Bank meets next month, Governing Council member Bostjan Vasle said.

Recent headlines and comments in media mostly suppose that week was boring. Data was mostly in a row with expectation, bringing nothing interesting and enforces markets to stay on the same expectations - Fed's 25 points change in May and pause. But, by FPA view - it is not boring, once you take a view on inflation in complex. We still think that there were few very reasonable comments but they were not announced enough in media. This is actually the key to what we could get as from the Fed as from the US economy in nearest few months.
MARKET OVERVIEW
The dollar index bounced off a one-year low against a basket of currencies on Friday after some March retail sales components were not as weak as some economists had feared, while a key Federal Reserve official warned that the U.S. central bank needs to continue hiking interest rates to bring down inflation. Core retail sales, which correspond most closely with the consumer spending component of gross domestic product, slipped 0.3% last month. However, despite March's fall, the gains in January and February put consumer spending firmly on track to accelerate in the first quarter.
"Personal consumption flattened out in February and March, but this followed a huge jump in spending momentum in January," Jefferies money market economist Thomas Simons said in a note. "The bottom line is that the weakness in February and March looks distressing in isolation, but the quarterly averages are much stronger due to the spending spree in January."
Other data on Friday showed U.S. consumer sentiment inched up in April, but households expected inflation to rise over the next 12 months. Production at U.S. factories also fell more than expected in March, but eked out a modest gain in the first quarter.
Fed Governor Christopher Waller said on Friday that despite a year of aggressive rate increases, U.S. central bankers "haven't made much progress" in returning inflation to their 2% target and need to move rates higher still.
Atlanta Fed President Raphael Bostic, meanwhile, said one more quarter-percentage-point interest rate hike can allow the Fed to end its tightening cycle with some confidence that inflation will steadily return to its 2% target.
Chicago Fed President Austan Goolsbee also said that a U.S. recession is certainly feasible as the Fed's steep rate-hikes over the past year filters fully through the economy.
Fed funds futures traders are pricing in an 81% probability that the Fed will hike by an additional 25 basis points at its May 2-3 meeting.
Inflation, as measured by the Fed's preferred gauge, remains more than double the U.S. central bank's 2% target, and for now policymakers seem agreed that another rate increase at their May 2-3 meeting is warranted. But the potential for a worse-than-expected credit crunch remains elevated in the wake of the Silicon Valley Bank and Signature Bank collapses last month, which raised concerns of a larger financial panic.
Results for the last quarter of 2022 showed a net share of around 45% of banks were tightening standards for commercial and industrial loans, the survey question seen as the best barometer for the direction of lending. Up sharply in the last three surveys, that is already near levels associated with recession. Tighter credit is hitting an already-slowing economy, with key sectors showing stress.
Small businesses are already reporting tightened profit margins, a recent Bank of America study found. With their reliance on bank loans, lines of credit and credit cards, tougher financing conditions may land particularly hard on that segment of the economy, a key source of employment.
Americans said last month that access to credit was at its toughest level in nearly a decade, as they also braced for higher levels of inflation over the next few years, a report from the New York Fed said Monday.
In the March Survey of Consumer Expectations, the bank found that the share of households who said credit is harder to get versus a year ago rose to the highest level in a survey that dates back to 2014. The bank’s report also said, “respondents were more pessimistic about future credit availability as well, with the share of households expecting it will be harder to obtain credit a year from now also rising.”
Meanwhile, households project that inflation a year from now would stand at 4.7%, versus February’s 4.2%. That was the first increase in year-ahead expected inflation since October. Inflation three years from now is seen at 2.8%, from 2.7% the prior month, while five years out, survey respondents said they expected inflation at 2.5%, down from the prior month’s 2.6%. The rise in inflation expectations could prove to be a new challenge for the Federal Reserve’s effort to lower inflation.
The U.S. economy is at risk of shrinking in the second quarter, BofA Global Research wrote in a client note, following recent economic data that hinted that the Federal Reserve's aggressive interest rate hikes were cooling the economy. BofA pointed to data from April 3 showing U.S. manufacturing activity slumped in March to the lowest level in nearly three years as new orders plunged.
"This week's data flow is consistent with our view that the U.S. economy slowed steadily over the course of 1Q 2023," BofA economists wrote in a note dated Friday and emailed Monday. "As a result, the hand-off to 2Q looks weak. We see meaningful risks of a contraction in GDP in 2Q."
Warren Buffett said people should not be panicked about the banking industry or the safety of U.S. bank deposits, despite the recent failures of Silicon Valley Bank and Signature Bank. The billionaire chairman of Berkshire Hathaway Inc said that while more banks "will go bust," the industry's recent problems do not resemble those that helped trigger the 2008 global financial crisis.
"People shouldn't be worried about losing their money and their deposits they have in an American bank, but the message has gotten very confused," Buffett, 92, said on CNBC. You don't need to turn a dumb decision by managers into panicking the whole citizenry of the United States about something they don't need to be panicked about," he added. Buffett also said he would bet $1 million that no American depositor would lose money from a bank failure in the next year.
Mr. W. Buffet probably has some cognitive dissonance, as he sold a bulk of his banking portfolio in February - The Berkshire chief said he sold certain bank stocks after seeing signs of trouble in their earnings. Buffett's company has pared or fully disposed of numerous financial stocks in recent years, including JPMorgan, Goldman Sachs, Wells Fargo, PNC Financial, US Bancorp, and BNY Mellon. The investor emphasized that he didn't see problems at all of them. And now he tells that everything is OK, no problems. We could only reply on it - "physician, heal thyself".
Economists at Goldman Sachs no longer expect the U.S. Federal Reserve to raise interest rates in June, according to a research note published on Wednesday following data that showed consumer prices cooled faster than expected in March.Goldman Sachs had previously expected consecutive rate hikes at the Fed's May and June meetings. Economists led by Jan Hatzius said in the research note they still expect a rate hike in May.
"We have taken out the June hike in part because the limited data available so far appear to confirm that credit is indeed somewhat tight in the aftermath of the banking turmoil, and in part because some Fed officials appear hesitant about even a May hike," the economists wrote.
One more quarter-percentage-point interest rate hike can allow the Federal Reserve to end its tightening cycle with some confidence inflation will steadily return to the U.S. central bank's 2% target, Atlanta Fed President Raphael Bostic said. Recent inflation data, including this week's reports of slowing consumer price increases and falling producer price inflation, "are consistent with us moving one more time," Bostic told Reuters in an interview on Thursday. "We've got a lot of momentum suggesting that we're on the path to 2%."
Funds in the global money market drew a net $40.83 billion worth of inflows compared with a net $61.12 billion worth of purchases in the previous week, data from Refinitiv Lipper showed. Money market funds continue "to benefit from high U.S. real rates that forces deposits out of the banking system," brokerage Jefferies said in a note to clients.
Investors have moved $538 billion into cash funds over the past eight weeks as they pulled money out of bank deposits after the collapse of Silicon Valley Bank, according to Bank of America figures released on Friday. BofA, citing EPFR data, said investors put $51.6 billion into money market funds in the week to Wednesday as the outsized flows continued.
BofA said $65 billion has flowed into Treasury funds this year, in the best start to a year ever recorded. It said $2.3 billion flowed into bonds in the week to Wednesday, in a third straight week of inflows.
LET'S GET TO THE BOTTOM OF THIS STUFF
Indeed, whatever tells anybody - we see deflationary processes and it is stupid to deny it. Our favorite PPI all commodities index drops even faster than common CPI:
Meantime, CPI is slowing down but - Core CPI stands stubbornly high and around the same 5% levels. Experience has shown, raising the rate and other ways of tightening monetary policy (the Fed was very actively reducing the money supply due to the sale of securities on the balance sheet) gave a result, but not quite what was expected.
Actually, many experts say this, for example, JPMorgan CEO Jamie Dimon: "People should be prepared for higher rates for a longer period." But raising rates (or maintaining the current ones) in a declining economy will only accelerate the recession. But the same we hear from Fed representatives, such as Waller, Goolsby, who said that "moderate recession possible". Previously we already quoted BlackRock. As a result - market expectations of Fed rate have changed - added another 25bp increase on June 14th.
But to understand why inflation is dropping - either because of monetary policy and M2 supply cut or because of degradation in production and manufacturing sector? You need just to take a look at some charts. Last week we've shown you drop in production across the Globe. Now take a look at Retail Sales and everything becomes clear. For some case I put here few another important indicators - Semiconductor global sales and China inflation level. Take a look - both shows significant drop, which clearly indicates slowdown in a whole global economy.
But here we're also interested in sudden jump of 1-year inflationary expectations (actually they have jumped not only for 1 year horizon). What now Fed is going to do? All time while Fed was rising rate the forward inflation rates were falling. Here we need to make a comment. How is it that industrial inflation turns into deflation, consumer inflation somehow falls, and people expect prices to rise? First is - it means the lack of trust into regulators authorities, such as Fed and US Treasury. When the yield of "short" securities is greater than "long" ones, and for a long time, we can safely say that the market is in a very unstable state. Previously, this was generally a very convincing sign of a recession, but now, when the whole system is in the "red" zone, it is not necessary to talk about any stable indicators. Inevitably, investors start to get nervous, which does not add stability.
Second, is purely economical explanation. As companies reduce prices against the background of falling demand, their debt grows. As well as constant expenses go nowhere. These expenses are re-distributed over less amount of goods, which leads to price rising. That's why only monetary tools are not working. Finally, if company comes to bankruptcies and/or closure of production - other producers raise prices. This is no longer a market economy, it is an economy in falling markets, a completely different logic works.
Thus, while banking sector has reported well (at least WF, Citi and JPM) and feels good, we can't say the same about households. As we've mentioned above - consumer loans conditions are becoming stricter, expenses rising. Spending in real prices are stagnating. In general Retail Sector signals on a big problems.
Based on this short piece of data we could conclude two things - inflation is dropping due real sector slowdown, but not because of the Fed efforts. Second is - long term inflationary expectations are rising, which puts under question early and stable inflation decreasing, especially core numbers. Inflation now mostly stands high due to service sector - all "handmade" which is mostly concentrated in service sector is expensive.
So, the rope around the Fed's neck is getting tighter. In an economy caught in a debt refinancing loop, if asset prices do not rise, tax revenues tend to stagnate. The budget deficit is increasing - In the first 3 months of 2023, the deficit reached $679 billion. A 134% jump compared to the first quarter of 2022 ($291 billion).
- Revenues: $1,023 billion vs. $1,070 billion (-4.4%)
- Expenses: $1,702 billion vs. $1,361 billion (+25.1%)
The latest data from the tax Service (IRS) confirms that the average level of receipts has decreased by about 10% compared to last year. The US on their way to a $2 trillion hole in the budget. The Fed, in the official protocol, confirmed the approach of a "weak recession". Daly and other Fed speakers are becoming more dovish, but core inflation is steady and rising, which will force another rate hike in May and more probable in June. This in turn means that overall financial conditions once again will become tighter. The question is what the margin of safety on this tighteness?
Steve Hanks in his video convincingly proves that inflation in the United States should fall to 2-5% and stay there for a long time. What is important is that economic growth will continue. We would completely agree with this point of view if we were talking about the period before 2008 - everything would have been like that, as Steve says. Then, let me remind you, the world economy had not yet reached the limit of productivity and any monetary stimulus fell on fertile ground - freshly printed money was always willing to produce and supply additional goods and services. But since 2008, everything has changed - the performance limit, in all likelihood, has been reached and the system no longer works like that.
A few words about the performance limit. To find it, you need to analyze the global GDP (because the economy is global, the data on individual states have long been indicative). According to the IMF, GDP in 2008 amounted to $63.75 trillion. which is $86.7 trillion at current prices. (yes, yes, my little friends, the cumulative inflation was 36%, and this is still understated official data). In 2022, global GDP was $100.2 trillion. , real growth 15.5%.
The population during the same period (from 2008 to 2022) grew from 6.789 billion to 8.0 billion people. i.e. 18%.
In other words, the real created GDP per capita in the world fell by 2% : from $12,771 to $12,525. Of course, it behaved differently in individual countries, but this is already a matter of redistribution and not production. Therefore, development is stalling globally, and the global crisis and all sorts of other outrages.
In relation to the discussed problem of inflation in the United States, this means the following:
1) it is very impossible to increase the physical volume (Q), especially since 80% of the US GDP consists of services, and services are concentrated around goods - in order to wind up services on them (trade margin, logistics, financial, information, insurance services, etc. .) they must physically be there. And China and India, which supply these goods for the most part, firstly, cannot greatly increase supplies, and secondly, they no longer want to, especially China.
2) accordingly, any movement around the money supply mainly affects prices. From the equation MV = PQ, an increase in the money supply (M2) without an increase in Q obviously leads to an increase in P, that is, inflation. With the reduction of M2, it is a little more difficult, but if the reduction of M2 occurs due to worsening lending conditions as it is now (that is, the M2 / MO multiplier is decreasing), then this just leads to a drop in Q, (the collapse of the services market, first of all), and not to a decrease in P .
3) so -
- ️ It is no longer possible to suppress inflation without entering into a decline in real GDP
- ️ Plus, given the fact that most of the goods consumed are now produced outside the United States, a decrease in the money supply will have a limited effect on monetary efforts. And the labor market in the United States will show little here - it does not take into account the labor force in Asia, which produces products for the United States and which is many times larger in number.
There are two reasons.
The first reason is that inflation will accelerate one way or another, because with the transformation of the global financial system and the change of the economic leader, it has always been so - in the 1880s-1890s, in the 1970s. And now we are also fragmenting world trade and the energy market and God knows what else. In this situation, the money supply squeeze and rate manipulation mainly affect economic growth, but not prices. Prices stop rising when there is an excess of goods and/or the involvement of hitherto unoccupied new labor resources in the economy outstrips the emission. And this is nowhere to be found now.
The second reason is that previously, with a single "dollar-centric" capital market, all the others somehow played in favor of the main reserve currency and this allowed even with a relatively small issue to have a huge internal debt and low inflation. Now there are at least two centers: one in the USA and the other in Eurasia, and competition has already begun slowly for capital. EU, Russia and Iran are banned and doomed to mutual partnership but the rest of the players can still choose. And now it is clear that the world will be divided roughly in half, (and not at current exchange rates) and, accordingly, the US will have to share part of the global emission income. which is also a pro-inflationary factor.
Thus, 5-5.6% for the dollar is most likely a local minimum. It can go lower, but at the cost of a deep economic downturn, which apparently they will not go to, because they are more expensive for themselves. Therefore, the way of inflation upward is by 11-12%, and then again at the moment down by 8-9%. The only question is the speed of movement, but it depends on purely political events: whether the BRICS currency will be introduced, how fast the yuanization, roublatization and rupiization will go in Eurasia. It seems that it could take a year or two. That is, a new peak of inflation is somewhere by October-November, and a new local minimum is by February-March next year.
Speaking on short-term tactical issues - we're closely watching on US Treasury cash balance. The US Treasury increased spending from its accounts at the Fed and spent another $54.1 billion in a week, Yellen had only $86.6 billion left in the accounts at the Fed on April 12, in 4 weeks $191 billion of fresh dollars from the US budget fell into the financial system. This does not mean, of course, that Madame has run out of resources: there is still an opportunity to borrow about $300 billion ("emergency measures") and the expected April taxes. We wait for how long...
Trust in banks has not been restored and some market participants prefer to place money not in banks. In this part, the most interesting thing in the next two weeks - how much Yellen will be able to collect taxes – this may create tension with the liquidity of some banks, given the ongoing outflow of funds to MMF.
Meantime, ECB considers more aggressive tactic with interest rate. Decreasing worries about the state of the financial system means that interest rates could rise by half a percentage point when the European Central Bank meets next month, Governing Council member Bostjan Vasle said.
We must continue to raise interest rates,” Vasle said on the sidelines of the spring meeting of the International Monetary Fund. Options for May - from 25 to 50 basis points. There is no need to decide now, as the size of the next step will depend on data - including on bank lending, growth and inflation, ”he said.