Sive Morten
Special Consultant to the FPA
- Messages
- 18,639
Fundamentals
This was really quiet week, guys, difficult to say why, maybe be because of religious holidays - Easter first, and this week Muslims are celebrating "'I'd al-Fitr", one of the biggest holidays. So, hopefully next week will be a bit "faster" with coming IQ GDP numbers as in the US as in EU and other statistics. Still this week I would mention two topics of particular interest among investors. First is - coming ECB rate decision and EUR performance, second is the US debt ceil and potential default, no matter how curious it might sound. Discussion in the net was rather hot. So, we keep default topic for Gold report tomorrow and focus on current Fed margin safety and ECB, because it is a bit difficult to see the core among all these numbers, such as tax gathering, Treasury cash balance, emergency credit programmes etc. And you do not see the sun in this wood.
Market overview
This time I would like to start analysis with recent China numbers. In general, China is rather close country in terms of statistics and it is better to not believe it blindly. This week data has triggered euphoria on China rebound. Indeed, we have strong GDP and Retail Sales numbers, export and real estate markets:

But I would like to show you interesting chart - China Fixed Asset Investment, which is slowed to the lowest level in 27 years, excluding Covid period:
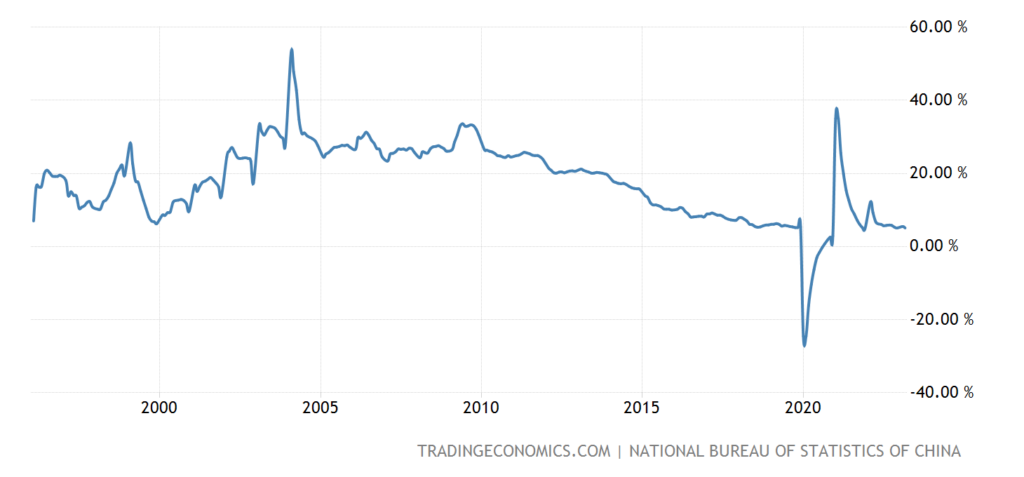
Previously we also have mentioned drastic collapse of semiconductors export, more than for 25% annually. It is very difficult to combine with recent Chinese data. Thus, we suggest two things. First is - big jump might be just technical issue, because it calculates in relation to the numbers of "zero-covid" period. And new numbers show big jump only due to low basis of comparison. This is the same like US inflation in March - it shows slowdown. But this is just because it compares to March 2022 jump for 1.9%. Thus, together with dropping capital expenditures, we still need some time to find out what is going on, and not be too exciting right now. Similar things you will see in Philadelphia Fed data below - the same drop in capital expenditures. Besides, I'm a bit concern with fast drop of PPI on a background of rising production and consumption, which should not be. This could confirm our suggestion that positive changes are pure technical phenomenon, due to weak comparison basis.
China situation right now is a major outbreak in the picture of the global structural crisis. All other stuff mostly stands the same - slowdown everywhere, so I do not put the same charts here again, just to not bother you.
The U.S. dollar fell on Thursday as weak data reinforced expectations the world's largest economy is likely headed toward recession, further supporting the view that the Federal Reserve could pause in June after another expected rate hike next month. But comments from Cleveland Fed President Loretta Mester saying that the U.S. central bank still has more interest rate increases ahead helped the dollar cut its losses. She noted, however, that the Fed's rate hikes over the last year to quash high inflation is nearing its end. Her comments came a day after New York Fed President John Williams said inflation was still at problematic levels and the U.S. central bank would act to lower it.
Thursday's data showed U.S. initial claims rose modestly to 245,000 in the latest week, while the week before was revised to show 1,000 more claims than previously reported.
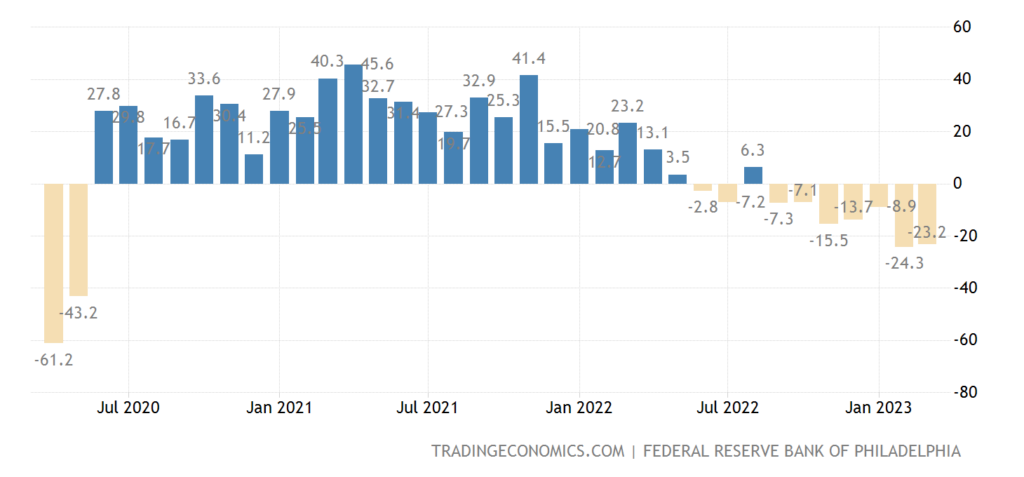
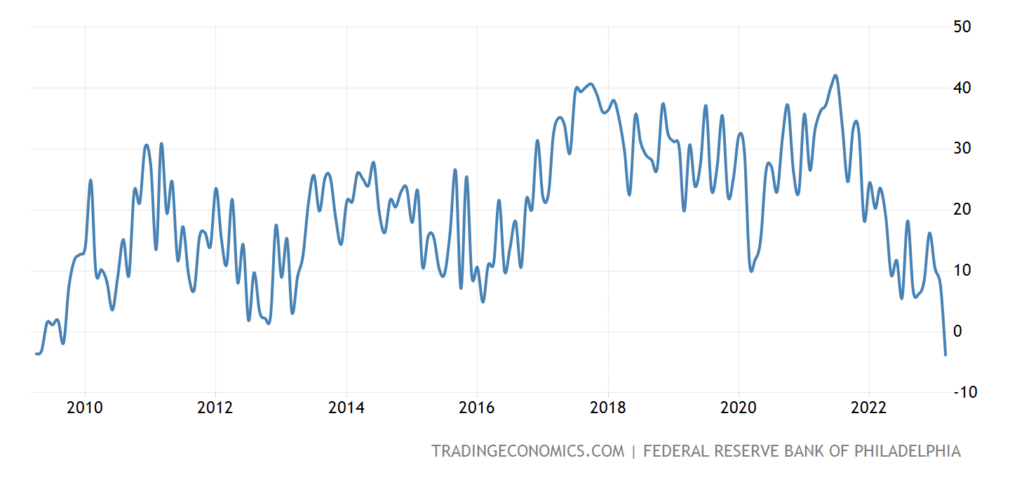
A separate report from the Philadelphia Fed showed its measure of factory activity in the mid-Atlantic region plunged to the lowest level in nearly three years in April. Manufacturers in the region expected activity to remain subdued over the next six months.
It's not much different in the U.S. housing sector. Existing home sales slid 2.4% to a seasonally-adjusted annual rate of 4.44 million units last month. They had increased in February for the first time in a year.
Concerning Phil index, I would add another interesting indicator - Philly Fed CAPEX Index. As you understand no rebound in regional production is not possible without capital expenditures and here we have a big hole. It is worst since 2009 and it seems that no have plans to put capital in there. The same like in China, mentioned above.
U.S. rate futures have priced in a nearly 90% chance of a 25 basis-point rate increase next month, and a roughly 69% probability of a pause in June . The rate futures market has also priced in rate cuts this year as the economy slows.
Meantime, Big Whales warn that high rates could stay for longer. The Federal Reserve System (FRS) may refuse further increases in the key interest rate, but is unlikely to start reducing it in the near future, the head of the investment company Blackstone Group Inc. believes. Jonathan Grey. In his opinion, the Fed will keep rates high for a long time to get rid of the remaining inflationary pressure.
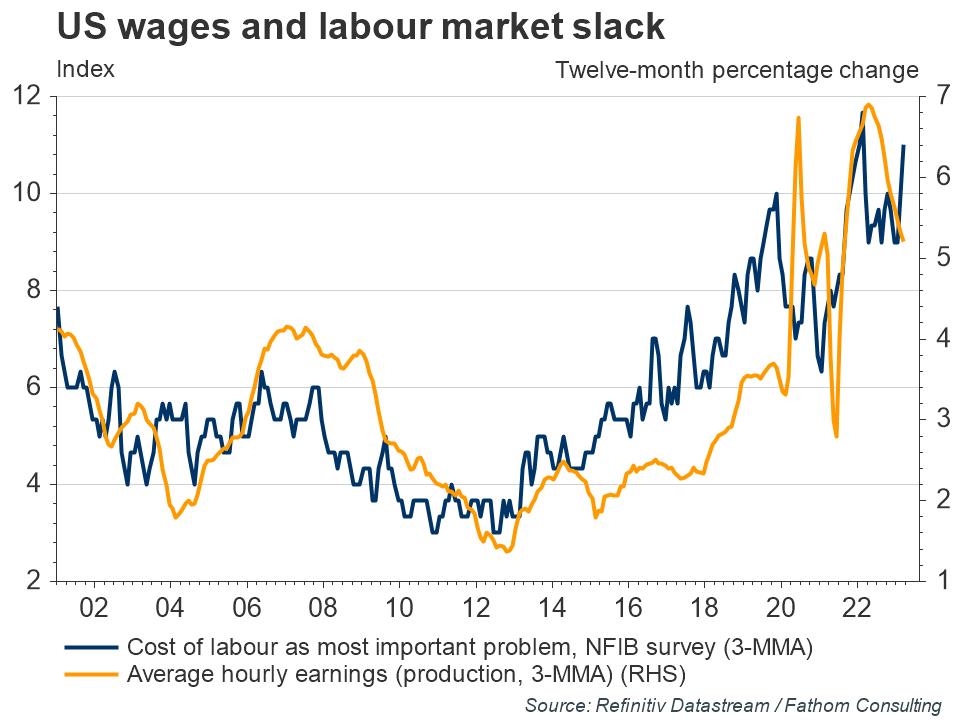
We agree that high rate remains for longer, but suggest that Fed could rise rate as in June as in July, because of stubborn Core CPI inflation data and tight labor market, that keeps significant inflationary pressure. A labour market this tight in an environment of rising living costs will generate high wage growth, which we have seen over the past year. Year-on-year wage growth remains very high at 5.1%, although in recent two months it shows sign of decreasing.
These elevated rates of inflation and healthy labour market indicators prevail despite 450 basis points of rate hikes in a year as well as the second and third largest US bank failures in history last month. Minutes from the FOMC meeting in March showed several members had considered pausing hikes given banking sector developments and the cumulative increase in the policy rate. But some others conversely have appealed to commitment of higher interest rates. They were ultimately convinced of a need to go higher by recent economic data.
The head of the Bank of International Settlements has warned that years of fighting economic crises have created conditions that are pushing the limits of stability when it comes to the international financial system. Central bankers around the world have been hiking interest rates to battle inflation. However, in a speech at Colombia University in New York, Carstens said that to avoid a long-term "high-inflation regime" rates may need to stay higher and for longer than previously thought, even at the expense of slowing down economies.
Larger increases in inflation and higher levels of private sector debt make stress ever more likely, Carstens added, noting that this was the first time since the Second World War where a major surge in inflation has come when debt levels are so high. It also means policymakers should alter their approach going forward and refrain from aggressive rate cuts, or stimulus, when inflation settles below targets.
Federal Reserve emergency lending to banks in the wake of last month's financial sector troubles remains high and increased modestly in the latest week, according to data released on Thursday by the Federal Reserve. The institution reported that borrowing via three programs aimed at supporting banks moved to $316.5 billion as of Wednesday, from $312 billion on April 12. While the overall sum remains very large and dramatically outstrips lending seen during the peak of the financial crisis.
US Treasury cash holdings jump $108 billion on tax day. Still uncertainty remains as to whether the US can survive until the end of the summer without risking a debt ceiling default. Figures for cash inflows on tax day were somewhat lackluster. ️The change in cash balance increases the Treasury Treasury to the level last seen on March 20th. It remains to be seen if this will give lawmakers enough breathing room to find a solution to the debt cap standoff and avoid a technical default. ️The one-day gain is the biggest since January. 24 years in which the Treasury received over $101 billion in net new cash from bill settlement.

HAS OVERALL SITUATION IN THE US IMPROVED?
It might be difficult to get it right with all these numbers around the US budget, Fed and Treasury programmes. Let's see. Tax collection is a good stuff, that increases US Treasury cash balance on Fed account, that we're usually watching, up to ~ 265 Bln, from ~$96 Bln last week. It some kind of US Treasury margin of safety. At the same time, the latest tax data (IRS) confirms that the average level of receipts has decreased by about 10% compared to last year. The government still spends more (by 7% of GDP) than it receives. Year-on-year spending growth reached 36% in March 2023, while to balance the revenue side, a 27% reduction in expenses is necessary. In the first 3 months of 2023, the deficit reached $679 billion, a jump of 134% compared to the first quarter of 2022 ($291 billion).
Fed lending to banks increased last week: the crisis is not over. Loans through the discount window rose 3.4% to $69.9bn. BTFP loans rose 3% to $74bn. QT is sluggish at $17bn. Foreign securities swaps are down $10bn to $20bn.

Bank reserves in the US system fell by $183 billion in a week to $3.164 trillion due to an increase in TGA (tax payment), while reverse repo remain stable at $2.3 trillion.
As a result - over the week, liquidity in the dollar financial system shrank by $192 billion, with bank deposits at the Fed down $183 billion and dollar repos minus $9 billion. Over the next 5 months, the Treasury will have to borrow at least $1.2-1.3 trillion to finance the budget deficit and restore the cache to at least $500-600 billion for the large Q4 2023 spending. The general situation with liquidity will worsen on the horizon of 5 months, so there will be no market support in this direction. And don't forget about coming turmoil with the Debt ceil.
ECB EXPECTATIONS
The European Central Bank is expected to raise rates for a seventh straight meeting on May 4, lending support for the euro. Policymakers are converging on a 25-bps hike, even if a larger move is not yet off the table. The recovery in the euro zone unexpectedly gathered pace this month, thanks to a boom in services sector demand compensating for a deepening decline in manufacturing.
Goldman Sachs on Tuesday raised its terminal rate forecast for the European Central Bank (ECB) to 3.75% from 3.5%, citing easing worries about the banking system, signs of underlying inflation remaining strong and generally hawkish commentary from policymakers. Goldman economists expect the ECB to raise rates by 25 basis points (bps) in May, June and July, but said the choice between a 25 bps and a 50 bps increase in May will be a close call due to lower banking risks, growth resilience and strength in underlying inflation.
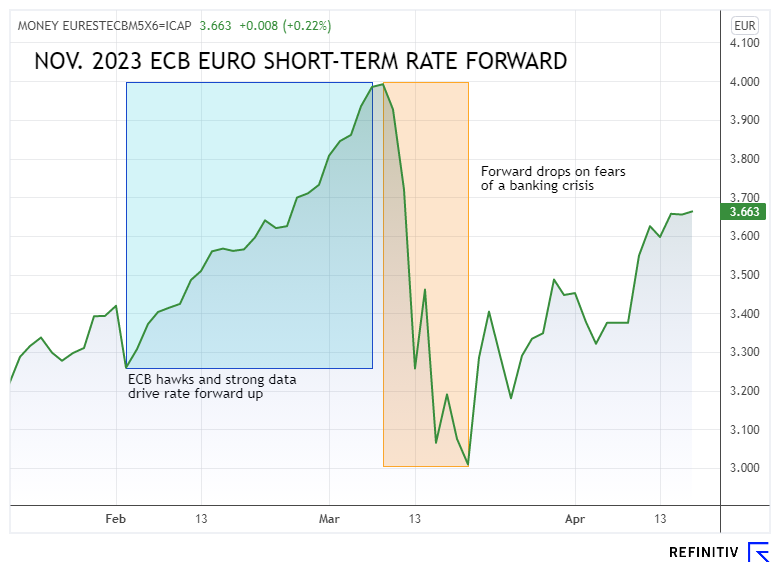
European Central Bank officials are still banging the inflation drum and suggesting interest rates must keep rising, but there's enough nervousness about banks or a possible policy misstep to mean they face an uphill battle convincing markets. Having firmly scaled-back rate expectations amid last month's market turmoil, investors no longer expect borrowing costs to stay higher for longer and are cautious about pricing in a deposit rate above 4%.
BofA said late last week it had closed its short September 2023 Euribor position, arguing it would be difficult for the market to price in a terminal rate above 3.75% without more confidence that the ECB will hike by another 50 bps in May.
A surge in trading volumes of bond futures as investors reassessed the policy outlook reflects the level of conviction about rates peaking lower, analysts said. Markets are also now pricing in cuts in the first half of 2024, a sign investors fear the ECB might raise rates too much, too fast and will need to reduce them quickly.
Analysts estimate it takes around six months for any changes in monetary policy to have an impact on inflation and growth.
Commerzbank flagged a recent drop in volatility - the rate at which an asset price increases or decreases - as a further indication that markets suspect the hiking cycle is almost over, adding that volatility is correlated with the distance from the actual deposit rate to the expected terminal rate. This means that the smaller the gap between the current benchmark rate and the expected rate, the lower the volatility, and vice versa.
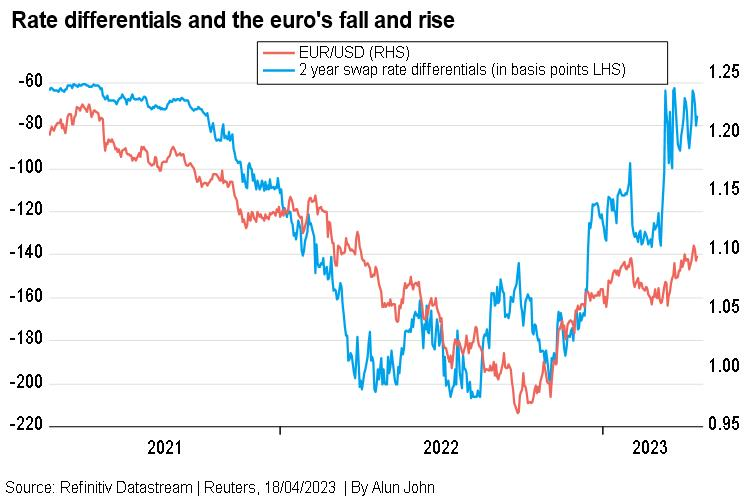
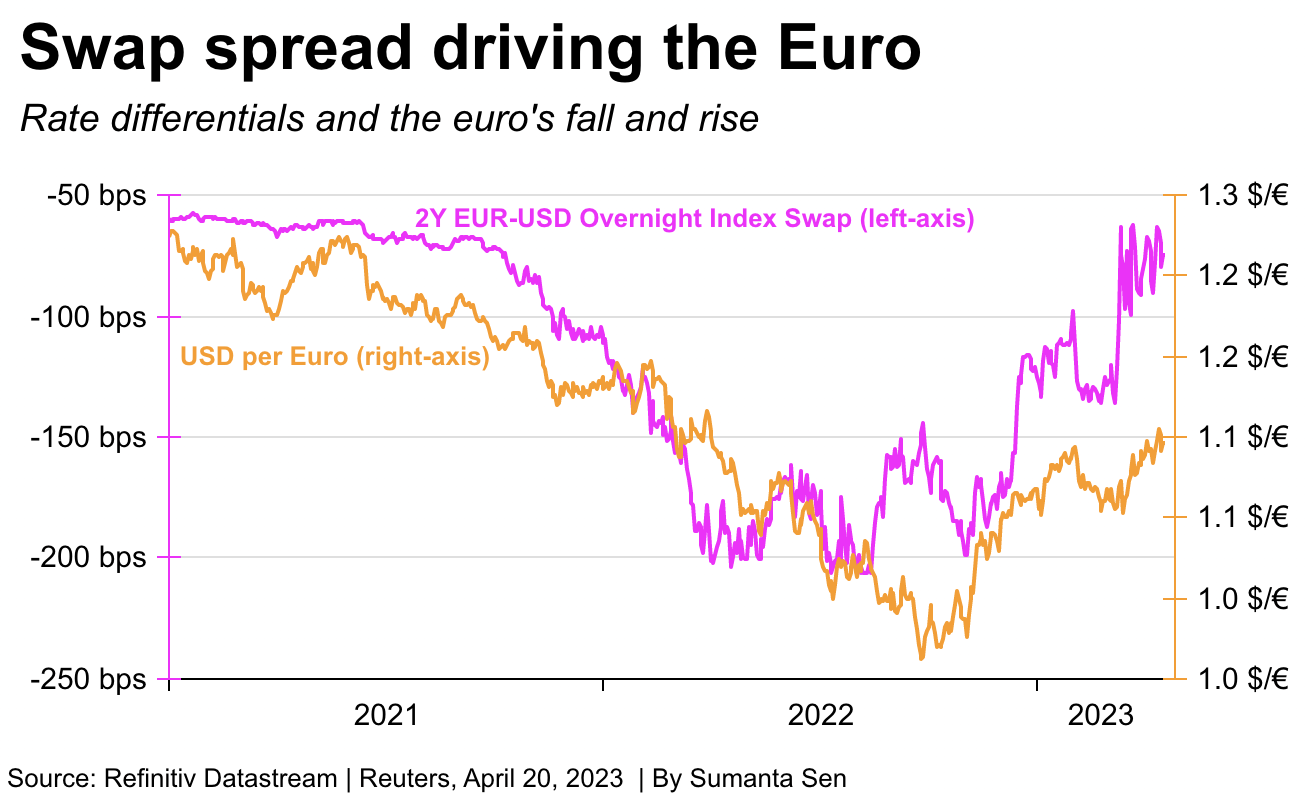
Driving the momentum, and likely future strength, is the view that U.S. interest rates are close to peaking, while borrowing costs in Europe - where inflation is stickier - have further to climb.
BMO Capital Markets forecasts the euro at $1.12 and the pound at $1.27 in the next three months because of the gap between U.S. and European rate expectations.
Nomura forecasts the euro will surge to $1.14 by the end of June and tips sterling to hit $1.30 this year. That should help the euro strengthen further against the dollar, M&G Investments fund manager Eva Sun-Wai said, while noting that any new crisis could give the greenback fresh impetus: "We also have the question of what dominates: rate differentials or safe-haven status?"
Bulls are hoping for some hawkish commentary from the European Central Bank's policymakers and for plenty of data that suggests the central bank could keep rates higher for longer than the Federal Reserve. The premium of U.S. market rates over their European counterparts reached their narrowest in many months in early April, on the view that U.S. rate cuts are coming later this year while borrowing costs in Europe have further to climb.
Those expectations have pushed the euro, the pound and the Swiss franc to multi-month highs, although this rally could lose steam as markets reassess whether Fed cuts are really coming. Anything that dents the dollar's yield appeal should help keep European currencies looking perky, at least for now.
Conclusion:
Idea of rate differential and swap market looks reasonable and exciting but not everything stands so simple. People are forgetting about inflation. If in the US we have 5.6% level and coming 5% rate, i.e. real "- 0.6%", in EU we have 7% inflation with coming 3% rate and "-4%" real rate. It might be just 1.5% (150 b.p.) nominal spread but "real spread" is significantly higher. And real rate parity to get EUR reach 1.2 level should be in real terms, I suppose. But anyway this is secondary factor by our view.
The primary one is a cash for Fed. US Treasury and the Fed need money. They nead at least $1.5-2 Trln by the end of the year. With the current rate level and with even 5.25% priced-in rate change they will not get it. Stock market will not collapse, people keep holding their money on bank deposits at very low rates:

So, we see no competition among banks for liquidity. Why? It was pumped more than 4 Trln. and they feel absolutely comfortable - just take a look at recent banking statement. Fed is not satisfied with this. They need to send the bulk of this money into US Treasuries, as well as crypto and stock markets as well. At the same time they have to keep QT somehow and finance existed government spending. From this standpoint, we suggest that this is high degree of more rate hikes in June and July at least. Besides, this support positive carry trade for US Dollar against other currencies.
If we take a look at ability to do this - yes overall financial system feels some stress but it is not vital by far. 500 Bln was enough to stabilize situation in banking sector and this level is not increasing. Job market shows strength. Other indicators turn negative but are not vital yet. I mean GDP, Retail Sales, manufacturing, PMI's and sentiment. Besides, inflation shows slowdown (although temporary, but who cares?). Definitely some free margin of safety exist and Fed could tight a bit more. Actually they do not need too much to break the markets. Two more "unexpected" rate hikes in June and July should be enough to crash markets and with some verbal pressure to keep rates for long time.
Meantime in EU we see no big difference to the US situation, although banking sector maybe in a bit better condition. Still, German investor sentiment unexpectedly fell in April as financial markets see more restrictive credit conditions in the coming months, the ZEW economic research institute said on Tuesday. The institute's economic sentiment index dropped to 4.1 from 13.0 in March.
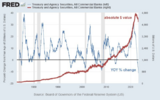
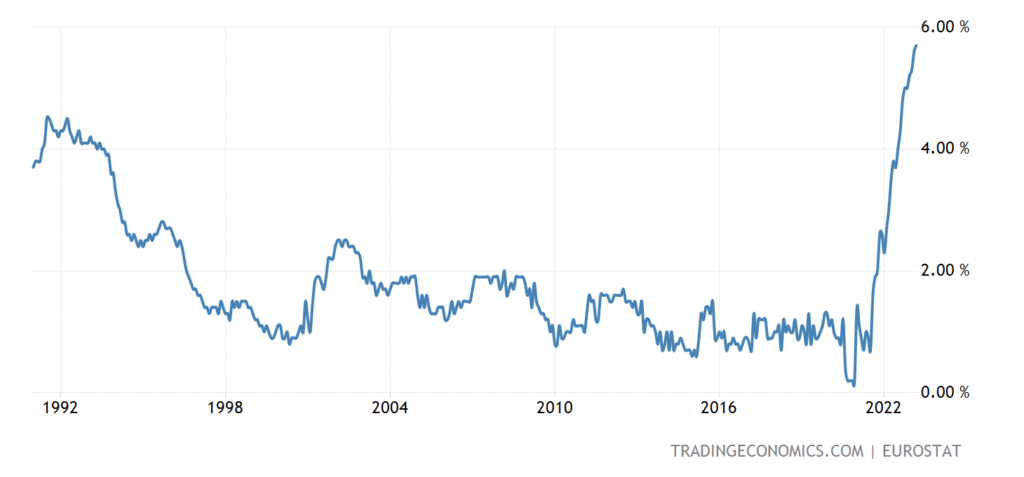
The assessment of the economic situation in Germany, however, improved considerably, rising to -32.5 points from -46.5 the month before and above analysts' prediction of -40.0. EU core inflation is stubbornly strong, as well as in the US - hits the record of 32 years of observation
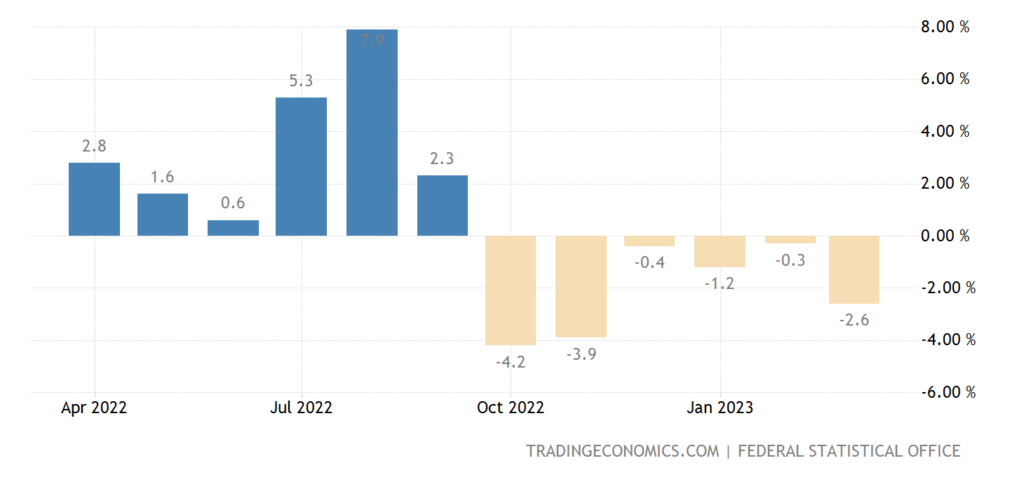
And take a look - Germany PPI shows deflation, the same as in the US and China:
This was really quiet week, guys, difficult to say why, maybe be because of religious holidays - Easter first, and this week Muslims are celebrating "'I'd al-Fitr", one of the biggest holidays. So, hopefully next week will be a bit "faster" with coming IQ GDP numbers as in the US as in EU and other statistics. Still this week I would mention two topics of particular interest among investors. First is - coming ECB rate decision and EUR performance, second is the US debt ceil and potential default, no matter how curious it might sound. Discussion in the net was rather hot. So, we keep default topic for Gold report tomorrow and focus on current Fed margin safety and ECB, because it is a bit difficult to see the core among all these numbers, such as tax gathering, Treasury cash balance, emergency credit programmes etc. And you do not see the sun in this wood.
Market overview
This time I would like to start analysis with recent China numbers. In general, China is rather close country in terms of statistics and it is better to not believe it blindly. This week data has triggered euphoria on China rebound. Indeed, we have strong GDP and Retail Sales numbers, export and real estate markets:
But I would like to show you interesting chart - China Fixed Asset Investment, which is slowed to the lowest level in 27 years, excluding Covid period:
Previously we also have mentioned drastic collapse of semiconductors export, more than for 25% annually. It is very difficult to combine with recent Chinese data. Thus, we suggest two things. First is - big jump might be just technical issue, because it calculates in relation to the numbers of "zero-covid" period. And new numbers show big jump only due to low basis of comparison. This is the same like US inflation in March - it shows slowdown. But this is just because it compares to March 2022 jump for 1.9%. Thus, together with dropping capital expenditures, we still need some time to find out what is going on, and not be too exciting right now. Similar things you will see in Philadelphia Fed data below - the same drop in capital expenditures. Besides, I'm a bit concern with fast drop of PPI on a background of rising production and consumption, which should not be. This could confirm our suggestion that positive changes are pure technical phenomenon, due to weak comparison basis.
China situation right now is a major outbreak in the picture of the global structural crisis. All other stuff mostly stands the same - slowdown everywhere, so I do not put the same charts here again, just to not bother you.
The U.S. dollar fell on Thursday as weak data reinforced expectations the world's largest economy is likely headed toward recession, further supporting the view that the Federal Reserve could pause in June after another expected rate hike next month. But comments from Cleveland Fed President Loretta Mester saying that the U.S. central bank still has more interest rate increases ahead helped the dollar cut its losses. She noted, however, that the Fed's rate hikes over the last year to quash high inflation is nearing its end. Her comments came a day after New York Fed President John Williams said inflation was still at problematic levels and the U.S. central bank would act to lower it.
"The rhetoric coming from the Fed...is that they're looking to keep rates higher for longer," said Alvise Marino, macro strategist, at Credit Suisse in New York. He added though that with the U.S. data, "we could see loss of interest rate support for the dollar," noting that "the market has a pretty aggressive view that the Fed is going to be cutting rates this year."
Thursday's data showed U.S. initial claims rose modestly to 245,000 in the latest week, while the week before was revised to show 1,000 more claims than previously reported.
A separate report from the Philadelphia Fed showed its measure of factory activity in the mid-Atlantic region plunged to the lowest level in nearly three years in April. Manufacturers in the region expected activity to remain subdued over the next six months.
It's not much different in the U.S. housing sector. Existing home sales slid 2.4% to a seasonally-adjusted annual rate of 4.44 million units last month. They had increased in February for the first time in a year.
Concerning Phil index, I would add another interesting indicator - Philly Fed CAPEX Index. As you understand no rebound in regional production is not possible without capital expenditures and here we have a big hole. It is worst since 2009 and it seems that no have plans to put capital in there. The same like in China, mentioned above.
"It's increasingly clear that the U.S. economy is headed for recession. It's just a matter of time," said Erik F. Nelson, macro strategist at Wells Fargo Securities in London.
"A U.S. recession would be bad for the dollar. If the U.S. is leading the world into recession, it's hard to see a big demand for the dollar."
U.S. rate futures have priced in a nearly 90% chance of a 25 basis-point rate increase next month, and a roughly 69% probability of a pause in June . The rate futures market has also priced in rate cuts this year as the economy slows.
"The buck is no longer strongly supported by the Fed's message on interest rate hikes and other currencies are flowing as a result of growing optimism globally about a second half of the year that will see not only lower inflation, but avoid too strong of a recessionary pressure," said Juan Perez, director of trading at Monex USA in Washington.
Meantime, Big Whales warn that high rates could stay for longer. The Federal Reserve System (FRS) may refuse further increases in the key interest rate, but is unlikely to start reducing it in the near future, the head of the investment company Blackstone Group Inc. believes. Jonathan Grey. In his opinion, the Fed will keep rates high for a long time to get rid of the remaining inflationary pressure.
️"Most likely, the Fed will now pause or raise rates by another 25 basis points, but I don't think the rate cut will follow as soon as the market expects," he said in an interview with the Financial Times.️
We agree that high rate remains for longer, but suggest that Fed could rise rate as in June as in July, because of stubborn Core CPI inflation data and tight labor market, that keeps significant inflationary pressure. A labour market this tight in an environment of rising living costs will generate high wage growth, which we have seen over the past year. Year-on-year wage growth remains very high at 5.1%, although in recent two months it shows sign of decreasing.
These elevated rates of inflation and healthy labour market indicators prevail despite 450 basis points of rate hikes in a year as well as the second and third largest US bank failures in history last month. Minutes from the FOMC meeting in March showed several members had considered pausing hikes given banking sector developments and the cumulative increase in the policy rate. But some others conversely have appealed to commitment of higher interest rates. They were ultimately convinced of a need to go higher by recent economic data.
The head of the Bank of International Settlements has warned that years of fighting economic crises have created conditions that are pushing the limits of stability when it comes to the international financial system. Central bankers around the world have been hiking interest rates to battle inflation. However, in a speech at Colombia University in New York, Carstens said that to avoid a long-term "high-inflation regime" rates may need to stay higher and for longer than previously thought, even at the expense of slowing down economies.
Larger increases in inflation and higher levels of private sector debt make stress ever more likely, Carstens added, noting that this was the first time since the Second World War where a major surge in inflation has come when debt levels are so high. It also means policymakers should alter their approach going forward and refrain from aggressive rate cuts, or stimulus, when inflation settles below targets.
Federal Reserve emergency lending to banks in the wake of last month's financial sector troubles remains high and increased modestly in the latest week, according to data released on Thursday by the Federal Reserve. The institution reported that borrowing via three programs aimed at supporting banks moved to $316.5 billion as of Wednesday, from $312 billion on April 12. While the overall sum remains very large and dramatically outstrips lending seen during the peak of the financial crisis.
US Treasury cash holdings jump $108 billion on tax day. Still uncertainty remains as to whether the US can survive until the end of the summer without risking a debt ceiling default. Figures for cash inflows on tax day were somewhat lackluster. ️The change in cash balance increases the Treasury Treasury to the level last seen on March 20th. It remains to be seen if this will give lawmakers enough breathing room to find a solution to the debt cap standoff and avoid a technical default. ️The one-day gain is the biggest since January. 24 years in which the Treasury received over $101 billion in net new cash from bill settlement.
HAS OVERALL SITUATION IN THE US IMPROVED?
It might be difficult to get it right with all these numbers around the US budget, Fed and Treasury programmes. Let's see. Tax collection is a good stuff, that increases US Treasury cash balance on Fed account, that we're usually watching, up to ~ 265 Bln, from ~$96 Bln last week. It some kind of US Treasury margin of safety. At the same time, the latest tax data (IRS) confirms that the average level of receipts has decreased by about 10% compared to last year. The government still spends more (by 7% of GDP) than it receives. Year-on-year spending growth reached 36% in March 2023, while to balance the revenue side, a 27% reduction in expenses is necessary. In the first 3 months of 2023, the deficit reached $679 billion, a jump of 134% compared to the first quarter of 2022 ($291 billion).
Fed lending to banks increased last week: the crisis is not over. Loans through the discount window rose 3.4% to $69.9bn. BTFP loans rose 3% to $74bn. QT is sluggish at $17bn. Foreign securities swaps are down $10bn to $20bn.
Bank reserves in the US system fell by $183 billion in a week to $3.164 trillion due to an increase in TGA (tax payment), while reverse repo remain stable at $2.3 trillion.
As a result - over the week, liquidity in the dollar financial system shrank by $192 billion, with bank deposits at the Fed down $183 billion and dollar repos minus $9 billion. Over the next 5 months, the Treasury will have to borrow at least $1.2-1.3 trillion to finance the budget deficit and restore the cache to at least $500-600 billion for the large Q4 2023 spending. The general situation with liquidity will worsen on the horizon of 5 months, so there will be no market support in this direction. And don't forget about coming turmoil with the Debt ceil.
ECB EXPECTATIONS
The European Central Bank is expected to raise rates for a seventh straight meeting on May 4, lending support for the euro. Policymakers are converging on a 25-bps hike, even if a larger move is not yet off the table. The recovery in the euro zone unexpectedly gathered pace this month, thanks to a boom in services sector demand compensating for a deepening decline in manufacturing.
Goldman Sachs on Tuesday raised its terminal rate forecast for the European Central Bank (ECB) to 3.75% from 3.5%, citing easing worries about the banking system, signs of underlying inflation remaining strong and generally hawkish commentary from policymakers. Goldman economists expect the ECB to raise rates by 25 basis points (bps) in May, June and July, but said the choice between a 25 bps and a 50 bps increase in May will be a close call due to lower banking risks, growth resilience and strength in underlying inflation.
European Central Bank officials are still banging the inflation drum and suggesting interest rates must keep rising, but there's enough nervousness about banks or a possible policy misstep to mean they face an uphill battle convincing markets. Having firmly scaled-back rate expectations amid last month's market turmoil, investors no longer expect borrowing costs to stay higher for longer and are cautious about pricing in a deposit rate above 4%.
BofA said late last week it had closed its short September 2023 Euribor position, arguing it would be difficult for the market to price in a terminal rate above 3.75% without more confidence that the ECB will hike by another 50 bps in May.
A surge in trading volumes of bond futures as investors reassessed the policy outlook reflects the level of conviction about rates peaking lower, analysts said. Markets are also now pricing in cuts in the first half of 2024, a sign investors fear the ECB might raise rates too much, too fast and will need to reduce them quickly.
Analysts estimate it takes around six months for any changes in monetary policy to have an impact on inflation and growth.
"We don't think rate cuts are around the corner," said Colin Graham, head of multi-asset strategies at Robeco. "The only risk, which is outside our central investment scenario, is that central banks have done too much tightening already, with disproportional economic damages that will become evident soon," he added.
Commerzbank flagged a recent drop in volatility - the rate at which an asset price increases or decreases - as a further indication that markets suspect the hiking cycle is almost over, adding that volatility is correlated with the distance from the actual deposit rate to the expected terminal rate. This means that the smaller the gap between the current benchmark rate and the expected rate, the lower the volatility, and vice versa.
Driving the momentum, and likely future strength, is the view that U.S. interest rates are close to peaking, while borrowing costs in Europe - where inflation is stickier - have further to climb.
"In the U.S. you're starting to price for (rate) cuts pretty soon, in the second half of this year, whereas you have modest pricing for that in Europe and the UK," said Tim Graf, State Street Global Markets' head of macro strategy for EMEA.
"The case for continued narrowing is strong. European wage and price inflation is higher than the U.S., which historically is equivalent to European yields being at least as high as the U.S. across the yield curve," Deutsche Bank Research said. An interest rate differential that is flat between the two regions would be equivalent to a euro/dollar move up to around 1.20."
BMO Capital Markets forecasts the euro at $1.12 and the pound at $1.27 in the next three months because of the gap between U.S. and European rate expectations.
Nomura forecasts the euro will surge to $1.14 by the end of June and tips sterling to hit $1.30 this year. That should help the euro strengthen further against the dollar, M&G Investments fund manager Eva Sun-Wai said, while noting that any new crisis could give the greenback fresh impetus: "We also have the question of what dominates: rate differentials or safe-haven status?"
Bulls are hoping for some hawkish commentary from the European Central Bank's policymakers and for plenty of data that suggests the central bank could keep rates higher for longer than the Federal Reserve. The premium of U.S. market rates over their European counterparts reached their narrowest in many months in early April, on the view that U.S. rate cuts are coming later this year while borrowing costs in Europe have further to climb.
Those expectations have pushed the euro, the pound and the Swiss franc to multi-month highs, although this rally could lose steam as markets reassess whether Fed cuts are really coming. Anything that dents the dollar's yield appeal should help keep European currencies looking perky, at least for now.
Conclusion:
Idea of rate differential and swap market looks reasonable and exciting but not everything stands so simple. People are forgetting about inflation. If in the US we have 5.6% level and coming 5% rate, i.e. real "- 0.6%", in EU we have 7% inflation with coming 3% rate and "-4%" real rate. It might be just 1.5% (150 b.p.) nominal spread but "real spread" is significantly higher. And real rate parity to get EUR reach 1.2 level should be in real terms, I suppose. But anyway this is secondary factor by our view.
The primary one is a cash for Fed. US Treasury and the Fed need money. They nead at least $1.5-2 Trln by the end of the year. With the current rate level and with even 5.25% priced-in rate change they will not get it. Stock market will not collapse, people keep holding their money on bank deposits at very low rates:
So, we see no competition among banks for liquidity. Why? It was pumped more than 4 Trln. and they feel absolutely comfortable - just take a look at recent banking statement. Fed is not satisfied with this. They need to send the bulk of this money into US Treasuries, as well as crypto and stock markets as well. At the same time they have to keep QT somehow and finance existed government spending. From this standpoint, we suggest that this is high degree of more rate hikes in June and July at least. Besides, this support positive carry trade for US Dollar against other currencies.
If we take a look at ability to do this - yes overall financial system feels some stress but it is not vital by far. 500 Bln was enough to stabilize situation in banking sector and this level is not increasing. Job market shows strength. Other indicators turn negative but are not vital yet. I mean GDP, Retail Sales, manufacturing, PMI's and sentiment. Besides, inflation shows slowdown (although temporary, but who cares?). Definitely some free margin of safety exist and Fed could tight a bit more. Actually they do not need too much to break the markets. Two more "unexpected" rate hikes in June and July should be enough to crash markets and with some verbal pressure to keep rates for long time.
Meantime in EU we see no big difference to the US situation, although banking sector maybe in a bit better condition. Still, German investor sentiment unexpectedly fell in April as financial markets see more restrictive credit conditions in the coming months, the ZEW economic research institute said on Tuesday. The institute's economic sentiment index dropped to 4.1 from 13.0 in March.
"The ZEW Indicator of Economic Sentiment has dropped noticeably and currently points to an unchanged economic situation for the next six months," ZEW President Achim Wambach said. "The still high inflation rates and the internationally restrictive monetary policy are also weighing on the economy," Wambach said.
The assessment of the economic situation in Germany, however, improved considerably, rising to -32.5 points from -46.5 the month before and above analysts' prediction of -40.0. EU core inflation is stubbornly strong, as well as in the US - hits the record of 32 years of observation
And take a look - Germany PPI shows deflation, the same as in the US and China: