nicolebobbin
Private
- Messages
- 76
Hi Sive, Do you count Elliot Wave ?
Dear Sive,
Thanks for the clear analysis of the EURUSD.
About the NZDUSD DRPO sell of last week:
It looks like it has failed.
Am I right !?
Regards, BackSpace
Hi Sive, Do you count Elliot Wave ?
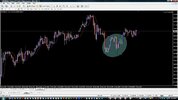
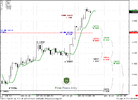
Hi Sive, I am looking for patterns on the xauusd and here is what I see. I see a double repo buy on the xauusd 1-hr chart. On the other hand, I see a butterfly buy pattern forming on the 4-hour chart. What does one do in this case? Also, when drawing a butterfly pattern, how does one know from which initial upswing to begin drawing the pattern? Different starting points result in expansion points. In this instance, I started from where I did after measuring out an A-B-C-D pattern up to its peak (for an A-B-C-D sell) and also by placing the confluence of the two triangles at approximately .768 level and finding that the possible target of the butterfly's 1.27 expansion coincides with a 50% retracement from the most recent longer swing up. I am looking at a potential drpo buy on the 4-hr chart of the xag but the bar has not yet closed. Thank you for any instruction on this.
Hi Sive, I am looking for patterns on the xauusd and here is what I see. I see a double repo buy on the xauusd 1-hr chart. On the other hand, I see a butterfly buy pattern forming on the 4-hour chart. What does one do in this case? Also, when drawing a butterfly pattern, how does one know from which initial upswing to begin drawing the pattern? Different starting points result in expansion points. In this instance, I started from where I did after measuring out an A-B-C-D pattern up to its peak (for an A-B-C-D sell) and also by placing the confluence of the two triangles at approximately .768 level and finding that the possible target of the butterfly's 1.27 expansion coincides with a 50% retracement from the most recent longer swing up. I am looking at a potential drpo buy on the 4-hr chart of the xag but the bar has not yet closed. Thank you for any instruction on this.
Hy Icarus!
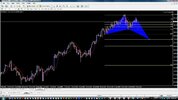
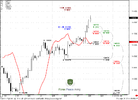
If you mind my opinion, I should say that as the Hourly DRPO Buy is concerned the retracement is to great so it is not a DRPO.
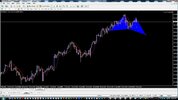
As for the Butterfly, this is a reverse pattern so the AB wing should not be in the trend direction but pointing the other way. For eg. in your chart, the highest point could be the A point and the lowest of the retracement could be the B point.
Good trading to you!
Hi friends,
Icarus, I do not want to upset you - we all study here, but Georgeta is right on both patterns.
1. This is not DRPO at 3 reasons - poor thrust, too much consolidations between bottoms and too deep retracement after first penetration.
Couple of days ago I've posted video for NZD - there you can see how should thurst look.
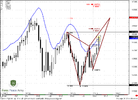
2. About butterfly. I hope that simple rule will help you to not get it wrong in future:
the initial swing of Butterfly always opposed to previous swing. Just look at yesterday's hourly chart on EUR, that we've discussed, or monthly chart in the beggining of this thread - see, initial butterfly swing move against previous tendency...
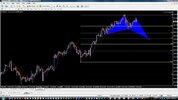
Generally speaking, Gold stands at all time 1.618 extension. Once I' ve posted yearly chart here. This target is at 1500 area. So, it should be solid resistance ahead.
Besides, there were news that public start to buy out gold jewelry in China. Usually when grandmas and grandpas enter on some markets - shares or commodities - it means that rally is very close to an end...