FOREX PRO Weekly April 25-29, 2011

Hi Sive,

Yesterday you siad:

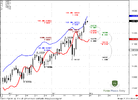
"Market has strong upside momentum. But 1.4750 - strong area of resistance."

What is your view now?

Thanks.

Hi Alf,
1.4750 is monthly overbought and it's rather an "area" than precise level. Trading in such environment should has as a target - previous highs if you enter on retracement.
Dear Sive;
About the DRPO: I listened to the video as well. I didn't quite get if i'm meant to wait for it to close under the 3X3 and then enter when it closes above or i could enter short when it closes beneath the 3X3 once?
thanks a million in advance.
sincerely
mjunkyard

I suppose you have some confusing with difference between B&B trade and DRPO.
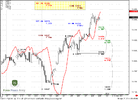
1. B&B is a continuation pattern. You need solid thrust, single close below 3x3, but market during this retracement below DMA should reach some significant Fib support. And then, due momentum, market jumps out from this support and reaches at least 0.618 Fib resistance from this retracement move. So here you should enter Long.
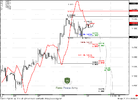
2.DRPO - this is reversal pattern. You need thrust, first petentration of 3x3, but retracement should not reach significant Fib support, then close above 3x3 and then second close below - this is confirmation. Here you should "Sell".
Also both tops of DRPO should be very close to each other and the number bars between them sould not be too many.
 
Hi Alf,
1.4750 is monthly overbought and it's rather an "area" than precise level. Trading in such environment should has as a target - previous highs if you enter on retracement.

Thanks Sive.

Here is another quotation of your analisis (from Weekly):

"Conclusion:
Position traders:
If you have position - hold them, but tight stops. Be ready to exit around 1.4650-1.4750.
If you are flat now – stay flat. Although context is bullish, market stands at resistance and monthly overbought.

Intraday traders:
Although trend is bullish, existence of strong resistance just above the market – 1.4650-1.4750 could lead to deep plunges on intraday charts. Nearest target is 1.4650 area."

Market went up to 1.4850+ area. Is that in comliance with your current view, having in mind the above mentioned levels/area?

Thanks.

I think so...
Result of analysis is a question of probability, but anything could happen. May be tomorrow market will hit 1.50, who knows.
From probability point of view - it's better to wait some retracement lower than just jump in currently.
 
eurgbp

Hello Mr. Morten!
Would you be so kind to give your opinion on EURGBP on Weekly? I wonder if this situation is tradable. I think that B&B is possible and then jump in...
Thank you!
 

Attachments

  • eurgbp.gif
    eurgbp.gif
    18.2 KB · Views: 112
  • eurgbp1.gif
    eurgbp1.gif
    29.4 KB · Views: 122
  • eurgbp2.gif
    eurgbp2.gif
    26.3 KB · Views: 112
Guys..

Rather don't trade than lose your money!
Sive reminded us that gold is on ALL TIME 1.618 resistance.
Probability suggests retracement and so medium to short term end of trend on dollar pairs...
I will wait for some daily white candles then wait for around about a 61.8 retracement;) then enter... If you gotta trade sell Fukashima;)
Regards,
Paul
 
I came across this Elliot Wave count from an expert TA website, Sive said he is not a Elliot follower so sorry Sive for posting this here, hope this can point out some view for us. From this wave count, market need to complete the wave cycle before pull back, this mean it's very unlikely for EU to drop before reaching at least 1.5
5630.png
 
EUR/USD Daily Update, Fri 29, April 2011

Good morning,
Due to overbought or near overbought conditions on monthly and daily time frames - it's not the time to enter Long for long term and marry any position. Also context is strongly bullish - we have no reason to enter short.
Hence, all that we can do is to trade intraday.

On daily time frame we see that overbought level for today stands at 1.4910.
Nearest target is 1.4946 - 1.618 from recent AB-CD pattern. Trend is bullish.

4-hour
trend slightly turns bearish, but before that I see two stop grabbers. Besides, price action does not support trend direction. So, I can't say for sure, but it's very probable that market could show attempt to take out the highs on 4 hour chart.
Also here you can see another target at 1.4920 - the same area.

Hourly -
the same thoughts about trend. And here we can see couple of possibilities - it could turn to butterfly sell with targets at 1.49 and 1.4930 - the same area.
Or market could show AB-CD retracement to 1.4710-1.4720 area. From that perspective, it's better to place stops below this area, because even if market will erase Butterfly - it could just accomplish AB-CD and reverse up again.
If it will break this area - then possibly we should expect deeper retracement.
Besides, using any lower areas to place stop will lead you to unattractive risk/reward ratio...
 

Attachments

  • EUR_D_29_04_11.PNG
    EUR_D_29_04_11.PNG
    43 KB · Views: 101
  • EUR_4H_29_04_11.PNG
    EUR_4H_29_04_11.PNG
    45.5 KB · Views: 102
  • EUR_1H_29_04_11.PNG
    EUR_1H_29_04_11.PNG
    44.2 KB · Views: 102
Hello Mr. Morten!
Would you be so kind to give your opinion on EURGBP on Weekly? I wonder if this situation is tradable. I think that B&B is possible and then jump in...
Thank you!

Hi Georgeta,
Yes, I agree with your analysis - all trends are bullish(month, week, day). I've attached monthly chart - here we can see that after solid thrust, market just shown AB-CD retracement with Butterfly. The nearest target from this price action stands just below parity.

Rather don't trade than lose your money!
Sive reminded us that gold is on ALL TIME 1.618 resistance.
Probability suggests retracement and so medium to short term end of trend on dollar pairs...
I will wait for some daily white candles then wait for around about a 61.8 retracement;) then enter... If you gotta trade sell Fukashima;)
Regards,
Paul

Hi Paul,
Yes, here is annual chart of Gold by the way...
I came across this Elliot Wave count from an expert TA website, Sive said he is not a Elliot follower so sorry Sive for posting this here, hope this can point out some view for us. From this wave count, market need to complete the wave cycle before pull back, this mean it's very unlikely for EU to drop before reaching at least 1.5

Hi Nicole,
you shouldn't apologize. This is very good that you show us alternative analysis. And it's very interesting, although I'm not a follower of EW. Still it could be very useful for others.
Besides, it does not contradict in general with our monthly view and nearest target around 1.5270. I just suspect, that market could reduce overbought degree before continuation to upside.
May be these fluctuation during 3d and 4th waves on your chart - particularly is what I expect...
 

Attachments

  • Gold.PNG
    Gold.PNG
    27.4 KB · Views: 88
  • eur_gbp_m_29_04_11.gif
    eur_gbp_m_29_04_11.gif
    23.2 KB · Views: 86
eurgbp

Mr. Morten,
Thank you for looking at my analisys! I realise now that it was lousy. My Butterfly Sell pattern does not exist. I must say though that MT4 does not offer such a clear picture.
I will try a daily and intraday analisys. Hope to do better.
Nice weekend to you!
 
Back
Top