Sive Morten
Special Consultant to the FPA
- Messages
- 18,639
Monthly
During previous week market has closed at the same level as week before – just 4 pips difference. So, there is nothing new to add to previous monthly analysis.
Monthly trend is bullish and as we’ve said in previous research recent price action is not match to market that turns in reversal. It’s more common for continuation market. Price has hit monthly overbought, 0.88 Fib resistance, and after all it just has reached nearest Fib support at 1.4140. Second, although it seems was broken, market still has not reached Confluence support and now it looks more like W&R of previous lows. This is not very typical for situations when market really intends to move lower. It looks like the downward power is not so great, at least currently. Also take a look at price action during the recent couple of months – two hammers. Sellers try to press down, but buyers return all right back, hence EUR purchases even from nearest retracement levels are significant. So, overall small signs, if we will take them together, tell that up move continuation is very probable. Furthermore, recent price action looks like bullish pennant pattern, so I suggest that it looks like bullish wedge on weekly time frame, we’ll see…
Nearest target stands at 1.5081 – just above the previous highs – this is 0.618 extension from most recent AB-CD pattern. Next area to watch is 1.5272, but potentially it could turn to butterfly “Sell” pattern. The target of this pattern is 1.27 extension at 1.6027. Also it almost coincides with 1.27 target of bullish AB-CD at 1.5925 and with 1.0 Fib extension of most recent smaller AB-CD. By the way, from classical standpoint upward move should be equal to the mast of the pennant – that is 1.5866 area.
Still, from another point of view, if you draw trend line and link lows at 1.1874 and 1.2870, then you will be able to see that this trend line nicely holds upward move. From that perspective retracement in July to 1.37 Confluence support will be normal, since it precisely will reach this trend line.
The crucial area for bullish perspectives is 1.3650 – down break of pennant and Confluence support will tell us that probably we can’t count on upward move in nearest time.
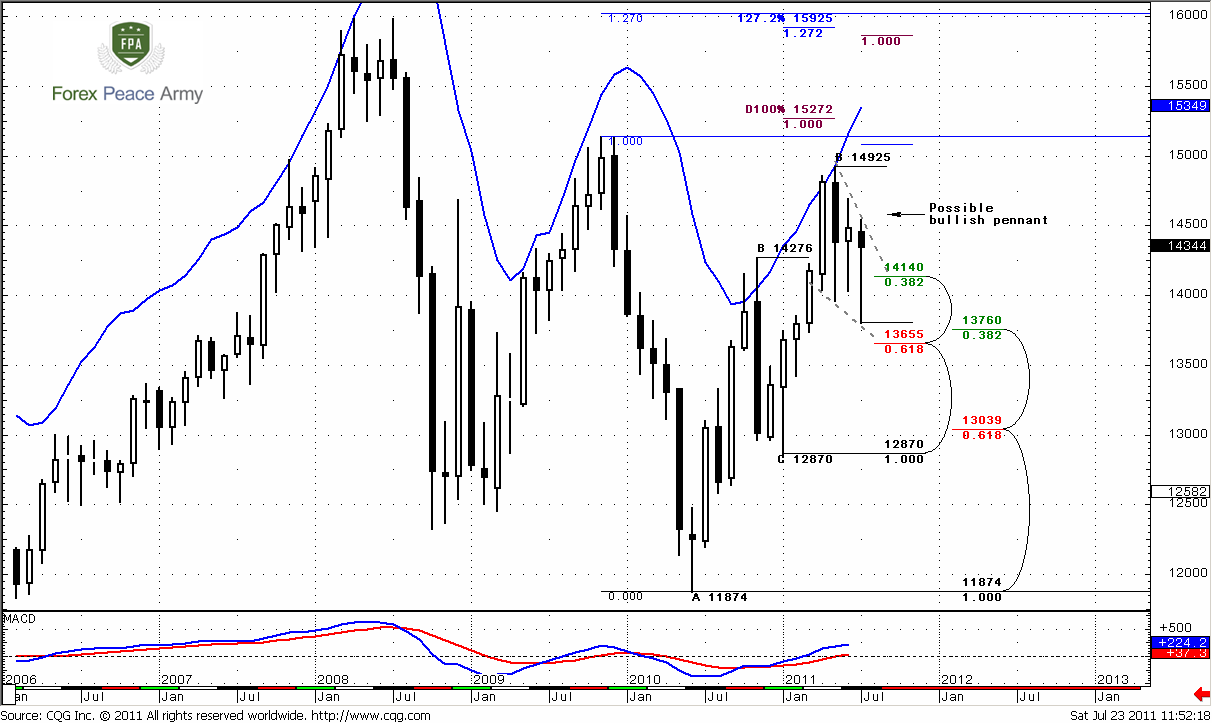
Although we’ve spoken also about 3-Drive “Sell” pattern in previous researches, here I do not mention it, since I hope that you remember it. Besides, it has almost the same potential reversal point as AB-CD pattern – 1.5250 area.
Weekly
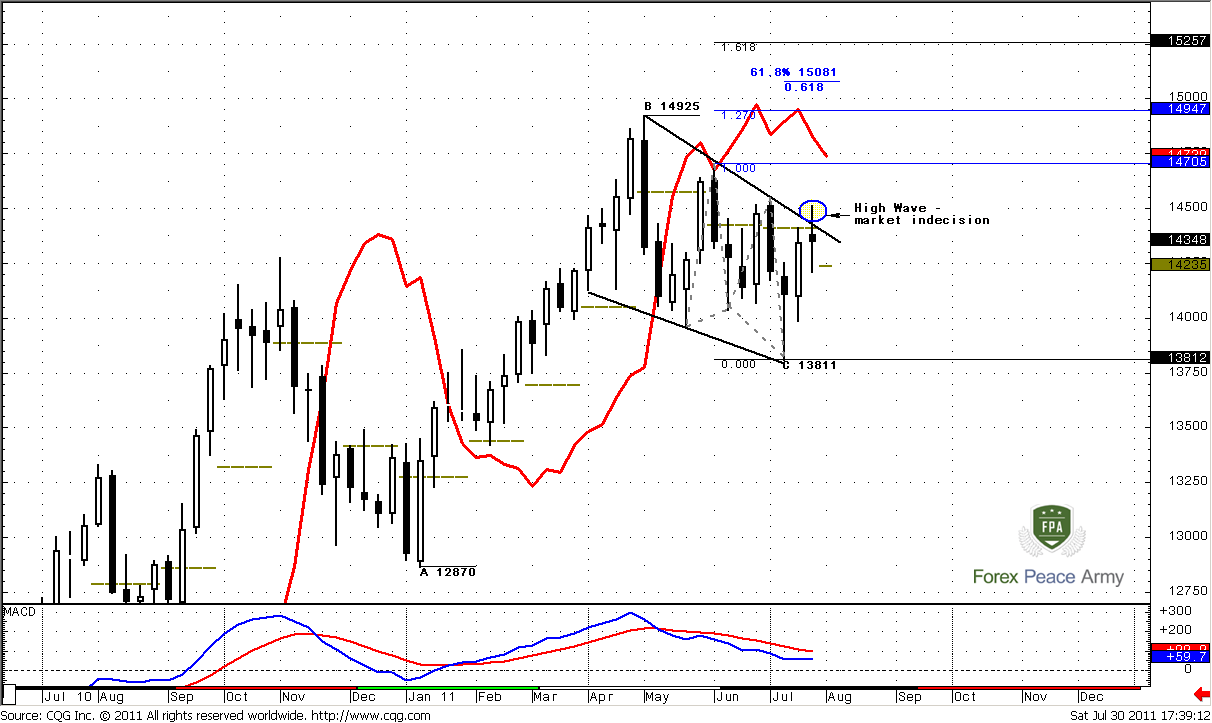
Weekly trend holds bearish. First, I just want to remind you our suspicions that we’ve discussed in previous research. If we will take a look at overall picture then we’ll see that the nature of up move and current move is different. Current action is not thrust. It looks like retracement, and probably upward move could continue. Who knows, may be current pullback is just a respect of strong support, but market has not quite reach it (monthly Confluence support). That’s why it’s hardly so. I don’t know but currently personally for me this environment looks more bullish rather than bearish. Here are some reasons for that. First, we clear see bullish dynamic pressure here. Look, market holds bear trend, but price action does not support that, market does not accelerate lower. Second, from classical perspectives, we see that bullish wedge is forming. Since on previous week market has created additional candle, so you can draw it differently – may be somebody draw it more as parallel channel – this does not change the core. This is still a consolidation but not an impulse move. Hence, this is a retracement.
Third, inside the wedge Butterfly “Buy” pattern has been formed (we discussed it previously) and now market acts as it has to – shows nice upward week after pattern has been completed. Also we can treat this recent price action as Gartley “222” “Buy”. Previous week, as we see was formed as “high wave” pattern that means indecisive market. Price has reach upper resistance of wedge and market needs more fuel to go higher. We can’t exclude move to lower border again, since we discuss H&S pattern on 4-hour chart that assumes move to 1.41 area.
Speaking about the targets – nearest one is 1.27 of Butterfly at 1. 4934, slightly about the highs. But this is the same as 1.5081 – 0.618 Fib extension from AB-CD pattern, because 1.50 is significant level, and there are a lot of stops, just above the high at 1.4925. Since target of butterfly is higher – stops will be triggered and market will easily fly to 1.50-1.51 on execution of these stops.
Second area of targets is 1.5250-1.5270. It includes 1.618 Butterfly extension target and monthly AB-CD target.
Still, currently fundamental events and data come on first stage and could change overall picture drastically. The major question is what Obama’s administration will do on Monday, since US have to pay out debt around 30 B USD. During the August US have to pay about $360 B. They have not raised debt ceil yet, so where and how they will find the money. That’s the question. Will they sell assets, or they will rise debt ceil without Congress or something? They have no time left already. So be prepare to doom and gloom on the markets.
Daily
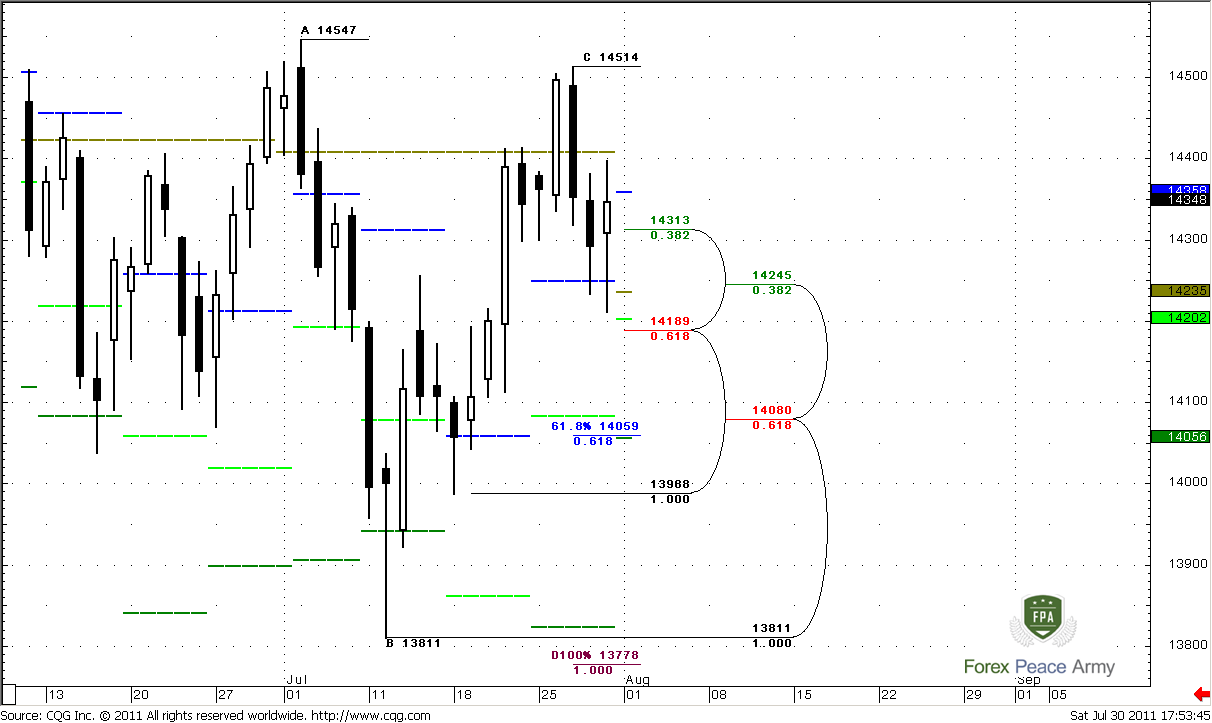
Trend is still bullish currently. Still, on previous week we’ve actively discussed bearish engulfing pattern that appeared in the beginning of the week and looks like H&S pattern on lower time frame. The target of this pattern, as we’ve said, at least theoretically is 1.41-1.4150 area, that is coincides with daily 0.618 major Fib support around 1.4080.
Still, market has bounced up from strong support area – 1.4189-1.4245 and tested it once. On next week there are two support levels will be added to it – pivot support 1 at 1.4202 and monthly pivot point at 1.4235. I can’t exclude that market could bounce from it again. That is concerning short term view.
In longer term perspectives, and from weekly/monthly point of view, this potential move down is just a retracement. Even on daily time frame we see strong acceleration to 1.45 – right to 1.0 of AB-CD pattern. Retracement to 0.618 Fib support is very typical after so strong price move. I’m telling that entire staff for purpose to warn you, that since this is a retracement it could not matches our expectation about potential target. Depth of retracements is much harder to predict, because they are very variable and unstable, compares to momentum moves. That’s why even if we wait move to 1.4150 – don’t be surprised if market retest 1.42 and go. Nevertheless don’t be afraid too much – we make researches daily and if something will go not as we assume – we will correct our trading plan.
4-hour
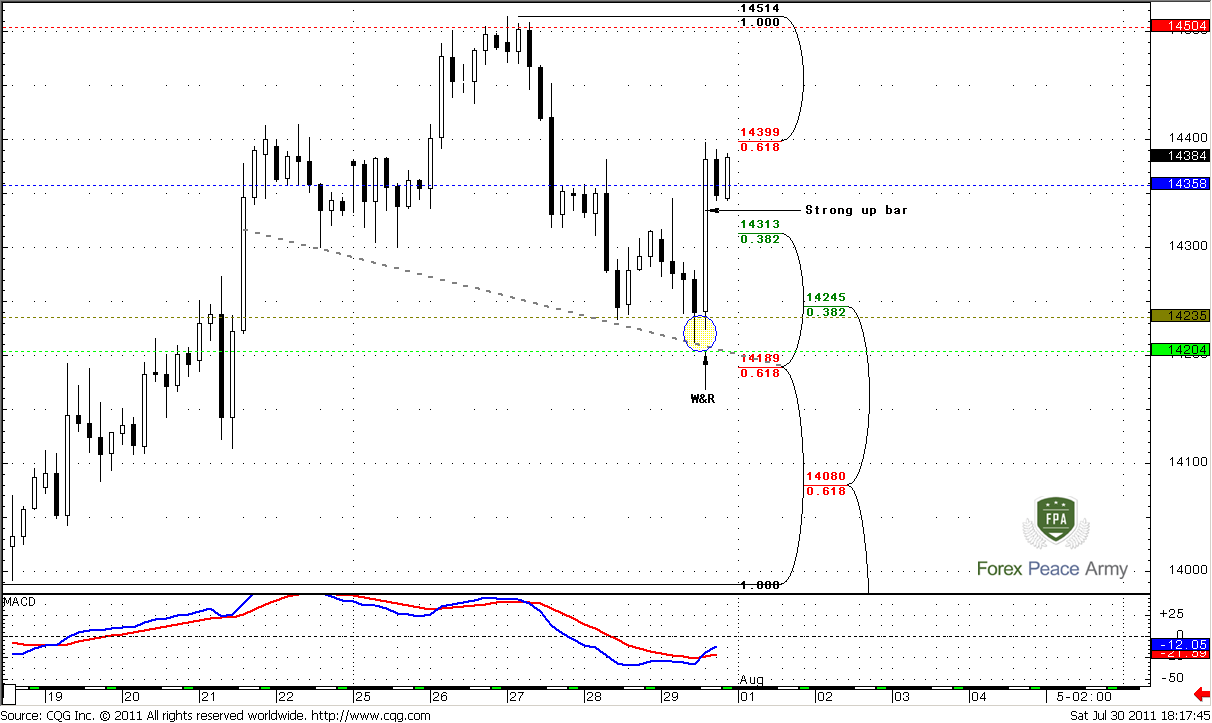
Our trading plan for Friday has worked perfectly – market has retested and cleared lows around 1.4235 and then accelerated right to 0.618 Fib resistance, an area that is typical for H&S pattern. Still, I’m worry about current price action – how could we not be deceived by it. Here is the reason for that. From surface view everything looks like in order – market has reached possible neckline and turned to forming of right shoulder by reaching precisely 0.618 resistance – just as we’ve excepted to see. But not quite. Look at price action – I didn’t want to see forming of right shoulder in such manner. See strong up candle from neckline – it is our major problem, because this kind of moves, especially on right shoulder are not common. And I’m worry that we will see continuation and failing of H&S. Currently this is just assumption, I just want to share with you with all possible scenarios. Trend has turned bullish.
Also, you have to know that market almost never shows perfect H&S patterns. On Friday I said that we can’t get H&S Failure, since we have not H&S yet. May be this AB-CD move down still was a right shoulder and we currently have H&S failure, I don’t know. What I do know is long explosives upward candle that hints on continuation of upward move further. Here is our major task for the beginning of the week – how market will act with this H&S. I have bad feelings that it will fail and market will accelerate above 1.45, of cause if nothing unexpected will be released…
1-hour
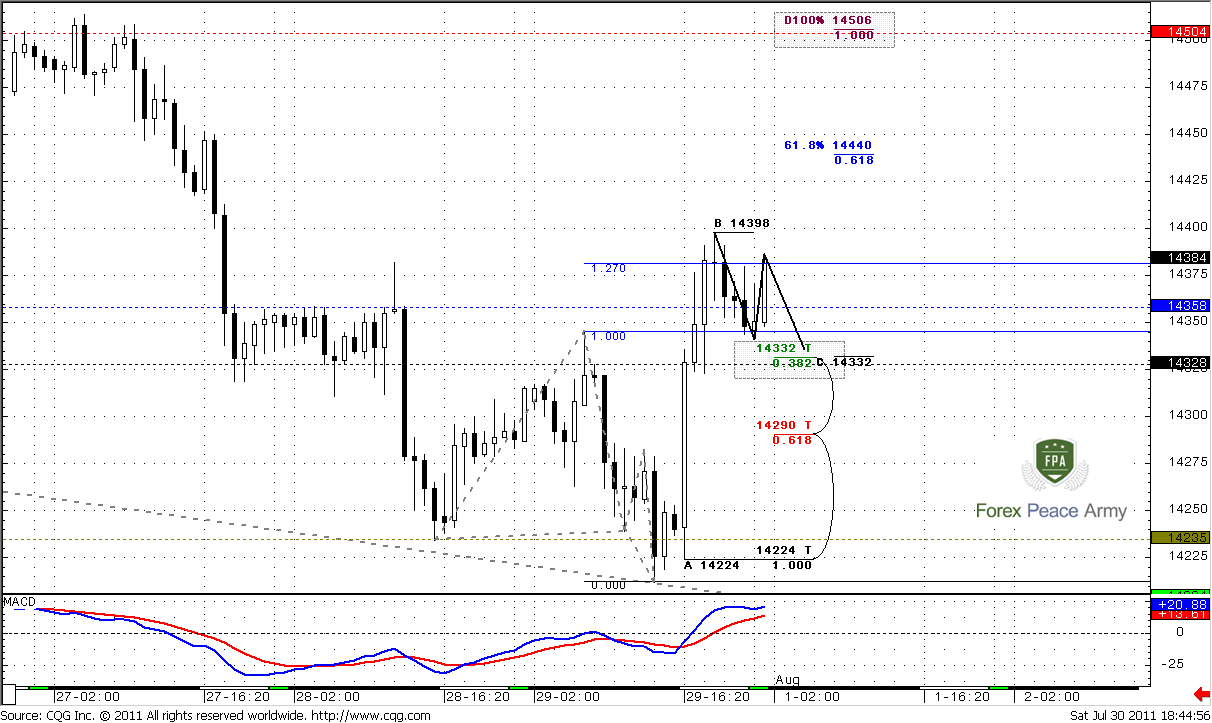
Trend is bullish. This was a butterfly “buy” that has triggered upward move right from strong support area that we’ve discussed. So, now market has reached 0.618 resistance at 1.44 and 1.27 target of butterfly – we can count on shallow retracement down. Pay attention that recent swing up is greater than last swing down – this is a sign of reversal. Still, since this is first move up after downward long-term motion – then usually market shows AB-CD retracement rather just “V”-shape retracement.
Potential target of this retracement is Agreement 1.4330 area – Fib support, pivot at 1.4358 and previous consolidation that will act as support. If market will continue move up, then next target is 1.4506 – 1.0 Fib extension of AB-CD move and pivot resistance 1.
By looking at recent price action I can’t recommend to enter short here, at least till we will see clear bearish patterns. Short-term environment tells that we probably will see further up move.
Conclusion:
Position traders:
It’s better to wait till 2d of August before open long-term positions, but currently to my mind market has more bullish signs than bearish.
Intraday and daily traders:
Although the whole previous week we’ve discussed potential H&S pattern and how it will lead us to 1.41-1.4150 area, after Friday’s price action I can’t recommend to sell blindly right from 1.44 area due to reasons that we've just discussed.
Probably it will be better even try to buy from 1.4330 with stop below 1.4290, then just sell with hope that H&S pattern still will work. This conclusion comes from uncommon for H&S price action on hourly chart and some other bullish signs. So, if you’re bullish and think that market will continue move up – watch for 1.4330 area to enter long. If you bearish and think that H&S will still work – wait for clear signals around current area. Also, keep in mind that if market will accelerate above that area at least to 0.786 resistance then probably H&S will fail, since there will not be harmony amongst the shoulders and this is the first sign about potential failing of that pattern.
Upward move is more in a row with long term analysis. Also daily, 4 hour and hourly trend are bullish currently.
The technical portion of Sive's analysis owes a great deal to Joe DiNapoli's methods, and uses a number of Joe's proprietary indicators. Please note that Sive's analysis is his own view of the market and is not endorsed by Joe DiNapoli or any related companies.
During previous week market has closed at the same level as week before – just 4 pips difference. So, there is nothing new to add to previous monthly analysis.
Monthly trend is bullish and as we’ve said in previous research recent price action is not match to market that turns in reversal. It’s more common for continuation market. Price has hit monthly overbought, 0.88 Fib resistance, and after all it just has reached nearest Fib support at 1.4140. Second, although it seems was broken, market still has not reached Confluence support and now it looks more like W&R of previous lows. This is not very typical for situations when market really intends to move lower. It looks like the downward power is not so great, at least currently. Also take a look at price action during the recent couple of months – two hammers. Sellers try to press down, but buyers return all right back, hence EUR purchases even from nearest retracement levels are significant. So, overall small signs, if we will take them together, tell that up move continuation is very probable. Furthermore, recent price action looks like bullish pennant pattern, so I suggest that it looks like bullish wedge on weekly time frame, we’ll see…
Nearest target stands at 1.5081 – just above the previous highs – this is 0.618 extension from most recent AB-CD pattern. Next area to watch is 1.5272, but potentially it could turn to butterfly “Sell” pattern. The target of this pattern is 1.27 extension at 1.6027. Also it almost coincides with 1.27 target of bullish AB-CD at 1.5925 and with 1.0 Fib extension of most recent smaller AB-CD. By the way, from classical standpoint upward move should be equal to the mast of the pennant – that is 1.5866 area.
Still, from another point of view, if you draw trend line and link lows at 1.1874 and 1.2870, then you will be able to see that this trend line nicely holds upward move. From that perspective retracement in July to 1.37 Confluence support will be normal, since it precisely will reach this trend line.
The crucial area for bullish perspectives is 1.3650 – down break of pennant and Confluence support will tell us that probably we can’t count on upward move in nearest time.
Although we’ve spoken also about 3-Drive “Sell” pattern in previous researches, here I do not mention it, since I hope that you remember it. Besides, it has almost the same potential reversal point as AB-CD pattern – 1.5250 area.
Weekly
Weekly trend holds bearish. First, I just want to remind you our suspicions that we’ve discussed in previous research. If we will take a look at overall picture then we’ll see that the nature of up move and current move is different. Current action is not thrust. It looks like retracement, and probably upward move could continue. Who knows, may be current pullback is just a respect of strong support, but market has not quite reach it (monthly Confluence support). That’s why it’s hardly so. I don’t know but currently personally for me this environment looks more bullish rather than bearish. Here are some reasons for that. First, we clear see bullish dynamic pressure here. Look, market holds bear trend, but price action does not support that, market does not accelerate lower. Second, from classical perspectives, we see that bullish wedge is forming. Since on previous week market has created additional candle, so you can draw it differently – may be somebody draw it more as parallel channel – this does not change the core. This is still a consolidation but not an impulse move. Hence, this is a retracement.
Third, inside the wedge Butterfly “Buy” pattern has been formed (we discussed it previously) and now market acts as it has to – shows nice upward week after pattern has been completed. Also we can treat this recent price action as Gartley “222” “Buy”. Previous week, as we see was formed as “high wave” pattern that means indecisive market. Price has reach upper resistance of wedge and market needs more fuel to go higher. We can’t exclude move to lower border again, since we discuss H&S pattern on 4-hour chart that assumes move to 1.41 area.
Speaking about the targets – nearest one is 1.27 of Butterfly at 1. 4934, slightly about the highs. But this is the same as 1.5081 – 0.618 Fib extension from AB-CD pattern, because 1.50 is significant level, and there are a lot of stops, just above the high at 1.4925. Since target of butterfly is higher – stops will be triggered and market will easily fly to 1.50-1.51 on execution of these stops.
Second area of targets is 1.5250-1.5270. It includes 1.618 Butterfly extension target and monthly AB-CD target.
Still, currently fundamental events and data come on first stage and could change overall picture drastically. The major question is what Obama’s administration will do on Monday, since US have to pay out debt around 30 B USD. During the August US have to pay about $360 B. They have not raised debt ceil yet, so where and how they will find the money. That’s the question. Will they sell assets, or they will rise debt ceil without Congress or something? They have no time left already. So be prepare to doom and gloom on the markets.
Daily
Trend is still bullish currently. Still, on previous week we’ve actively discussed bearish engulfing pattern that appeared in the beginning of the week and looks like H&S pattern on lower time frame. The target of this pattern, as we’ve said, at least theoretically is 1.41-1.4150 area, that is coincides with daily 0.618 major Fib support around 1.4080.
Still, market has bounced up from strong support area – 1.4189-1.4245 and tested it once. On next week there are two support levels will be added to it – pivot support 1 at 1.4202 and monthly pivot point at 1.4235. I can’t exclude that market could bounce from it again. That is concerning short term view.
In longer term perspectives, and from weekly/monthly point of view, this potential move down is just a retracement. Even on daily time frame we see strong acceleration to 1.45 – right to 1.0 of AB-CD pattern. Retracement to 0.618 Fib support is very typical after so strong price move. I’m telling that entire staff for purpose to warn you, that since this is a retracement it could not matches our expectation about potential target. Depth of retracements is much harder to predict, because they are very variable and unstable, compares to momentum moves. That’s why even if we wait move to 1.4150 – don’t be surprised if market retest 1.42 and go. Nevertheless don’t be afraid too much – we make researches daily and if something will go not as we assume – we will correct our trading plan.
4-hour
Our trading plan for Friday has worked perfectly – market has retested and cleared lows around 1.4235 and then accelerated right to 0.618 Fib resistance, an area that is typical for H&S pattern. Still, I’m worry about current price action – how could we not be deceived by it. Here is the reason for that. From surface view everything looks like in order – market has reached possible neckline and turned to forming of right shoulder by reaching precisely 0.618 resistance – just as we’ve excepted to see. But not quite. Look at price action – I didn’t want to see forming of right shoulder in such manner. See strong up candle from neckline – it is our major problem, because this kind of moves, especially on right shoulder are not common. And I’m worry that we will see continuation and failing of H&S. Currently this is just assumption, I just want to share with you with all possible scenarios. Trend has turned bullish.
Also, you have to know that market almost never shows perfect H&S patterns. On Friday I said that we can’t get H&S Failure, since we have not H&S yet. May be this AB-CD move down still was a right shoulder and we currently have H&S failure, I don’t know. What I do know is long explosives upward candle that hints on continuation of upward move further. Here is our major task for the beginning of the week – how market will act with this H&S. I have bad feelings that it will fail and market will accelerate above 1.45, of cause if nothing unexpected will be released…
1-hour
Trend is bullish. This was a butterfly “buy” that has triggered upward move right from strong support area that we’ve discussed. So, now market has reached 0.618 resistance at 1.44 and 1.27 target of butterfly – we can count on shallow retracement down. Pay attention that recent swing up is greater than last swing down – this is a sign of reversal. Still, since this is first move up after downward long-term motion – then usually market shows AB-CD retracement rather just “V”-shape retracement.
Potential target of this retracement is Agreement 1.4330 area – Fib support, pivot at 1.4358 and previous consolidation that will act as support. If market will continue move up, then next target is 1.4506 – 1.0 Fib extension of AB-CD move and pivot resistance 1.
By looking at recent price action I can’t recommend to enter short here, at least till we will see clear bearish patterns. Short-term environment tells that we probably will see further up move.
Conclusion:
Position traders:
It’s better to wait till 2d of August before open long-term positions, but currently to my mind market has more bullish signs than bearish.
Intraday and daily traders:
Although the whole previous week we’ve discussed potential H&S pattern and how it will lead us to 1.41-1.4150 area, after Friday’s price action I can’t recommend to sell blindly right from 1.44 area due to reasons that we've just discussed.
Probably it will be better even try to buy from 1.4330 with stop below 1.4290, then just sell with hope that H&S pattern still will work. This conclusion comes from uncommon for H&S price action on hourly chart and some other bullish signs. So, if you’re bullish and think that market will continue move up – watch for 1.4330 area to enter long. If you bearish and think that H&S will still work – wait for clear signals around current area. Also, keep in mind that if market will accelerate above that area at least to 0.786 resistance then probably H&S will fail, since there will not be harmony amongst the shoulders and this is the first sign about potential failing of that pattern.
Upward move is more in a row with long term analysis. Also daily, 4 hour and hourly trend are bullish currently.
The technical portion of Sive's analysis owes a great deal to Joe DiNapoli's methods, and uses a number of Joe's proprietary indicators. Please note that Sive's analysis is his own view of the market and is not endorsed by Joe DiNapoli or any related companies.