Missmatch with my the ABCD points on the 04-hours analysis
Hello Mr Sive. I'm giving my first steps on Forex Analysis and I'm lucky to have your daily emails. Thanks so much. My questions are related to the 04-hours analysis, here the explanation of my doubts:
On the 04-hour analysis your
1st ABCD points
A 1.4514
B 1.4212
C 1.4438
2nd ABCD points
A 1.4438 (question 1, is my first time trying to understand your analysis, i guess A point is 1.4438 because your software doesn't allow you to put two letters on the same point, is it correct?)
B 1.4131
C 1.4355
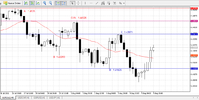
My ABC points are shown on the first picture (ABC - ABC chart), I'm using MetaTrader 5 (I used MT4 too and showed me the same points):
1st ABCD points
A 1.45350
B 1.42293
C 1.44526
2nd ABCD points
A 1.44526
B 1.41425
C 1.43671
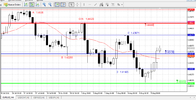
Then, I placed on the Second picture (2nd Chart) your 1.44440 line (red thick line) (question 2 is this a resistance line?), the 1.4048 support (green thick line) and the blue thick line with 1.4243 (question 3, What is this line? how you calculate it?)
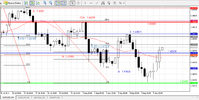
Then on the third picture (3rd Chart) I drawn the Fib calculation (MT5 tool) from 1.4048 (0%) to 1st A point = 1.4535 (100%) and gives me 1.43490 as 0.618.
Then using the 2nd A point = 1.44526 (100%) and gives me 1.42978 as 0.618.
question 4: do you use a different software than MT5/MT4? can we know which software is the one you use? is that why we have different numbers as ABCD points? How much different can be the analysis with a difference of 10 - 20 pips on the calculation of the Fibs Levels because of the support and resistance variation?
Thanks so much Mr Sive
Hello Mr Sive. I'm giving my first steps on Forex Analysis and I'm lucky to have your daily emails. Thanks so much. My questions are related to the 04-hours analysis, here the explanation of my doubts:
On the 04-hour analysis your
1st ABCD points
A 1.4514
B 1.4212
C 1.4438
2nd ABCD points
A 1.4438 (question 1, is my first time trying to understand your analysis, i guess A point is 1.4438 because your software doesn't allow you to put two letters on the same point, is it correct?)
B 1.4131
C 1.4355
My ABC points are shown on the first picture (ABC - ABC chart), I'm using MetaTrader 5 (I used MT4 too and showed me the same points):
1st ABCD points
A 1.45350
B 1.42293
C 1.44526
2nd ABCD points
A 1.44526
B 1.41425
C 1.43671
Then, I placed on the Second picture (2nd Chart) your 1.44440 line (red thick line) (question 2 is this a resistance line?), the 1.4048 support (green thick line) and the blue thick line with 1.4243 (question 3, What is this line? how you calculate it?)
Then on the third picture (3rd Chart) I drawn the Fib calculation (MT5 tool) from 1.4048 (0%) to 1st A point = 1.4535 (100%) and gives me 1.43490 as 0.618.
Then using the 2nd A point = 1.44526 (100%) and gives me 1.42978 as 0.618.
question 4: do you use a different software than MT5/MT4? can we know which software is the one you use? is that why we have different numbers as ABCD points? How much different can be the analysis with a difference of 10 - 20 pips on the calculation of the Fibs Levels because of the support and resistance variation?
Thanks so much Mr Sive