Hi Sive,
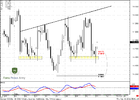
I am sorry for my misspell. It will be descending triangle.
You can see more about this pattern in this link..
Descending Triangle Definition
thanks..
Hi Hasan,
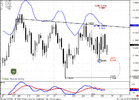
well, for me it looks more like a bullish wedge. This is one reason among the others, why I think that market is more bullish rather than bearish in medium term.
We've discussed that in weekly researches.
hye sive..
thanks for your great analysis...
in my opinion on H1 chart it seems like H&S..
do you agree with that?
now im little bit confused.. because on H4 also got small H&S..
so if we still hold bullish, where should we enter for buy?
Well, we had have to enter long around 1.4150, as we've pointed in our trading plan. As later you enter (closer to the neck line) as more risk you will have to take, since the failure point of H&S pattern will be farer.
hey sive.
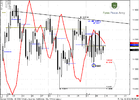
Hope your well, we saw some major EUR sell off today, in the US session. quicker than i have ever seen before and certainly quicker than the move up yesterday after the FOMC meeting.
The down move was somewhat predictable as there was double top, stochastic overbought and bearish divergence on the 1 hour intra day chart.
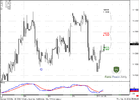
However, my question to you is, the current move down has found some support at the 50%, fib level from the BIG H&S, the move down is currently around 14180, around the 50% retracement level, from the head to the right shoulder.
Technically, in my opinion, because of such market conditions, i think that H&S, is still viable and tradable. market has not taken out the lows around 14070 and even due to FOMC, people are going to buy EURO for carry trade purposes.
What would you say?
I would also be thankful, if you provide me with the fundamental side of the story.
Thank You
Yousuf.....
Hi Yousuf,
It's a bit difficult to understand what are you talking about, but if you'are speaking about reverse H&S on 4-hour chart, then, probably it still could work, although I do not like it as strong as some days before.
It's better if you will attach chart for better look at your analysis.
Hi Sive, I think you should change your long term view on EURUSD, outside there every other professional organization have the same bearish view on this pair. I can't say who is right or wrong and I don't follow them blindly but their analysis worth considering
First is the analysis from MIGBANK , click this link to open their pdf technical analysis
Secondly is the Elliott Wave count from Capital Management, (many years experience trading FX ) I attach the screenshot for daily and weekly below
Well, Nicole,
Probably they will be right and I will be wrong. I'm not flatter with my own quality, who knows.
But my approach to market is a bit different - they draw the whole picture, but I move gradually step by step. May be we will come to the same conclusion.
I try to trade, say, what I see on the market. Currently I see some kind of H&S pattern that still holds. If market will break the low of it's right shoulder - then I also will say that we have to be aware of downmove. But currently I can't say that, because there are no reasons yet.
Morning Sive!!!
Recently I've finished reading "trade what you see" by Jouflas and I'm training my skill and my eye on pattern recognition.
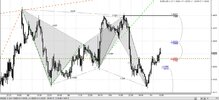
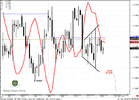
According to this EUR/USD 30-min chart analyzed by me of recent price action is it ok to say that first we had a "Gartley 222" sell with a point D in the same place as the right top of a "Double top pattern", both of them giving as a context of downward price movement followed by a butterfly buy pattern?
to make the question easier..are these patterns ok????????
I am now reading "Trading in the zone" by Mark Douglas.
Ok mate, I hope you have a good day, thanks for everything.
Hi Damian
Speaking with the letter of the book, you have to be careful to enter short, since we have explosive bar up right to 1.0 target. And as a rule it leads to further continuation up.
With this rearview, probably you're right, but this also was a butterfly "Sell" pattern, it just has not reached the target.
Double top seems perfect.
So, conclusion - yes, we can treat it like that, but I probably has not entered with it, taking into account all moments that I've described.
BTW, here you can see, what really could happen and how all these patterns could co-exist - as you've asked yesterday.