Sive Morten
Special Consultant to the FPA
- Messages
- 18,648
Monthly
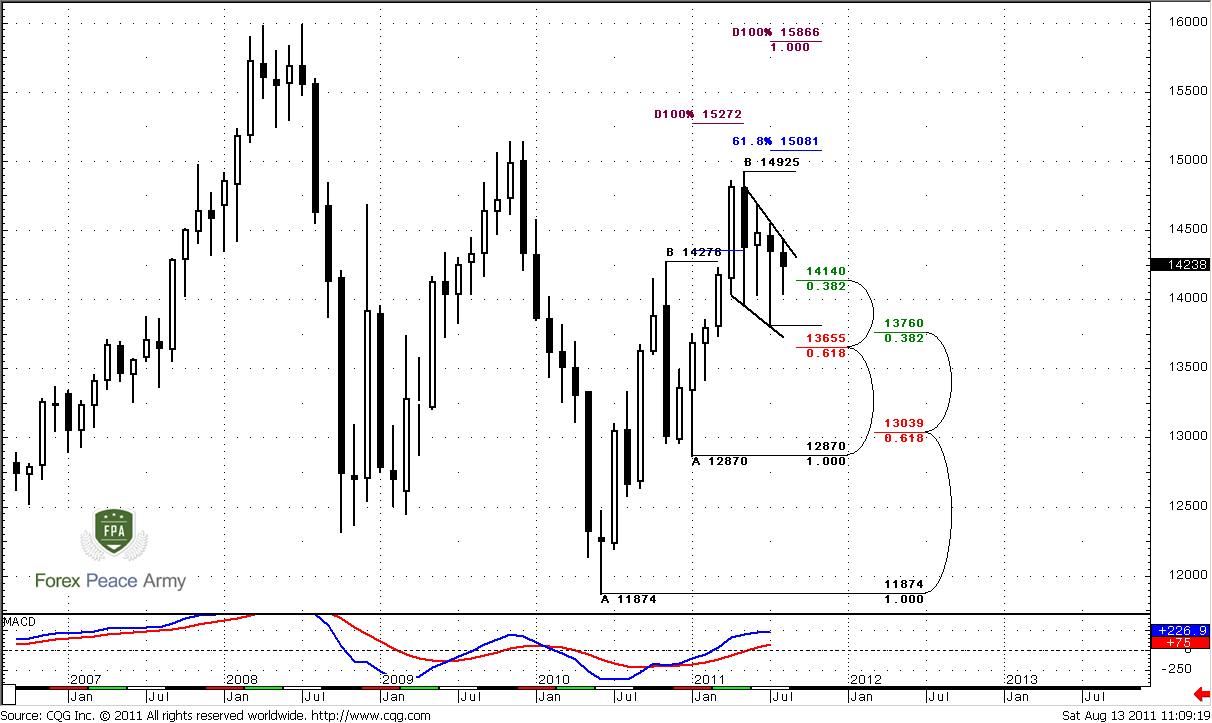
As we’ve said previously current trading environment on monthly time frame is a bright example of indecisive sentiment of market participants. Since as US as EU hit market with turmoil, traders just can’t decide which problems are worse. Trading range on monthly chart has contracted significantly, June was inside month and August has all chances to become inside one also.
Monthly trend remains bullish so as price action. Recent AB-CD pattern develops strictly as in book – market has hit 0.618 Fib extension target and monthly overbought and turned to retracement. But this retracement is very shallow – as it has to be. Market could not even reach Confluence support and holds above nearest Fib support 1.4140 - it looks more like W&R of previous lows on lower time frames. Furthermore, price action shows strong purchases by candles’ long tales during recent 4 months. Bullish pennant is forming currently here. Market has corrected overbought and reached the middle between the blue bands of oscillator predictor.
So, as we’ve said in previous research recent price action is not match to market that turns in reversal. It’s more common for continuation market. Although overall small signs, if we will take them together, tell that up move continuation is very probable, I better treat current price action as “indecision”. May be it looks like bullish pennant and so on, but this is not just retracement – inside months and choppy behavior on daily time frame tell that although investors are not ready to sell, but they are not sure that EUR is better either. I dare to suggest that when market will get any EUR supportive news or something – price will continue move higher.
Nearest target stands at 1.5081 – just above the previous highs – this is 0.618 extension from most recent AB-CD pattern. Next area to watch is 1.5272, but potentially it could turn to butterfly “Sell” pattern. The target of this pattern is 1.27 extension at 1.6027. Also it almost coincides with 1.27 target of bullish AB-CD at 1.5925 and with 1.0 Fib extension of most recent smaller AB-CD. By the way, from classical standpoint upward move should be equal to the mast of the pennant – that is 1.5866 area.
The crucial area for bullish perspectives is 1.3650 – down break of pennant and Confluence support will tell us that probably we can’t count on upward move in nearest time.
Weekly
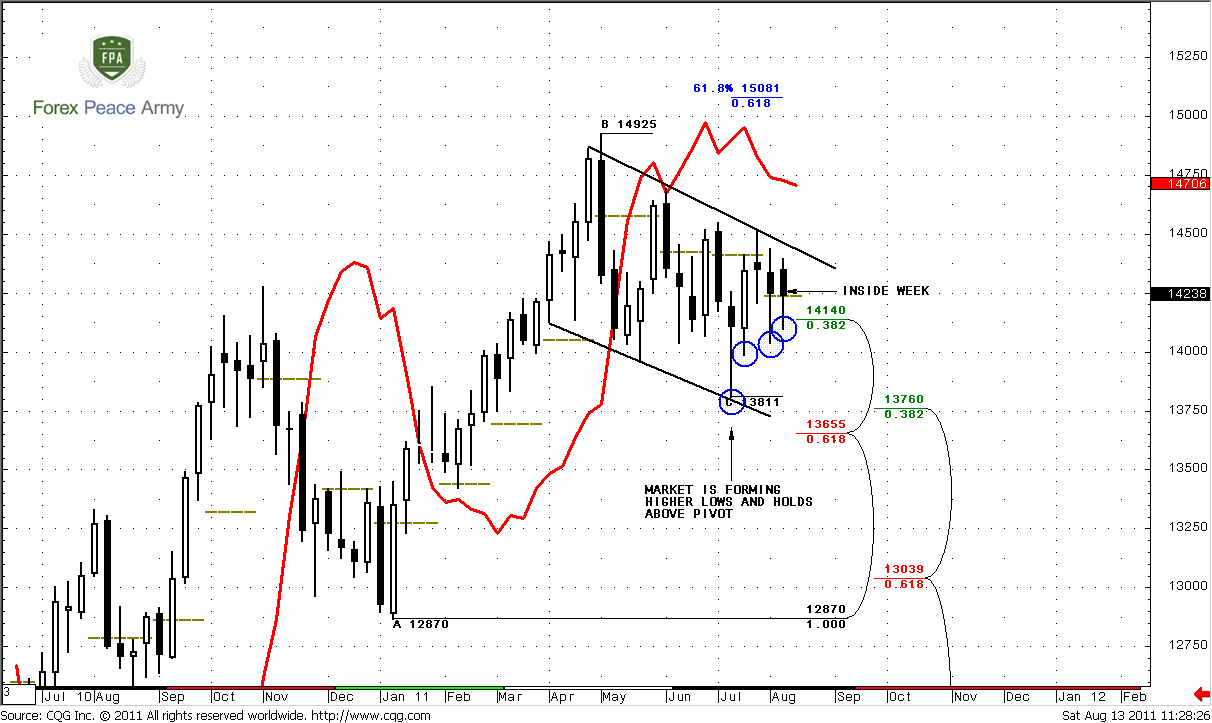
Weekly trend holds bearish. First, I just want to remind you our suspicions that we’ve discussed in previous research. If we will take a look at overall picture then we’ll see that the nature of up move and current move is different. Current action is not thrust. It looks like retracement, and probably upward move could continue. Who knows, may be current pullback is just a respect of strong support, but market has not quite reach it (monthly Confluence support). That’s why it’s hardly so. I don’t know but currently personally for me this environment looks more bullish rather than bearish. Here are some reasons for that. First, we clear see bullish dynamic pressure here. Look, market holds bear trend, but price action does not support that, market does not accelerate lower. Second, from classical perspectives, we see that bullish wedge or flag is forming. This is a consolidation but not an impulse move. Hence, this is a retracement.
Also we can treat this recent price action as Gartley “222” “Buy”.
There is couple of new moments that have appeared during recent week. First, closed week was an inside week – energy in market has increased. Second, take a look at recent price action – market is forming higher lows with bear trend. This is a confirmation of dynamic pressure. Now we have to keep an eye on that – will this tendency continue or not. That’s important.
And finally, pay attention to monthly pivot point. Do you see something different with it? Right, August is a first month in current consolidation, when price holds above the pivot for second consecutive week.
Also if you switch on your imagination you can find Butterfly “sell” pattern that is forming currently here…
Speaking about the targets – nearest one is 1.5081 – 0.618 Fib extension from AB-CD pattern, that is also a weekly overbought. Although dynamic pressure minimum target is clearing out the highs at 1.4925 – there are a lot of stops just above it. So, since they will be triggered, market definitely will accelerate further. Second area of targets is 1.5250-1.5270 - monthly AB-CD target.
Daily
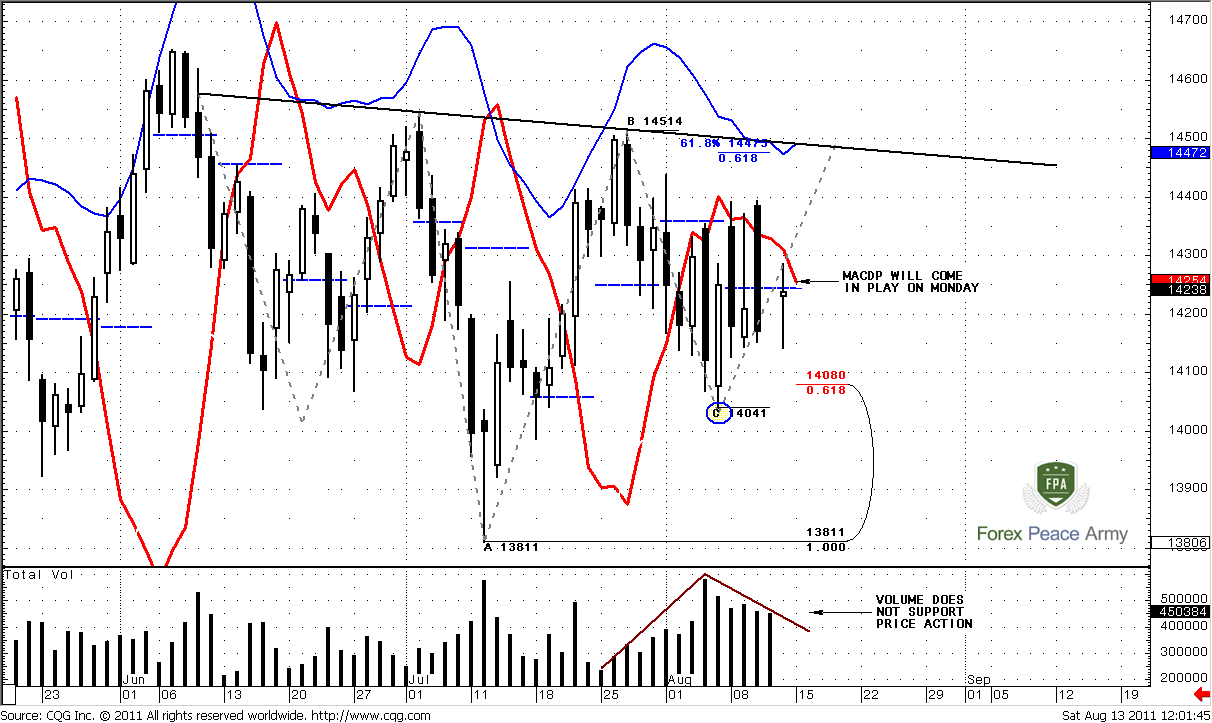
Here we come to most difficult time frame for analysis on coming week. Let’s start from our H&S pattern that we’ve discussed on previous week first. Even with this pattern there are some worries signs exist. On a first view – everything seems to be in order, but if you will take a close look – you’ll see. First, trading volume does not support typical H&S behavior. Particularly, during right shoulder, when market moves up, trading volume should increase. Here we do not see it. Vice versa – trading volume decreases during recent week, when market has tried to move higher. Second, market has not been able to close above weekly pivot. This is curious a bit, since during right shoulder buyers should dominate and market usually moves higher easier. That has not happened. Third, look at price action during the last week – it’s not very common for H&S – market just could not choose the direction, it has shown very volatile days with closes preferably in the middle of the trading days. Highs and lows stand at the same distance from weekly pivot point – so, market is more indecision rather than in bullish momentum. Additional confirmation to that is “high wave” on Friday.
Still, some bullish sighs hold on the market. This is a bullish dynamic pressure. Market is forming higher lows and MACDP will come in play on Monday, I suppose. This will be important moment – depending on what we will see, we will make judgment about further price action. If it will be stop grabber, then probably perspective of H&S will become blurrier. Crucial point of this pattern stands the same – 1.4041.
#1
And now we turn to most interest moment of daily time frame, why I’ve said that it’s very difficult to analyze it. Let’s decompose our H&S pattern so that you can clearer see different scenarios and why it’s very hard to predict perspective.
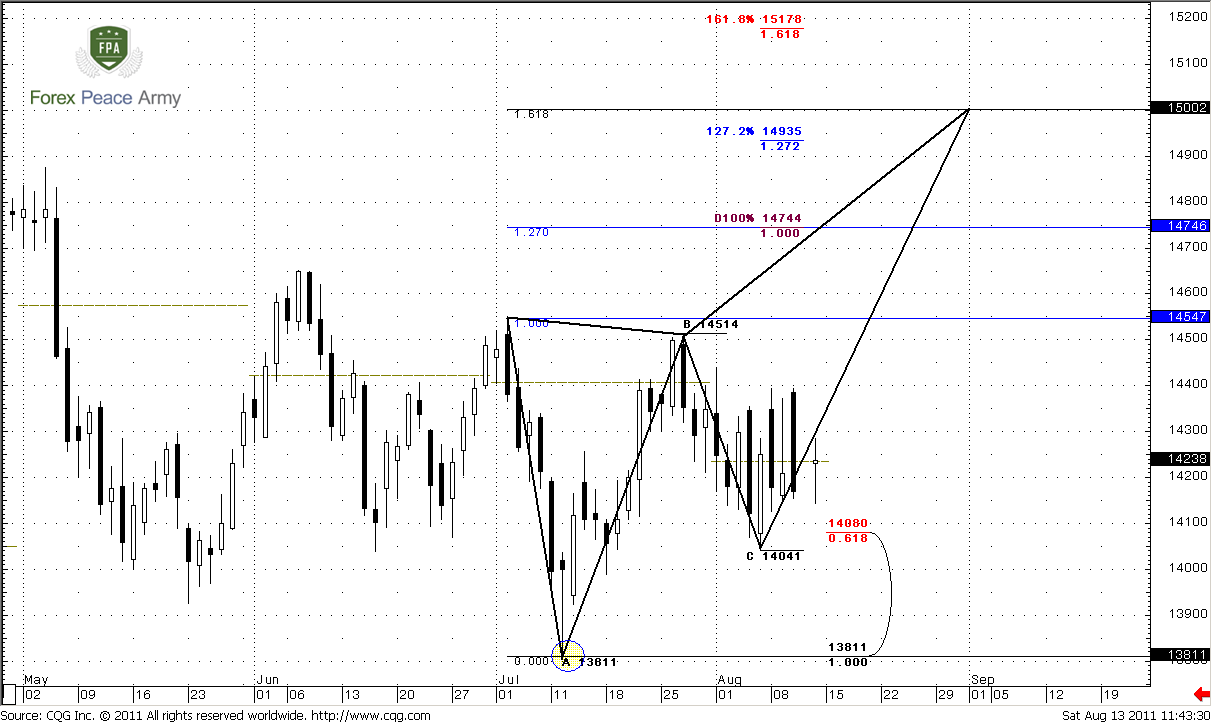
First scenario stands it a row with weekly expectations. This is Butterfly that I’ve asked you to imagine on weekly chart. Since market has shown only 0.618 Fib retracement, it has the chances to reach 1.618 target at 1.50. Now take a look at weekly chart again – see the target at 1.5081? This is also weekly overbought. So these two targets coincide in tight range. The failure point is low at 1.3811.
#2
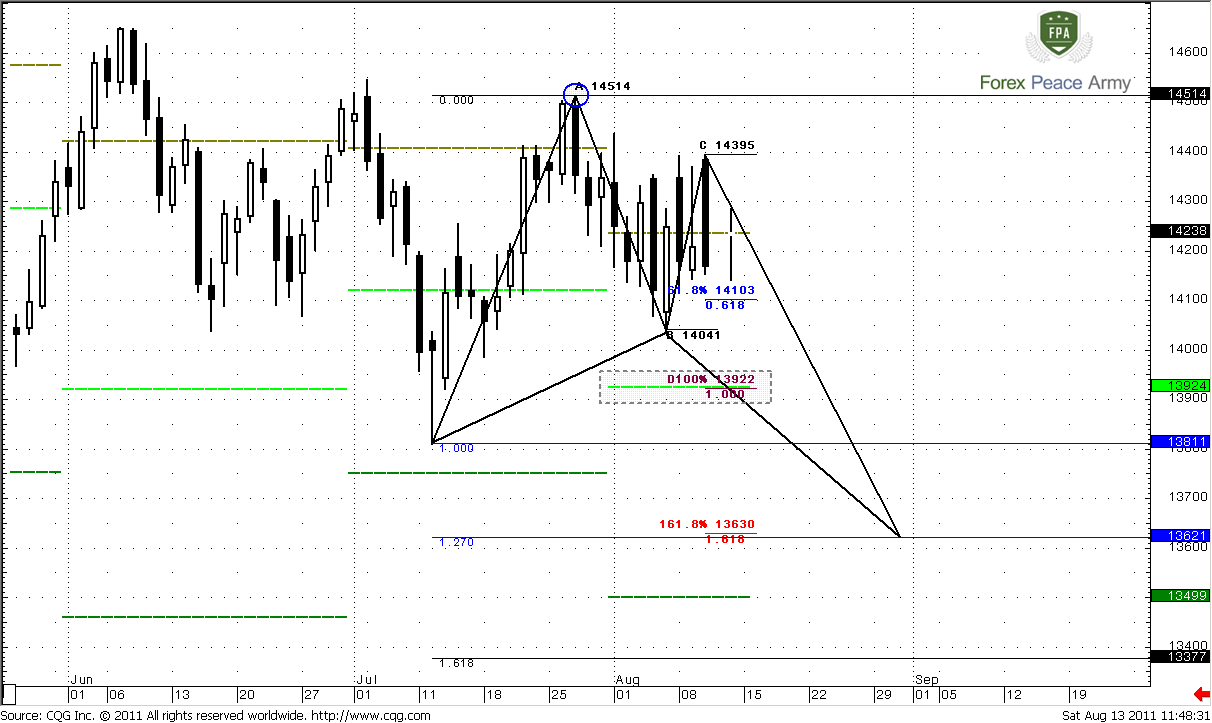
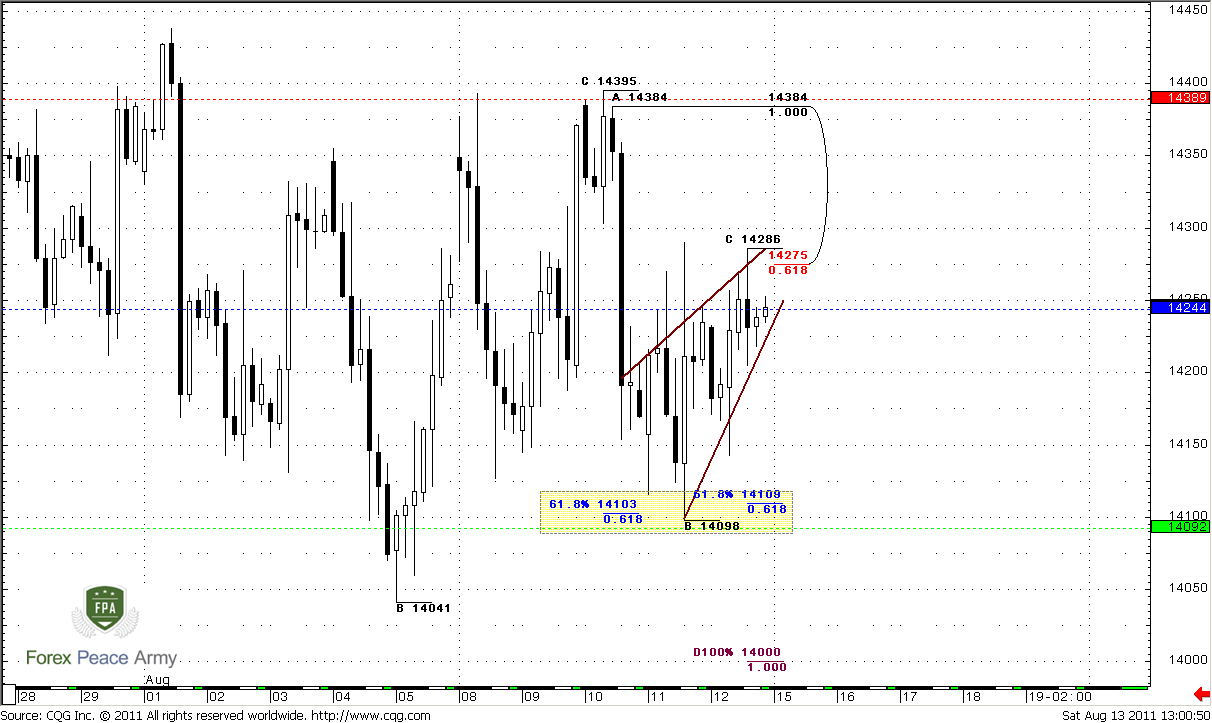
And here is opposite view for you also - Butterfly “Buy” pattern with downward AB-CD. Although it has opposite direction, it also has some significant moment to previous butterfly and H&S pattern. First, take a look at AB-CD pattern. Nearest 0.618 target stands at 1.4103 – even if market will reach it, it does not cancel H&S and if market will start up move right from that area could lead to another smaller butterfly “sell” – try to find it by yourself.
Second, pay attention to strong support at 1.3922 area – this is AB=CD target and pivot support 1. Although reaching of that area will cancel H&S – it will not cancel butterfly “Buy” pattern.
Potential target of this pattern is 1.3620-1.3630 area – agreement of 1.618 AB-CD target and 1.27 butterfly target. The failure point is high at 1.4514.
#3
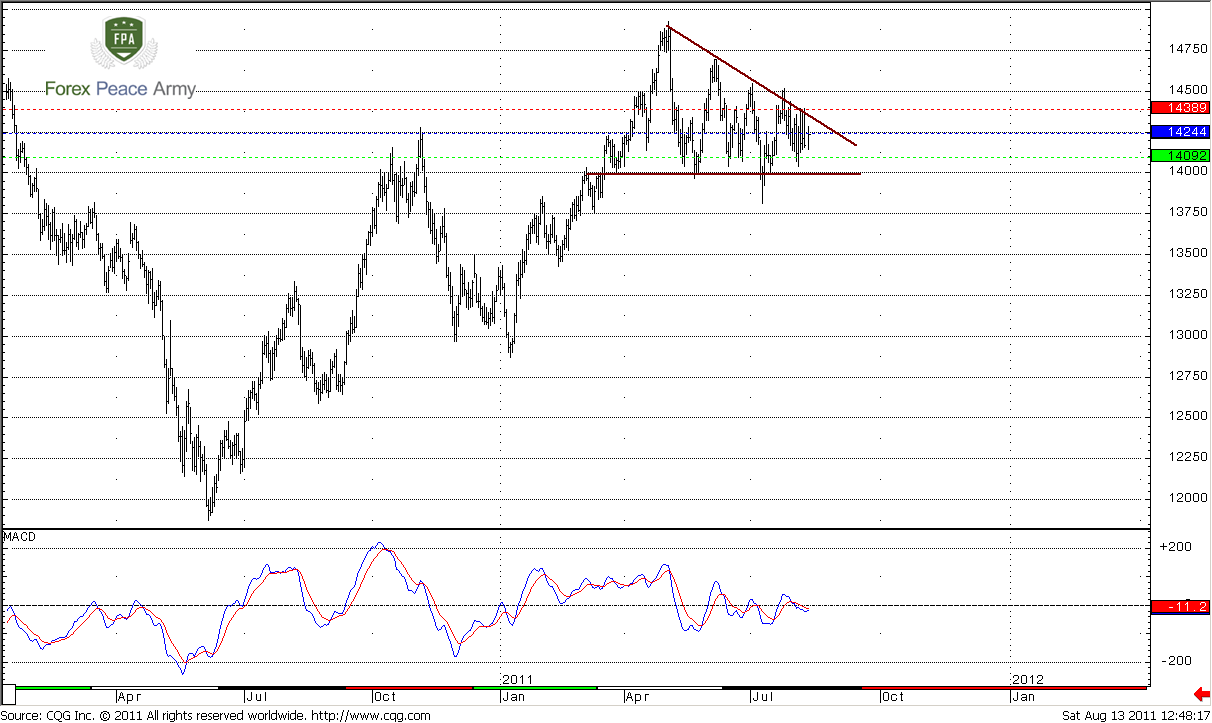
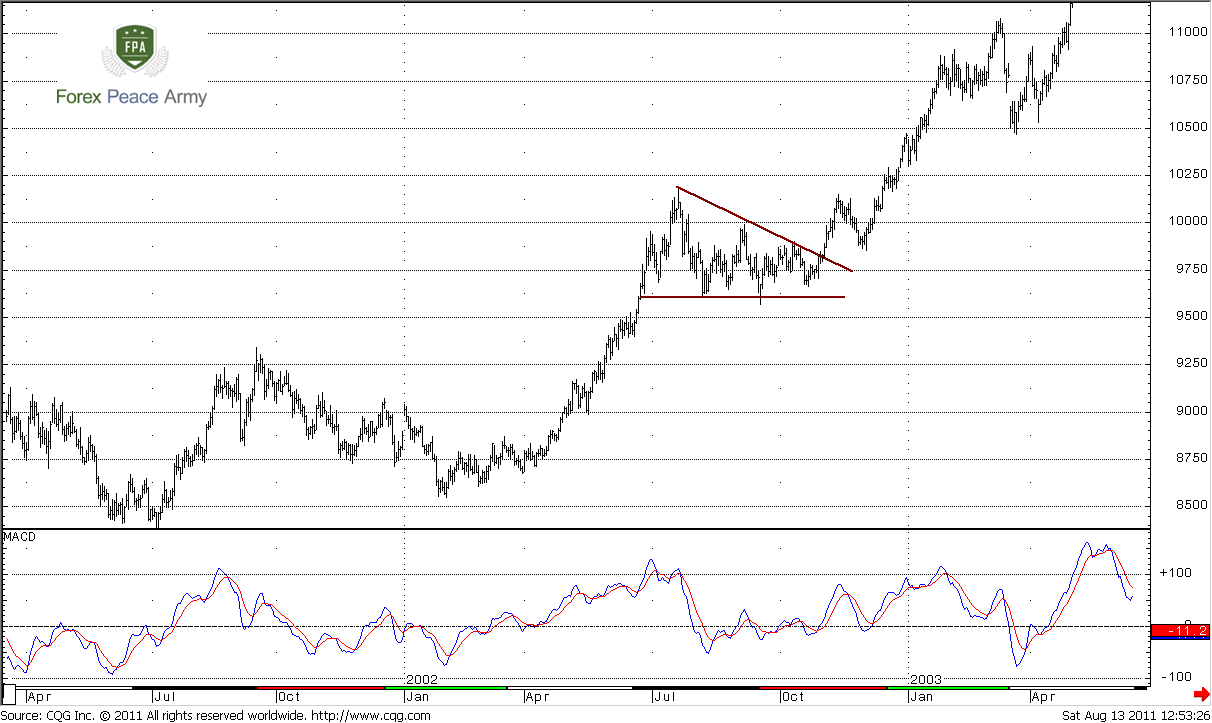
And to finally confuse you – here is contracted daily chart. When I saw such triangle on 2002, market has continued move higher… It also has needed some time to think, since it just has passed through parity of EUR/USD. So as in 2002 as now is crucial moment on the market, but of cause it does not mean that it will 100% happen again.
#4
#5 2002
4-hour
On 4-hour chart I see bearish pattern. Market could not pass through 0.618 resistance and 0.5 resistance of nasty black candle, so it usually leads to further down move. The target of that bearish wedge coincides with both AB-CD o.618 targets and pivot support 1 - 1.41-1.4110.
Conclusion:
Safe way to trade current market is to wait breakout of crucial areas – 1.4514 or 1.3811. Still, if you want to make intraday trades – take profit fast and appoint near targets inside huge triangle on daily time frame.
Now market has contradictive signs at all time frames. In such circumstances I is better to stay flat and wait clear signals or, as we’ve said – trade intraday with tight targets and smaller volume.
The technical portion of Sive's analysis owes a great deal to Joe DiNapoli's methods, and uses a number of Joe's proprietary indicators. Please note that Sive's analysis is his own view of the market and is not endorsed by Joe DiNapoli or any related companies.
As we’ve said previously current trading environment on monthly time frame is a bright example of indecisive sentiment of market participants. Since as US as EU hit market with turmoil, traders just can’t decide which problems are worse. Trading range on monthly chart has contracted significantly, June was inside month and August has all chances to become inside one also.
Monthly trend remains bullish so as price action. Recent AB-CD pattern develops strictly as in book – market has hit 0.618 Fib extension target and monthly overbought and turned to retracement. But this retracement is very shallow – as it has to be. Market could not even reach Confluence support and holds above nearest Fib support 1.4140 - it looks more like W&R of previous lows on lower time frames. Furthermore, price action shows strong purchases by candles’ long tales during recent 4 months. Bullish pennant is forming currently here. Market has corrected overbought and reached the middle between the blue bands of oscillator predictor.
So, as we’ve said in previous research recent price action is not match to market that turns in reversal. It’s more common for continuation market. Although overall small signs, if we will take them together, tell that up move continuation is very probable, I better treat current price action as “indecision”. May be it looks like bullish pennant and so on, but this is not just retracement – inside months and choppy behavior on daily time frame tell that although investors are not ready to sell, but they are not sure that EUR is better either. I dare to suggest that when market will get any EUR supportive news or something – price will continue move higher.
Nearest target stands at 1.5081 – just above the previous highs – this is 0.618 extension from most recent AB-CD pattern. Next area to watch is 1.5272, but potentially it could turn to butterfly “Sell” pattern. The target of this pattern is 1.27 extension at 1.6027. Also it almost coincides with 1.27 target of bullish AB-CD at 1.5925 and with 1.0 Fib extension of most recent smaller AB-CD. By the way, from classical standpoint upward move should be equal to the mast of the pennant – that is 1.5866 area.
The crucial area for bullish perspectives is 1.3650 – down break of pennant and Confluence support will tell us that probably we can’t count on upward move in nearest time.
Weekly
Weekly trend holds bearish. First, I just want to remind you our suspicions that we’ve discussed in previous research. If we will take a look at overall picture then we’ll see that the nature of up move and current move is different. Current action is not thrust. It looks like retracement, and probably upward move could continue. Who knows, may be current pullback is just a respect of strong support, but market has not quite reach it (monthly Confluence support). That’s why it’s hardly so. I don’t know but currently personally for me this environment looks more bullish rather than bearish. Here are some reasons for that. First, we clear see bullish dynamic pressure here. Look, market holds bear trend, but price action does not support that, market does not accelerate lower. Second, from classical perspectives, we see that bullish wedge or flag is forming. This is a consolidation but not an impulse move. Hence, this is a retracement.
Also we can treat this recent price action as Gartley “222” “Buy”.
There is couple of new moments that have appeared during recent week. First, closed week was an inside week – energy in market has increased. Second, take a look at recent price action – market is forming higher lows with bear trend. This is a confirmation of dynamic pressure. Now we have to keep an eye on that – will this tendency continue or not. That’s important.
And finally, pay attention to monthly pivot point. Do you see something different with it? Right, August is a first month in current consolidation, when price holds above the pivot for second consecutive week.
Also if you switch on your imagination you can find Butterfly “sell” pattern that is forming currently here…
Speaking about the targets – nearest one is 1.5081 – 0.618 Fib extension from AB-CD pattern, that is also a weekly overbought. Although dynamic pressure minimum target is clearing out the highs at 1.4925 – there are a lot of stops just above it. So, since they will be triggered, market definitely will accelerate further. Second area of targets is 1.5250-1.5270 - monthly AB-CD target.
Daily
Here we come to most difficult time frame for analysis on coming week. Let’s start from our H&S pattern that we’ve discussed on previous week first. Even with this pattern there are some worries signs exist. On a first view – everything seems to be in order, but if you will take a close look – you’ll see. First, trading volume does not support typical H&S behavior. Particularly, during right shoulder, when market moves up, trading volume should increase. Here we do not see it. Vice versa – trading volume decreases during recent week, when market has tried to move higher. Second, market has not been able to close above weekly pivot. This is curious a bit, since during right shoulder buyers should dominate and market usually moves higher easier. That has not happened. Third, look at price action during the last week – it’s not very common for H&S – market just could not choose the direction, it has shown very volatile days with closes preferably in the middle of the trading days. Highs and lows stand at the same distance from weekly pivot point – so, market is more indecision rather than in bullish momentum. Additional confirmation to that is “high wave” on Friday.
Still, some bullish sighs hold on the market. This is a bullish dynamic pressure. Market is forming higher lows and MACDP will come in play on Monday, I suppose. This will be important moment – depending on what we will see, we will make judgment about further price action. If it will be stop grabber, then probably perspective of H&S will become blurrier. Crucial point of this pattern stands the same – 1.4041.
#1
And now we turn to most interest moment of daily time frame, why I’ve said that it’s very difficult to analyze it. Let’s decompose our H&S pattern so that you can clearer see different scenarios and why it’s very hard to predict perspective.
First scenario stands it a row with weekly expectations. This is Butterfly that I’ve asked you to imagine on weekly chart. Since market has shown only 0.618 Fib retracement, it has the chances to reach 1.618 target at 1.50. Now take a look at weekly chart again – see the target at 1.5081? This is also weekly overbought. So these two targets coincide in tight range. The failure point is low at 1.3811.
#2
And here is opposite view for you also - Butterfly “Buy” pattern with downward AB-CD. Although it has opposite direction, it also has some significant moment to previous butterfly and H&S pattern. First, take a look at AB-CD pattern. Nearest 0.618 target stands at 1.4103 – even if market will reach it, it does not cancel H&S and if market will start up move right from that area could lead to another smaller butterfly “sell” – try to find it by yourself.
Second, pay attention to strong support at 1.3922 area – this is AB=CD target and pivot support 1. Although reaching of that area will cancel H&S – it will not cancel butterfly “Buy” pattern.
Potential target of this pattern is 1.3620-1.3630 area – agreement of 1.618 AB-CD target and 1.27 butterfly target. The failure point is high at 1.4514.
#3
And to finally confuse you – here is contracted daily chart. When I saw such triangle on 2002, market has continued move higher… It also has needed some time to think, since it just has passed through parity of EUR/USD. So as in 2002 as now is crucial moment on the market, but of cause it does not mean that it will 100% happen again.
#4
#5 2002
4-hour
On 4-hour chart I see bearish pattern. Market could not pass through 0.618 resistance and 0.5 resistance of nasty black candle, so it usually leads to further down move. The target of that bearish wedge coincides with both AB-CD o.618 targets and pivot support 1 - 1.41-1.4110.
Conclusion:
Safe way to trade current market is to wait breakout of crucial areas – 1.4514 or 1.3811. Still, if you want to make intraday trades – take profit fast and appoint near targets inside huge triangle on daily time frame.
Now market has contradictive signs at all time frames. In such circumstances I is better to stay flat and wait clear signals or, as we’ve said – trade intraday with tight targets and smaller volume.
The technical portion of Sive's analysis owes a great deal to Joe DiNapoli's methods, and uses a number of Joe's proprietary indicators. Please note that Sive's analysis is his own view of the market and is not endorsed by Joe DiNapoli or any related companies.
Last edited:
")