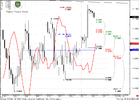
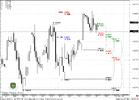
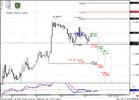
FOREX PRO Weekly August 15-19, 2011

149000 Area

Hi John

it may be good if you spend a little time reading the weekly thread as sive goes through the various time frames and as always when a market move in one direction weather its up or down you will get always a retracement this can be shallow or deep,but if you spend a little time every week on Sives weekly forum it will help you understand a little more clearly.

Thanks hope it helps

Asif
 
EUR/USD Daily Update, Tue 16, August 2011

Good morning,
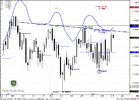
probably currently we see the first hint of futher upward continuation.
Now H&S pattern looks nice, very harmonic as in terms of ratios as in terms of time.

On daily time frame trend is bullish, market has hit 0.618 target of AB-CD pattern at 1.4475.
On 4 hour chart market has shown strong upward thrusting bar and has completed AB=CD pattern, so we can see some retracement, but I prefer to see it not deeper than 1.4330-1.4350. There are some reasons for that:
1. I prefer to see logical moves on market as soon as possible and to see that nervosness has left market. Logical will be retracement not deeper than 4-hour confluence support at 1.4330-1.4350. Besides, I do not want to see erasing of that thrusting bar on 4H. This will give me Confidence to expect further upward continuation.
2. Such strong bar right at AB-CD target point tells that market will continue upward move.
3. Too deep retracement is not welcome from Butterfly "Sell" standpoint, that we've discussed, as for H&S pattern.

So, probably we can see some retracement today, and 1.4330-1.4350 is an area to watch for Buy signals.
 

Attachments

  • EUR_D_16_08_11.PNG
    EUR_D_16_08_11.PNG
    49.3 KB · Views: 249
  • EUR_4H_16_08_11.PNG
    EUR_4H_16_08_11.PNG
    51.6 KB · Views: 252
Future price vs. prompt prices

Hi Sive!

I would like to see as clear as possible.
As You mentioned, market reached the target at 1,4475. As we know, You use future prices, and now this quote was the same in the prompt market. Is it just an intersting thing, or any mistake of me?
I tried to cathc a short entrance, for a scalp, but I missed (14 pip was the difference). I dont mind at all, I'm looking for the next possibility to enter long.

Thanks for all your efforts and regular analysis! You are really great!
 
Relief

Hi Sive!

As we know, You use future prices, and now this quote was the same in the prompt market. Is it just an intersting thing, or any mistake of me?

I'm glad it's not just me.

Sive,

Thanks again for all your help and insights.

Keep the pips flowing....
 
Hi Sive!

I would like to see as clear as possible.
As You mentioned, market reached the target at 1,4475. As we know, You use future prices, and now this quote was the same in the prompt market. Is it just an intersting thing, or any mistake of me?
I tried to cathc a short entrance, for a scalp, but I missed (14 pip was the difference). I dont mind at all, I'm looking for the next possibility to enter long.

Thanks for all your efforts and regular analysis! You are really great!

I'm glad it's not just me.

Sive,

Thanks again for all your help and insights.

Keep the pips flowing....

Hi guys,
the difference between futures and spot quotes is due interest rate difference between EUR and USD for period till futures expiration. Since September contract is leading now, the time till expiration very small, so the difference is also has contracted significantly. In september there will be December leading contract and this difference will appear again.

Thx Sive!

It is clear now, swap points to september are 5-7 pips.
 
EUR/USD Daily Update, Wed 17, August 2011

Good morning,
So, we've guessed right with the area of support - market has reached 1.4350.
if we could exclude the splash on hourly chart to 1.4467, we might say that this is descending triangle pattern.
We have no possible butterfly, since the second downsing has lower low than the first one.

Although descending triangles as a rule shows downward breakout, here, I suppose could be quite another case. Still I see one possible trap here.

There are two different ways to possess yourself in this trade. Keep in mind that daily and hourly trends are bullish. Although market has completed AB-CD on hourly chart - it has formed long thrusting bar right before the target of AB-CD. This very often leads to continuation. Also there is bullish divergence with MACD, btw...

First way to trade is simple - wait for some patterns and clear breakout of triangle. Then drop your timeframe to 5-min - and wait the nearest Fib support after breakout to enter.

Second way applies if you want to possess yourself before breakout. You can do that, but place your stop below 4-hour confluence support. Here we have to say about the trap that I've mentioned above. See, AB-CD pattern inside triangle? Market has not quite reached 1.0 extension. It creates an Agreement with confluence support. This is potential context for DiNApoli "ooops" directional pattern - failure triangle breakout. Market could reach Fib support and then push from it and show opposite breakout.
Also it could come in a way of butterfly "Sell".
Anyway place stop below this 4-hour confluence support. Let see what will happen...
 

Attachments

  • EUR_4H_17_08_11.PNG
    EUR_4H_17_08_11.PNG
    46 KB · Views: 184
  • EUR_1H_17_08_11.PNG
    EUR_1H_17_08_11.PNG
    42.2 KB · Views: 181
Sive on yesterday's trade where would you have placed your stop? Sometimes my stop gets grabbed because I have too much confidence in a support level, like the confluence support on the 4h chart. I had risked 100 pips at entry with 1.4360 and sl at 1.4260, then yesterday I moved my SL to 4330 below the confluence support to lessen risk. The market moved at 3 AM to grab all of the stops while I was sleeping. Even though it is dependant upon trading style, I would like to know your SL level on yesterday's trade and maybe some reasoning, if you could.

Best Regards,
Josh

Hi Josh,
I've entered based on 5-min Butterfly, that I've posted in video thread on 16th of August. Since this was 1.27 butterfly, my initial stop was below 1.618 level.
But later I've move it to breakeven, so I lose nothing. (Ive entered at 1.4363) - almost at the bottom of initial leg of retracement right from 1.4350 that we've discussed.
My usual tactic is to move stop to b/e as soon as possible. Usually I do it after 20+ pips move in my favor if I trade at 5-60 min charts. That safe a lot of money...
 
We had a RRT on one hour time frame, yes? One question, though, is the down bar is much longer than the up bar, so which one do we use to calculate the nearest target to the downside? The shorter up bar, or the longer down bar?
 
Back
Top