FOREX PRO Weekly August 15-19, 2011

We had a RRT on one hour time frame, yes? One question, though, is the down bar is much longer than the up bar, so which one do we use to calculate the nearest target to the downside? The shorter up bar, or the longer down bar?

Hi Icarus, RRT suggests that there is not price action to the left from the pattern at the same price level for extended period of time (at least 130-150 periods). So, for me it more looks like W&R of previous highs...

If bars are different, this is more bearish engulfing, rather than RRT. Still, using smaller bar's length is a conservative approach for target estimation, so it's more probable and hence reliable.
 
EUR/USD Daily Update, Thu 18, August 2011

Good morning,
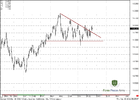
So, our idea with fake triangle breakout has worked, thanks to SNB intervention...

Now, if you will take a look at contracted daily chart again (as we show it in weekly research), you'll see that market has broken this triangle to the upside, and now stands in tight consolidation after breakout. This is bullish sign.

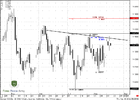
Second, on common daily chart market stands in the same tight consolidation right under neckline of H&S pattern. The fact that market does not move lower than 0.382 Fib support for me also look bullish. Trend is bullish also, btw.

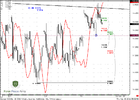
On 4-hour chart there is one technical moment though, that could lead to some short-term downward move. See, how market acts with MACDP red line. Yesterday it has shown fast failure trend change - and that has led to clearing out previous lows. Now you see, that the same pattern appears again, since we can't exclude that lows at 1.4319 could be renewed by market...

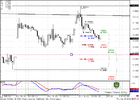
On hourly chart we see that 1.618 target stands right below yesterday's lows, so market could take it today, besides - hourly and 4-hour trends are bearish.

So, if you want to enter long based on daily time frame scenario wait one of the two possible ways:
1. if you'll find some clear bullish pattern on hourly chart - for instance, butterfly "Buy" with the target that coincides with 1.618 AB-CD target.
2.If you will not, then wait when all three trends (daily, hourly and 4-hour) will turn bullish. Then you may use nearest Fib support on hourly time frame to enter long.

To enter short is very dangerous currently. Still you may - but be sure that your risk is small.
 

Attachments

  • EUR_D_18_08_11.PNG
    EUR_D_18_08_11.PNG
    39.3 KB · Views: 163
  • EUR_D1_18_08_11.PNG
    EUR_D1_18_08_11.PNG
    46 KB · Views: 166
  • EUR_4H_18_08_11.PNG
    EUR_4H_18_08_11.PNG
    52.5 KB · Views: 162
  • EUR_1H_18_08_11.PNG
    EUR_1H_18_08_11.PNG
    45 KB · Views: 164
thanks sive..
so thats mean market will move down first to yesterday low then wait signal to enter long?
 
thanks sive..
so thats mean market will move down first to yesterday low then wait signal to enter long?

Not quite. It could renew the low, but this fact does not link with bullish signal. Wherever it will be - before enter Long search for clear pattern on trend shifting.
But where market will stop on it's downmove - who knows....
 
Looks like we are going to have a "Kiss and good bye" from the descending trend line of the Daily triangle. :D
 
Hi Sive, hi @all
thanks for your excellent analysis every day. Could you give us please your opinion about further development for GBPUSD? It seems very strong against the Euro and the Dollar in last time.
 
Hi Sive, hi @all
thanks for your excellent analysis every day. Could you give us please your opinion about further development for GBPUSD? It seems very strong against the Euro and the Dollar in last time.

Hi Sanders
well, this part of forum is for education, not to give particular signals. So, make your own analysis and post it. And we will discuss it, ok?
 
Hi Sanders
well, this part of forum is for education, not to give particular signals. So, make your own analysis and post it. And we will discuss it, ok?
I'm not the giant here... :D and i only wanna your opinion not a complete trading plan. But ok, here is what i think:
After the crash in 2008, the Euro lost around 30% and the Pound some more than 50% against the Dollar. Today the Euro in the near the 61,8% retracement, but the Pound stands only at the 38,2% retracement. Now i think, a long term up trend is possible, while the Dollar is going weaker. What do you think about that?
 
Thank you

HI Sive,

I now realise I read or understood your analysis wrong for quite a while. For the past two weeks I have paid better attention to what you say in your weekly analysis and daily updates. Apart from a acting a bit too slowly on Monday, as trailing stop hit before I got to my computer all your other 'predictions' have come through. I am particularly impressed by the fact, which I was afraid to act up on by the way, that yesterday despite all the bullish signs, the market could take out the low of the day before. Did it not do just that and almost to a tee. I placed several buys even on the way down. The lower it went to higher the amount. At hitting 1.4335 I closed for a nice profit. Now as you said it is waiting for the trend to change on the hourly and 4 hourly charts.

My apologies for misjudging you in the past. I now know the problem was at my end. Sometimes I think you are a profit. Your analysis is spot on but all the moves on the market are due to clear events and announcements, still the technical analysis seems to be able to predict these wierd swings.

Thank you once again. Looking forward to many more of your insightful analysis.

Geert
 
well Done Geet

Dear Geet,

Asif here remember me :))

Well done as you took the time and am pleased that you understand,

Also 2 books may help you immensely first one is Mark Douglas Trading in the zone and also Joe Di napolia indicators.


Wish you every sucess as a trader

Asif
 
Back
Top