Sive Morten
Special Consultant to the FPA
- Messages
- 18,621
On previous week I have spent some time to analyze overall situation on nearest 6 month, say, to feel the financial spirit of current situation – so, I would like to share with you with my thoughts. May be for somebody they will be interesting. Initially I have read some comments of representatives, experts and try to involve pure political events during nearest 6 month. So, ladies and gentlemen what we have?
To be Euro or not to be...
By current crisis many people link this question with Greece. But at my thought this is not correct, at least not quite correct. If we will take a look at Greece share in EU GDP, we’ll see that Greece is relatively small country. Actually this will not be a tragedy for EU if Greece will leave it by two reasons. First is – as we’ve said, small share of Greece in EU economy, second – Greece stands with EU not so long as, say core countries. But that is not the question about Greece elimination, but some confrontation in society of holding EUR as currency and those limitations of budget that EUR holding put on country. People what to hold EUR as currency but they do not want to loose in wealth due budget spending contraction and other measures that budget pruning put on them. Recall how Greek crisis has started – when EU committee restrictions on Greece budget were announces, and that was really heavy burden for them – there was appear a populist political power that calls for leaving of EU. But what has happened next? They lost on referendum. That is what about debtors. In Germany is a bit different situation. Germans like EUR, but they do not want spend their taxes for other countries. So, I think that is clear. And now we approach to most important event that should happen in nearest 6 months – Italy elections. Italy is quite different member of EU than Greece. This is third largest economy, this is “old” EU member and, what is more important, is that – if for Greeks joining to EU was some sort of upward wealth and spending breakout, Italians live in that way for centuries. They get used to it. And for them current situation with budget cut, mass restrictions and plunge in earnings is serious hit, that’s some shock, people angry. Community spirit stronger absorbs and idea of denying from EUR. For most people this is look like that: “Before EU everything was excellent, but after EU it becomes worse, because we’ve accepted such countries as Greece and others and they bring crisis to us, since they have solid problems.” Logical conclusion is to exit from EU. Here is the first major risk. If during elections in Italy some populist party will try to use current displeasure and will call to EU exit. That could be a bomb. It’s worthy to say that probability of this still not very significant (recall – people in EU still like EUR), but here we trying to assess risks of upcoming events.
Fast look at financial markets
First of all, I would like to start from equity market. What is going on there? Why it is growing? Do you see some cash out flow from other markets? Nope – bond yields are at minimum levels and short-term even negative, gold stands in tight range. What reasons lead to stocks’ growing? We do not see nice company earnings reports – they are average, or even worse. Economy does not show demand growth, unemployment is still solid and retail sales anemic. When I do not understand something – I prefer not to invest in these assets. Here I see couple of reasons for this growth. First is excessive liquidity. If we will take a look at M3 money supply statistic on major countries – we’ll see that supply is growing very fast. That is not surprise with QE I and II and EU mass buybacks and distribution of financial help. May be investors have bought already that they wanted, but they still have free money and they just put them in all assets that they have. Second idea is a bit cynic – what if large hedge funds and banks sell equities to each other to hold their price? It is difficult to suggest in permanent way, but when retail investor left market – that could be done. Something is wrong with this growth. Yesterday I’ve read that G. Soros fund sold equities of all US banks, particularly JP Morgan, Goldman and Wells Fargo. That is a subject to think about. EU banks have scaring problems, but there another story – regulators and banks themselves withhold information about a scale of problems.
Still, this also could be a third moment – historically equities show growth before elections in US and possibility of starting of QE III are still exists. May be we see some buying for perspective.
But US have own risk. Precisely speaking, there are two of them. First is increasing of debt ceil that will have to be pushed through Congress again. If Democrats will win – republicans could put spoke in wheel with debt ceil process. Opposite is possible if Republicans will take govern. Second is, and most important is that currently Fed reassess effect of QE’s. I’ve read comments of governors of different Fed Reserve banks and they have no agreement on this question. Particularly, initially they thought that high unemployment should push on prices, while currently there is no confirmation of this. That’s why perspectives of QE III are not as significant as they expected.
Finally here are some thoughts about EUR/USD. Current situation could be characterized by two words – investors have bought as much dollars as they need, that is one a reason among the others why USD growth takes some pause. Although demand for USD becomes weaker – investors do not want to buy EUR. That’s why, I suppose, volatility in nearest future will rise significantly – till the moment, I suppose, that could give solid impulse to current market.
Personally I’ve made two conclusions for myself. First is that it is too early to invest in equities. I have some feel that around 1450-1500 by S&P 500 this rally could over by solid plunge down. Second, most preferable objects for investments still are bonds and… gold in long perspective. Negative interest rates, massive cash injection and fast growth of money supply should put Gold higher. It is very probable that current Gold consolidation will lead to long-term target around 1950-2000$ per Oz.
Also there are some interesting disproportions on the market. For instance, currently Australian Banking sector has become greater than European. And US IT sector is greater than whole Europe stock market. Interesting, right? So all that we have to do is just wait the end of summer – mass testimony from Fed (in Jackson Hole) and EU could be significant in short-term.
Monthly
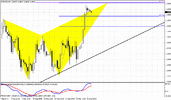
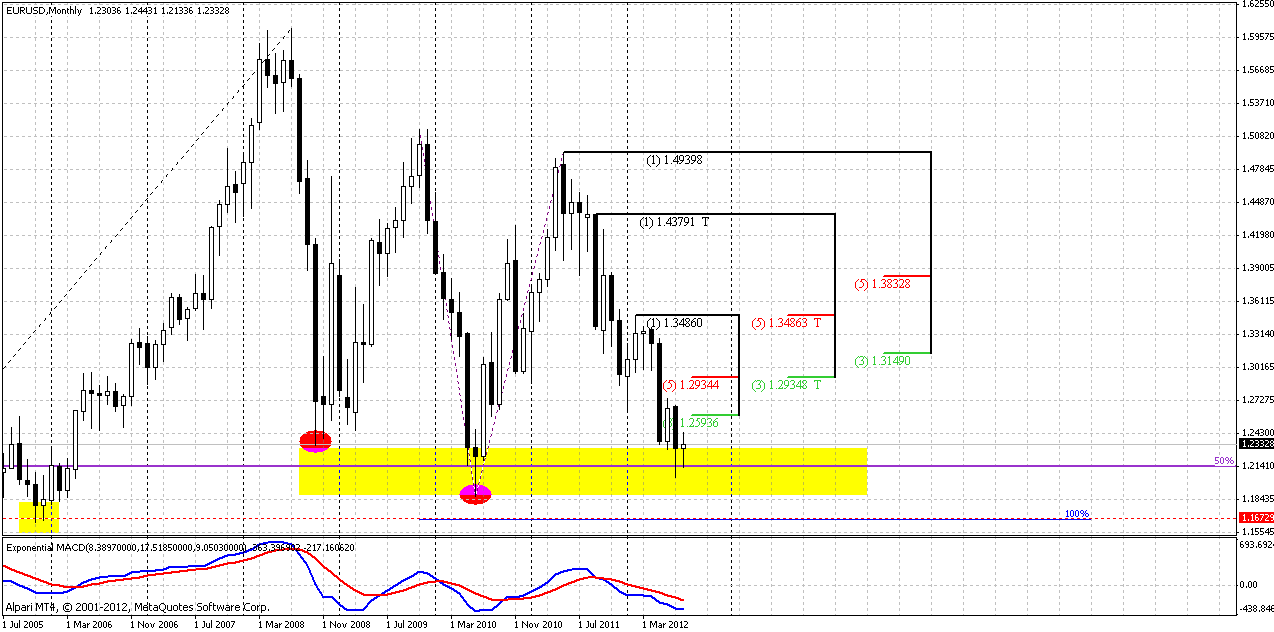
Monthly trend holds bearish. Price continues to force significant support area 1.19-1.23 that held EUR twice from collapse – first time in 2008 when sub-prime crisis has started and second – in 2010 at beginning of Greece turmoil.
Current close price is different from previous week just for 50 pips – that’s too small for monthly time frame to add some new comments. Currently August continues to be an inside month to July. Minimum target still is 1.16-1.17 area, based on analysis of quarterly chart of Dollar Index that we’ve made in Nov 2011. Index has 95% correlation with EUR/USD. Also this is AB=CD target of most recent pattern on current chart. Also take a look – this is significant support of 2005 as well – marked by yellow rectangle.
Nearest Fib resistance is 1.2593, stronger area is monthly K-resistance 1.2934. In short-term perspective some bounce to 1.25-1.26 area looks possible. Last two candles have longer shadows, so it shows that support still presents here, despite solid piercing of this area in 2010.
In longer-term market is entering into very, say, “dangerous” area, and it comes to it not at oversold as it was two times previously. If it will break it – this will be the road to 1.07-1.10 area or ultimately even to parity.
Weekly
Here I left some important thoughts from previous research, so we can track how situation is changing:
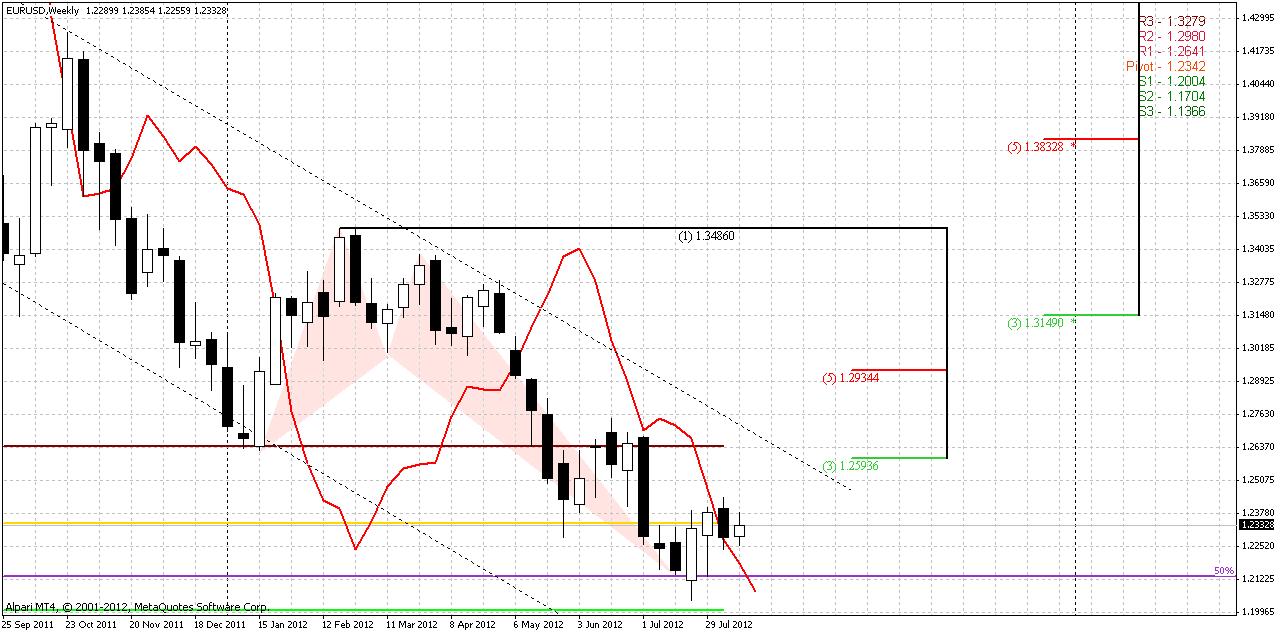
“…Here I would like to discuss couple of moments that we haven’t touched in previous researches. First of all – take a look at overall price move inside downward parallel channel. During previous bottoms, when price touched low border of the channel there were no divergences. Also we do not see any reversal patterns, when these bottoms were reached. Second moment is – market did not start move to upper border prior of reaching lower one first.
Now take a look at current price action – we have all these signs that weren’t here previously. We have divergence, although it is not quite completed yet, we have butterfly “buy” pattern at long-term 50% monthly support and we see that market is showing attempt to do upward retracement before reaching of lower border of the channel. What conclusion could be made from all this stuff?
Well, one part of puzzle is still absent, I think. I’m speaking about depth of current retracement. If you will take a close look at weekly chart, you’ll see that appearing some kind of bullish wedge or 3-Drive pattern is still possible. By completing of this pattern, market precisely will reach lower border and will continue movement inside of channel. But for that purpose current retracement should stop around 1.2550 area. If this will not happen, then all factors that we just have specified will come in play, and retracement could be deeper.
So, I have to say, that weekly chart is most interesting now. Look – we have some contradiction between potential 3-Drive, that theoretically should push market to lower border of channel, and bullish engulfing pattern. Recall, that minimum target of engulfing pattern is a length of the bars. So, if you will count it to upside – that will be around 1.2550-1.26 area and MPR1. If this really will happen, then, take a look at the chart – this could lead to reverse H&S pattern and deeper retracement to 1.30 K-resistance on weekly/monthly time frames.”
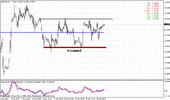
On previous week we said, that bears will need to break major 5/8 support on daily time frame to return control over market and shift trend to bearish again. They couldn’t do that. Market has formed inside week. Also it starts to look like bearish dynamic pressure. I can’t state it for sure, since here is just two bars, but market shows some creep with red line to the downside. So, here we still have short-term bullish context. Since price action during previous week was poor, situation will mostly depend on daily and lower time frames. Here riddle about 3-Drive or deeper upward move could be resolved yet.
Daily
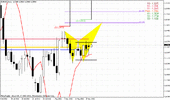
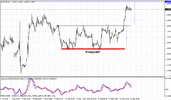
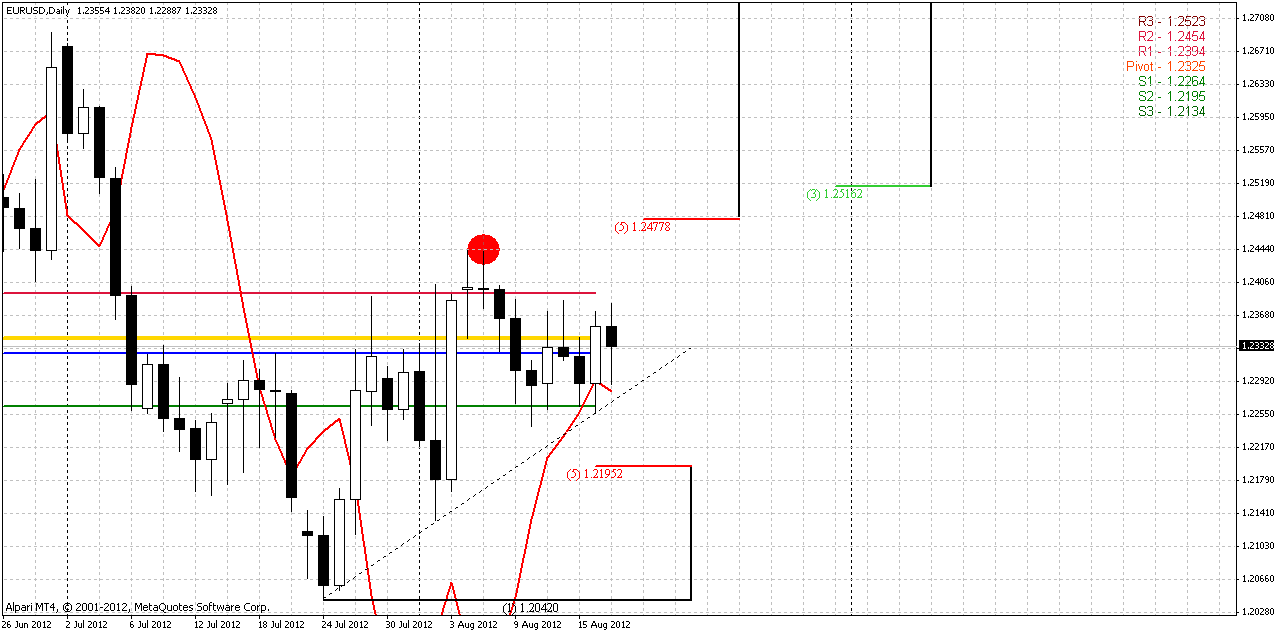
Currently daily chart gives hint on bullish continuation by two reasons. Market has held above support line and 4-hour K-support area, not even has reached major 0.618 Fib support here that is really important from weekly standpoint. Trend holds bullish and we have bullish stop grabber pattern that we closely discussed on Friday. Minimum target of stop grabber is previous high. That is, I suppose, 1.2445 area. Also I can’t exclude that market finally will complete upward AB=CD pattern and reach at least 1.25 area or even 1.2560 – target of most recent AB=CD. So, as on Friday, we can use most recent “stop grabber” swing up to enter long (if you have not entered yet). Also this is move out from 4-hour K-support area. WPP for current week is 1.2325 – almost the same value as on previous one.
4-hour
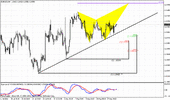
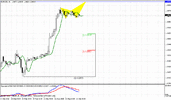
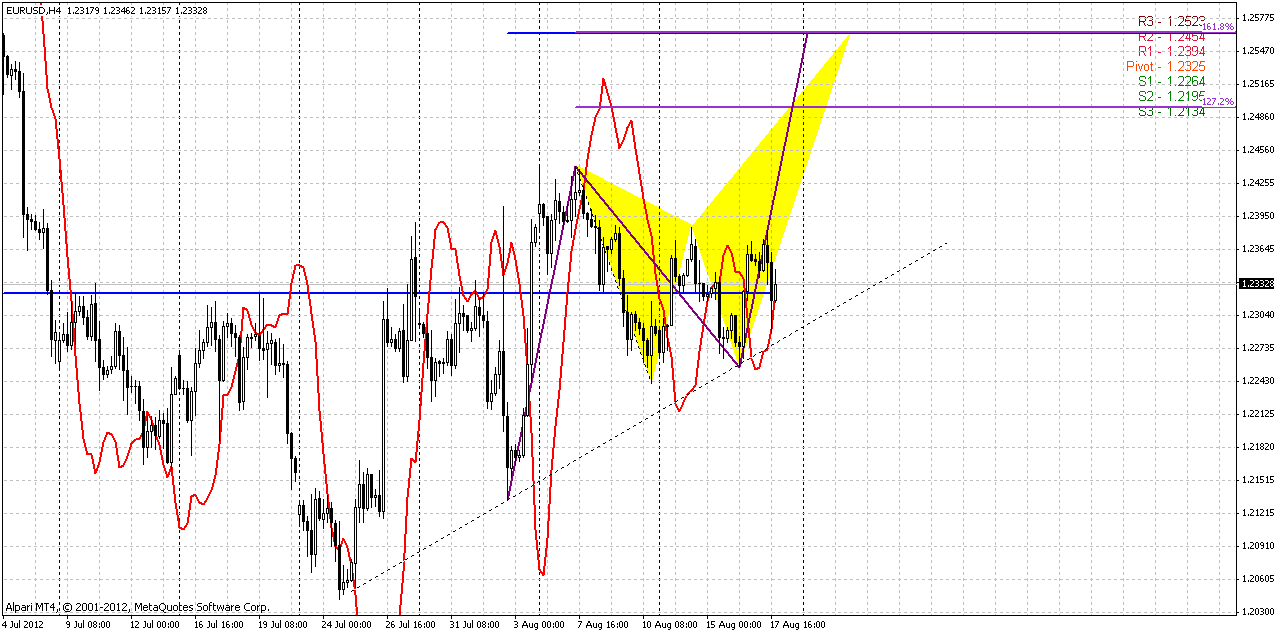
This chart is a bit overloaded, but actually I want to show just two things. Bullish stop grabber on 4-hour chart and agreement between AB=CD target and 1.618 Butterfly. Don’t judge me strictly, since I’ve drawn AB-CD pattern not quite correct. But with this way of drawing it looks better with butterfly pattern.
60-min
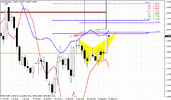
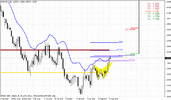
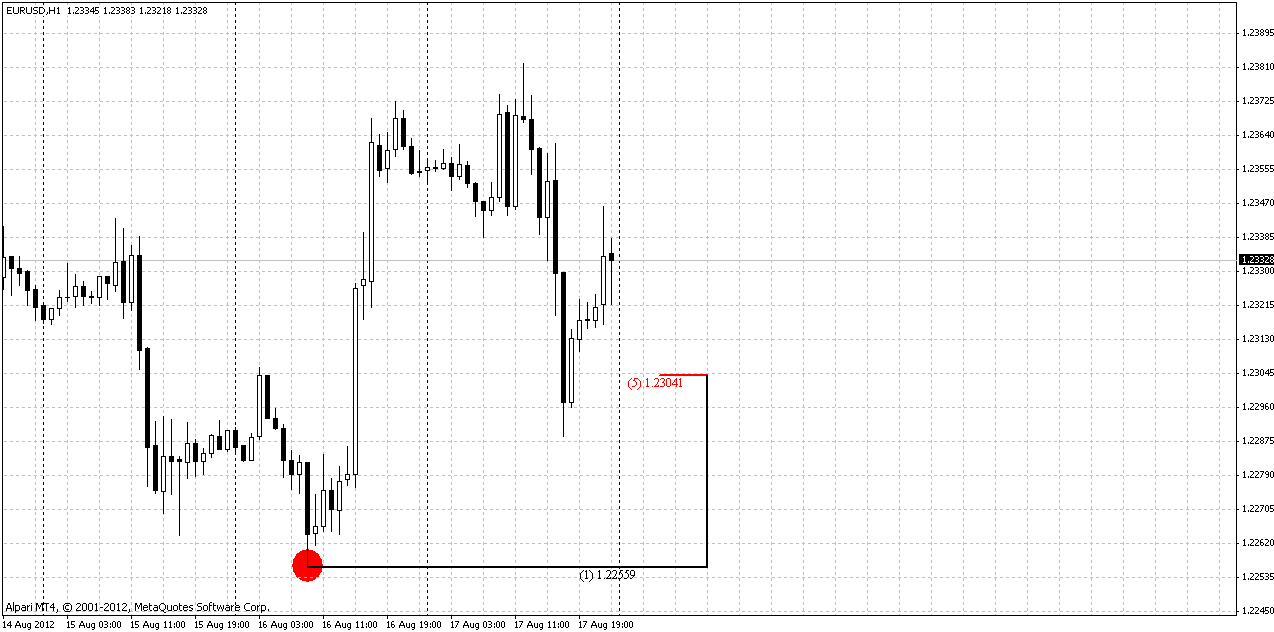
Here on hourly chart we see a bit deeper retracement that we’ve suggested, but daily stop grabber swing still valid. Our invalidation point here is a low of this swing. If market will take it, then it will erase two major moments – stop grabber pattern per se and bullish trend on daily time frame.
Conclusion:
Long-term bearish sentiment is still in play. In the nearest 6 month we should be ready to significant growth in market volatility due to some reasons that we’ve discussed above.
Situation on weekly chart looks dubiously. If bulls will push market to 1.26 area – this could lead for further continuation to 1.30. If not, and price will break 1.2190 support area, then downward move will be more probable in a row with potential weekly 3-Drive “Buy” pattern. So, we can say that current week is important for medium term perspective.
In shorter-term frame market gives signs on first scenario – currently price action looks bullish as by trend as by pattern that was formed on Friday.
The technical portion of Sive's analysis owes a great deal to Joe DiNapoli's methods, and uses a number of Joe's proprietary indicators. Please note that Sive's analysis is his own view of the market and is not endorsed by Joe DiNapoli or any related companies.
To be Euro or not to be...
By current crisis many people link this question with Greece. But at my thought this is not correct, at least not quite correct. If we will take a look at Greece share in EU GDP, we’ll see that Greece is relatively small country. Actually this will not be a tragedy for EU if Greece will leave it by two reasons. First is – as we’ve said, small share of Greece in EU economy, second – Greece stands with EU not so long as, say core countries. But that is not the question about Greece elimination, but some confrontation in society of holding EUR as currency and those limitations of budget that EUR holding put on country. People what to hold EUR as currency but they do not want to loose in wealth due budget spending contraction and other measures that budget pruning put on them. Recall how Greek crisis has started – when EU committee restrictions on Greece budget were announces, and that was really heavy burden for them – there was appear a populist political power that calls for leaving of EU. But what has happened next? They lost on referendum. That is what about debtors. In Germany is a bit different situation. Germans like EUR, but they do not want spend their taxes for other countries. So, I think that is clear. And now we approach to most important event that should happen in nearest 6 months – Italy elections. Italy is quite different member of EU than Greece. This is third largest economy, this is “old” EU member and, what is more important, is that – if for Greeks joining to EU was some sort of upward wealth and spending breakout, Italians live in that way for centuries. They get used to it. And for them current situation with budget cut, mass restrictions and plunge in earnings is serious hit, that’s some shock, people angry. Community spirit stronger absorbs and idea of denying from EUR. For most people this is look like that: “Before EU everything was excellent, but after EU it becomes worse, because we’ve accepted such countries as Greece and others and they bring crisis to us, since they have solid problems.” Logical conclusion is to exit from EU. Here is the first major risk. If during elections in Italy some populist party will try to use current displeasure and will call to EU exit. That could be a bomb. It’s worthy to say that probability of this still not very significant (recall – people in EU still like EUR), but here we trying to assess risks of upcoming events.
Fast look at financial markets
First of all, I would like to start from equity market. What is going on there? Why it is growing? Do you see some cash out flow from other markets? Nope – bond yields are at minimum levels and short-term even negative, gold stands in tight range. What reasons lead to stocks’ growing? We do not see nice company earnings reports – they are average, or even worse. Economy does not show demand growth, unemployment is still solid and retail sales anemic. When I do not understand something – I prefer not to invest in these assets. Here I see couple of reasons for this growth. First is excessive liquidity. If we will take a look at M3 money supply statistic on major countries – we’ll see that supply is growing very fast. That is not surprise with QE I and II and EU mass buybacks and distribution of financial help. May be investors have bought already that they wanted, but they still have free money and they just put them in all assets that they have. Second idea is a bit cynic – what if large hedge funds and banks sell equities to each other to hold their price? It is difficult to suggest in permanent way, but when retail investor left market – that could be done. Something is wrong with this growth. Yesterday I’ve read that G. Soros fund sold equities of all US banks, particularly JP Morgan, Goldman and Wells Fargo. That is a subject to think about. EU banks have scaring problems, but there another story – regulators and banks themselves withhold information about a scale of problems.
Still, this also could be a third moment – historically equities show growth before elections in US and possibility of starting of QE III are still exists. May be we see some buying for perspective.
But US have own risk. Precisely speaking, there are two of them. First is increasing of debt ceil that will have to be pushed through Congress again. If Democrats will win – republicans could put spoke in wheel with debt ceil process. Opposite is possible if Republicans will take govern. Second is, and most important is that currently Fed reassess effect of QE’s. I’ve read comments of governors of different Fed Reserve banks and they have no agreement on this question. Particularly, initially they thought that high unemployment should push on prices, while currently there is no confirmation of this. That’s why perspectives of QE III are not as significant as they expected.
Finally here are some thoughts about EUR/USD. Current situation could be characterized by two words – investors have bought as much dollars as they need, that is one a reason among the others why USD growth takes some pause. Although demand for USD becomes weaker – investors do not want to buy EUR. That’s why, I suppose, volatility in nearest future will rise significantly – till the moment, I suppose, that could give solid impulse to current market.
Personally I’ve made two conclusions for myself. First is that it is too early to invest in equities. I have some feel that around 1450-1500 by S&P 500 this rally could over by solid plunge down. Second, most preferable objects for investments still are bonds and… gold in long perspective. Negative interest rates, massive cash injection and fast growth of money supply should put Gold higher. It is very probable that current Gold consolidation will lead to long-term target around 1950-2000$ per Oz.
Also there are some interesting disproportions on the market. For instance, currently Australian Banking sector has become greater than European. And US IT sector is greater than whole Europe stock market. Interesting, right? So all that we have to do is just wait the end of summer – mass testimony from Fed (in Jackson Hole) and EU could be significant in short-term.
Monthly
Monthly trend holds bearish. Price continues to force significant support area 1.19-1.23 that held EUR twice from collapse – first time in 2008 when sub-prime crisis has started and second – in 2010 at beginning of Greece turmoil.
Current close price is different from previous week just for 50 pips – that’s too small for monthly time frame to add some new comments. Currently August continues to be an inside month to July. Minimum target still is 1.16-1.17 area, based on analysis of quarterly chart of Dollar Index that we’ve made in Nov 2011. Index has 95% correlation with EUR/USD. Also this is AB=CD target of most recent pattern on current chart. Also take a look – this is significant support of 2005 as well – marked by yellow rectangle.
Nearest Fib resistance is 1.2593, stronger area is monthly K-resistance 1.2934. In short-term perspective some bounce to 1.25-1.26 area looks possible. Last two candles have longer shadows, so it shows that support still presents here, despite solid piercing of this area in 2010.
In longer-term market is entering into very, say, “dangerous” area, and it comes to it not at oversold as it was two times previously. If it will break it – this will be the road to 1.07-1.10 area or ultimately even to parity.

Weekly
Here I left some important thoughts from previous research, so we can track how situation is changing:
“…Here I would like to discuss couple of moments that we haven’t touched in previous researches. First of all – take a look at overall price move inside downward parallel channel. During previous bottoms, when price touched low border of the channel there were no divergences. Also we do not see any reversal patterns, when these bottoms were reached. Second moment is – market did not start move to upper border prior of reaching lower one first.
Now take a look at current price action – we have all these signs that weren’t here previously. We have divergence, although it is not quite completed yet, we have butterfly “buy” pattern at long-term 50% monthly support and we see that market is showing attempt to do upward retracement before reaching of lower border of the channel. What conclusion could be made from all this stuff?
Well, one part of puzzle is still absent, I think. I’m speaking about depth of current retracement. If you will take a close look at weekly chart, you’ll see that appearing some kind of bullish wedge or 3-Drive pattern is still possible. By completing of this pattern, market precisely will reach lower border and will continue movement inside of channel. But for that purpose current retracement should stop around 1.2550 area. If this will not happen, then all factors that we just have specified will come in play, and retracement could be deeper.
So, I have to say, that weekly chart is most interesting now. Look – we have some contradiction between potential 3-Drive, that theoretically should push market to lower border of channel, and bullish engulfing pattern. Recall, that minimum target of engulfing pattern is a length of the bars. So, if you will count it to upside – that will be around 1.2550-1.26 area and MPR1. If this really will happen, then, take a look at the chart – this could lead to reverse H&S pattern and deeper retracement to 1.30 K-resistance on weekly/monthly time frames.”
On previous week we said, that bears will need to break major 5/8 support on daily time frame to return control over market and shift trend to bearish again. They couldn’t do that. Market has formed inside week. Also it starts to look like bearish dynamic pressure. I can’t state it for sure, since here is just two bars, but market shows some creep with red line to the downside. So, here we still have short-term bullish context. Since price action during previous week was poor, situation will mostly depend on daily and lower time frames. Here riddle about 3-Drive or deeper upward move could be resolved yet.

Daily
Currently daily chart gives hint on bullish continuation by two reasons. Market has held above support line and 4-hour K-support area, not even has reached major 0.618 Fib support here that is really important from weekly standpoint. Trend holds bullish and we have bullish stop grabber pattern that we closely discussed on Friday. Minimum target of stop grabber is previous high. That is, I suppose, 1.2445 area. Also I can’t exclude that market finally will complete upward AB=CD pattern and reach at least 1.25 area or even 1.2560 – target of most recent AB=CD. So, as on Friday, we can use most recent “stop grabber” swing up to enter long (if you have not entered yet). Also this is move out from 4-hour K-support area. WPP for current week is 1.2325 – almost the same value as on previous one.

4-hour
This chart is a bit overloaded, but actually I want to show just two things. Bullish stop grabber on 4-hour chart and agreement between AB=CD target and 1.618 Butterfly. Don’t judge me strictly, since I’ve drawn AB-CD pattern not quite correct. But with this way of drawing it looks better with butterfly pattern.

60-min
Here on hourly chart we see a bit deeper retracement that we’ve suggested, but daily stop grabber swing still valid. Our invalidation point here is a low of this swing. If market will take it, then it will erase two major moments – stop grabber pattern per se and bullish trend on daily time frame.

Conclusion:
Long-term bearish sentiment is still in play. In the nearest 6 month we should be ready to significant growth in market volatility due to some reasons that we’ve discussed above.
Situation on weekly chart looks dubiously. If bulls will push market to 1.26 area – this could lead for further continuation to 1.30. If not, and price will break 1.2190 support area, then downward move will be more probable in a row with potential weekly 3-Drive “Buy” pattern. So, we can say that current week is important for medium term perspective.
In shorter-term frame market gives signs on first scenario – currently price action looks bullish as by trend as by pattern that was formed on Friday.
The technical portion of Sive's analysis owes a great deal to Joe DiNapoli's methods, and uses a number of Joe's proprietary indicators. Please note that Sive's analysis is his own view of the market and is not endorsed by Joe DiNapoli or any related companies.
Last edited:
