- Forex, Gold, BTC Market Analysis | Trading Signals
- Sive Morten- Currencies, Gold, Bitcoin Daily Video
You are using an out of date browser. It may not display this or other websites correctly.
You should upgrade or use an alternative browser.
You should upgrade or use an alternative browser.
FOREX PRO Weekly August 22-26, 2011
- Thread starter Sive Morten
- Start date
Sive Morten
Special Consultant to the FPA
- Messages
- 18,655
Hi sive
many thanks for info. it is extremely helpful and most interesting. i am a new subscriber from cape town and just want to say a big thank you.
dave edwards
Hi Dave,
welcome aboard.
In 4 hours time frame;
A Head and shoulder pattern is being built?
It seems that right shoulder and head has been completed , now left shoulder is being built?
What do you think?
All my best..
H&S is a reversal pattern, and current price action looks to me more as Gartley "222" not as H&S, at least on 4 hour chart. Also there is a confusing moment with the high of left shoulder, that is higher than the head...
If even we will not take that into consideration, probably this H&S is for 5-15 min charts, for 4-hour it seems too small.
Sive Morten
Special Consultant to the FPA
- Messages
- 18,655
EUR/USD Daily Update, Tue 23, August 2011
Good morning,
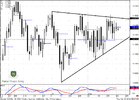
it's obvious that market indecision currently and building and energy, since price action almost for 2 weeks stands in tight range.
I suspect that picture will not change till 25th of August and Bernanke statement about QE III for 500B could lead to releasing of that energy, i.e. breakout.
Hence, today we again will focus on intraday trading.
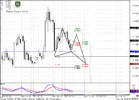
on 4-hour chart could be many different scenarios- it could be deeper AB=CD move, or it could be Butterfly "sell" pattern, if market will reach just 0.618 target at 1.4289.
Personally, today I will be watch over 1.4325 area on hourly chart, since it could turn to Gartley 222 Buy. Market now stands in trianlge consolidation that could shift to AB-CD retracement. AB=CD target creates an Agreement with 0.618 support. Here we should drop time frame to 5-min chart and watch for Buy signals.
Even if market will continue move down further, it porbably will show some respect to that area that will allow to move your stop to b/e.
Do not choose far target. Use just 0.618 target of upward AB-CD, based on that potential 222 Buy.
Stop is better to place below 1.4289, somewere around 1.4275. But if you will enter based on some particular pattern on 5-min chart, then place stop accordingly with that pattern
Good morning,
it's obvious that market indecision currently and building and energy, since price action almost for 2 weeks stands in tight range.
I suspect that picture will not change till 25th of August and Bernanke statement about QE III for 500B could lead to releasing of that energy, i.e. breakout.
Hence, today we again will focus on intraday trading.
on 4-hour chart could be many different scenarios- it could be deeper AB=CD move, or it could be Butterfly "sell" pattern, if market will reach just 0.618 target at 1.4289.
Personally, today I will be watch over 1.4325 area on hourly chart, since it could turn to Gartley 222 Buy. Market now stands in trianlge consolidation that could shift to AB-CD retracement. AB=CD target creates an Agreement with 0.618 support. Here we should drop time frame to 5-min chart and watch for Buy signals.
Even if market will continue move down further, it porbably will show some respect to that area that will allow to move your stop to b/e.
Do not choose far target. Use just 0.618 target of upward AB-CD, based on that potential 222 Buy.
Stop is better to place below 1.4289, somewere around 1.4275. But if you will enter based on some particular pattern on 5-min chart, then place stop accordingly with that pattern
Attachments
Sive Morten
Special Consultant to the FPA
- Messages
- 18,655
EUR/USD Daily Update, Wed 24, August 2011
Good morning,
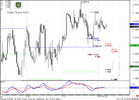
looks like till Jackson Hole's testimony we will not see any strong moves, as we've suggested.
So, today market shows 2 possible patterns. One of them is big, while other is small.
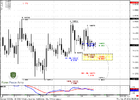
Big is a potential butterfly "Sell" on 4-hour chart. Left wing has been formed already, right wing is in process. For butterfly it needs a bit deeper retracement, and one of the potential levels to watch is 0.618 Fib support at 1.4346.
Smaller pattern is Butterfly "buy" on hourly chart, with 1.27 target at the same 1.4346 area. I suppose, you've cought my idea, right?
Watch for 1.4346 today. If Butterfy "Buy" will be formed - use it to possess yourself in larger Butterfly "Sell". This gives you excellent risk/reward ratio'
Good morning,
looks like till Jackson Hole's testimony we will not see any strong moves, as we've suggested.
So, today market shows 2 possible patterns. One of them is big, while other is small.
Big is a potential butterfly "Sell" on 4-hour chart. Left wing has been formed already, right wing is in process. For butterfly it needs a bit deeper retracement, and one of the potential levels to watch is 0.618 Fib support at 1.4346.
Smaller pattern is Butterfly "buy" on hourly chart, with 1.27 target at the same 1.4346 area. I suppose, you've cought my idea, right?
Watch for 1.4346 today. If Butterfy "Buy" will be formed - use it to possess yourself in larger Butterfly "Sell". This gives you excellent risk/reward ratio'
Attachments
Sive Morten
Special Consultant to the FPA
- Messages
- 18,655
EUR/USD Daily Update, Thu 25, August 2011
Good morning,
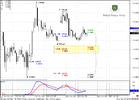
today analysis will be the same as yesterday, I suppose. On daily time frame market continue to stand in tight range and building and energy for tomorrow's Bernanker speech in Jackson Hole.
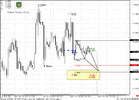
So, Today I will be watching over 1.4340-1.4355 area for a scalp Buy trade. This area includes 4-hour AB-CD target, 0.618 target of greater AB-CD, 0.618 Fib support and hourly 1.618 Butterfly Buy.
So, if market will reach it - I'll try to buy with stop somewhere below 1.4330.
The one thing that I do not want to see is a black nasty candles during right wing of Butterfly on hourly time frame. If this will be gradual move down as with left wing - that is what I want.
Yesterday market has not reached target of butterfly, so I was flat. Today could happen the same, but I will not be upset, since tomorrow this range will be broken, I suppose and we will get a direction for nearest time.
Good morning,
today analysis will be the same as yesterday, I suppose. On daily time frame market continue to stand in tight range and building and energy for tomorrow's Bernanker speech in Jackson Hole.
So, Today I will be watching over 1.4340-1.4355 area for a scalp Buy trade. This area includes 4-hour AB-CD target, 0.618 target of greater AB-CD, 0.618 Fib support and hourly 1.618 Butterfly Buy.
So, if market will reach it - I'll try to buy with stop somewhere below 1.4330.
The one thing that I do not want to see is a black nasty candles during right wing of Butterfly on hourly time frame. If this will be gradual move down as with left wing - that is what I want.
Yesterday market has not reached target of butterfly, so I was flat. Today could happen the same, but I will not be upset, since tomorrow this range will be broken, I suppose and we will get a direction for nearest time.
Attachments
Hello Sive,
I am followiwng your analysis for a while, and it is really very helpfull. For a better understanding of everything I would like to have more info about Butterfly and Gartley. Where can I find more details about it? Everything else is quit clear. Thank you.
I am followiwng your analysis for a while, and it is really very helpfull. For a better understanding of everything I would like to have more info about Butterfly and Gartley. Where can I find more details about it? Everything else is quit clear. Thank you.
Marketjoy Trader
Private, 1st Class
- Messages
- 81
Hello Sive,
I am followiwng your analysis for a while, and it is really very helpfull. For a better understanding of everything I would like to have more info about Butterfly and Gartley. Where can I find more details about it? Everything else is quit clear. Thank you.
Read Fibonacci Ratios with Pattern Recognition by Larry Pesavento
Similar threads
- Replies
- 0
- Views
- 43
- Replies
- 5
- Views
- 218
- Replies
- 7
- Views
- 763
- Replies
- 5
- Views
- 694
- Replies
- 6
- Views
- 503
- Forex, Gold, BTC Market Analysis | Trading Signals
- Sive Morten- Currencies, Gold, Bitcoin Daily Video