Sive Morten
Special Consultant to the FPA
- Messages
- 18,635
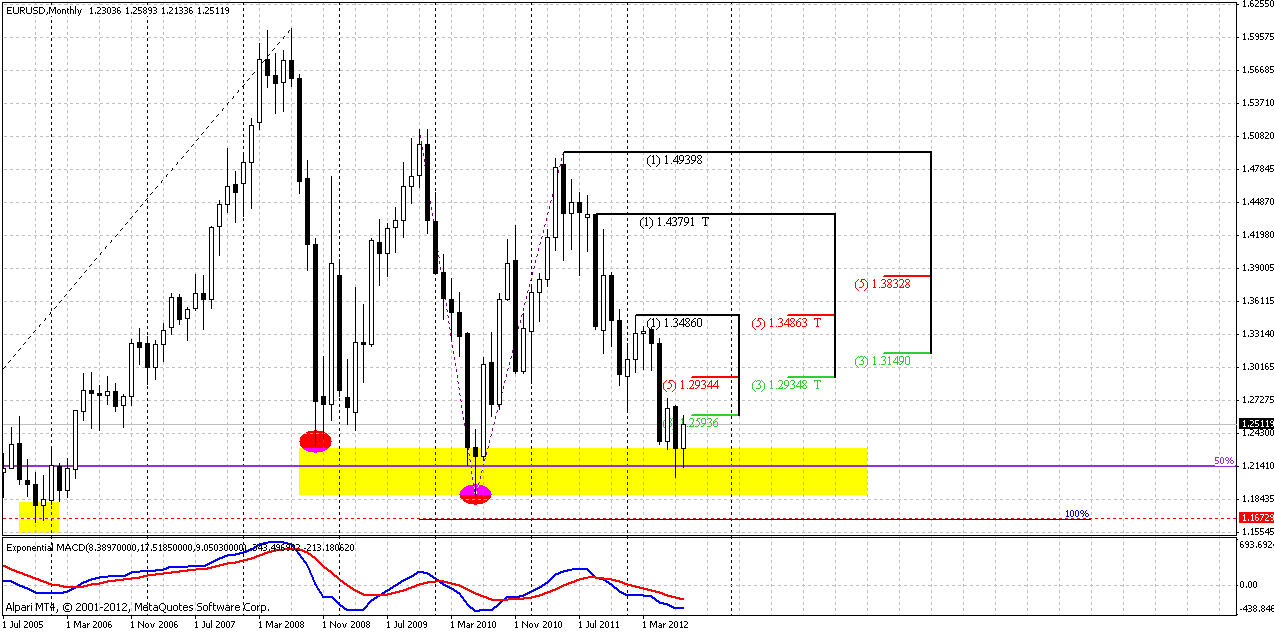
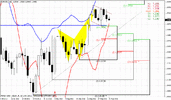
Monthly
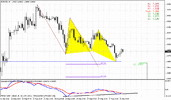
Monthly trend holds bearish. Price continues to force significant support area 1.19-1.23 that held EUR twice from collapse – first time in 2008 when sub-prime crisis has started and second – in 2010 at beginning of Greece turmoil.
Currently August continues to be an inside month to July, but now we see starting upward pullbackThis is not a surprise, if we recall what the level it is. This is 50% support of major EUR rally of all times 2000-2008 year. Although this level was penetrated previously in 2010, but looks like it is still valid. This is most powerful Fib support inside of 1.18-1.23 area.
Still, long-term bearish context still holds and target still is 1.16-1.17 area, based on analysis of quarterly chart of Dollar Index that we’ve made in Nov 2011. Index has 95% correlation with EUR/USD. Also this is AB=CD target of most recent pattern on current chart. Take a look – this is significant support of 2005 as well – marked by yellow rectangle.
By current bounce market has reached nearest Fib resistance at 1.2590 area. Current bearish context can hold move even to monthly K-resistance at 1.2950-1.3150 area.
In longer-term market is entering into very, say, “dangerous” area, and it comes to it not at oversold as it was two times previously. If it will break it – this will be the road to 1.07-1.10 area or ultimately even to parity.
So, major conclusion for us here is that market bounces from strong support and if it will pass though 1.26 – next area of monthly resistance is 1.30-1.31
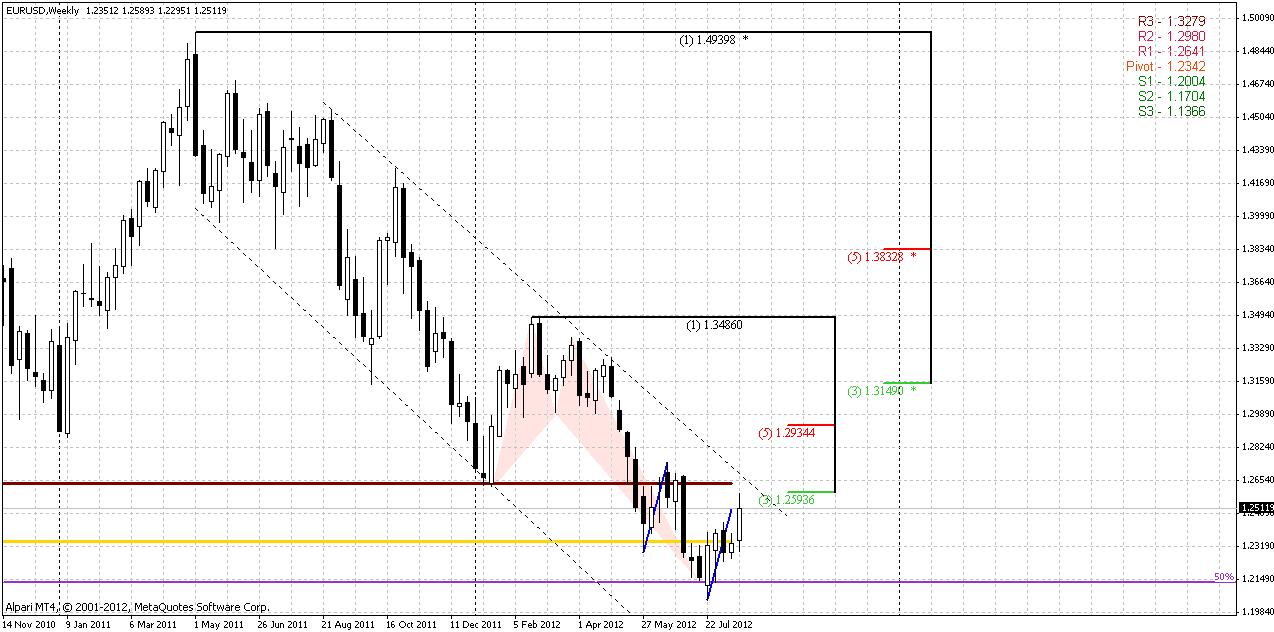
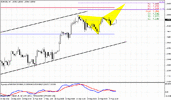
Weekly
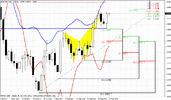
Now I’m looking at weekly chart and still can’t find any lead that could give us understadning how far current move up could be. Trend holds bullish here and market not at overbought. Blue line is a cloned previous retracement up and market currently has covered its distance already.
There are two things to discuss. From one point of you, that seems to me more important we have weekly butterfly “Buy” and bullish divergence right at major 50% monthly support. Such cobination assumes significant bounce per se.
From another point of you market does not show blistering upward action, butterfly’s minimum target, as 3/8 retracement has bit achieved... We know that usually if price is held by pivot resistance 1 – then it is probably just a retracement. So, market now is approaching to resistance – MPR1=1.2640, previous low resistance and Fib resistance around 1.2590-1.26. May be market will reach this area, but major question is – will it pass it?
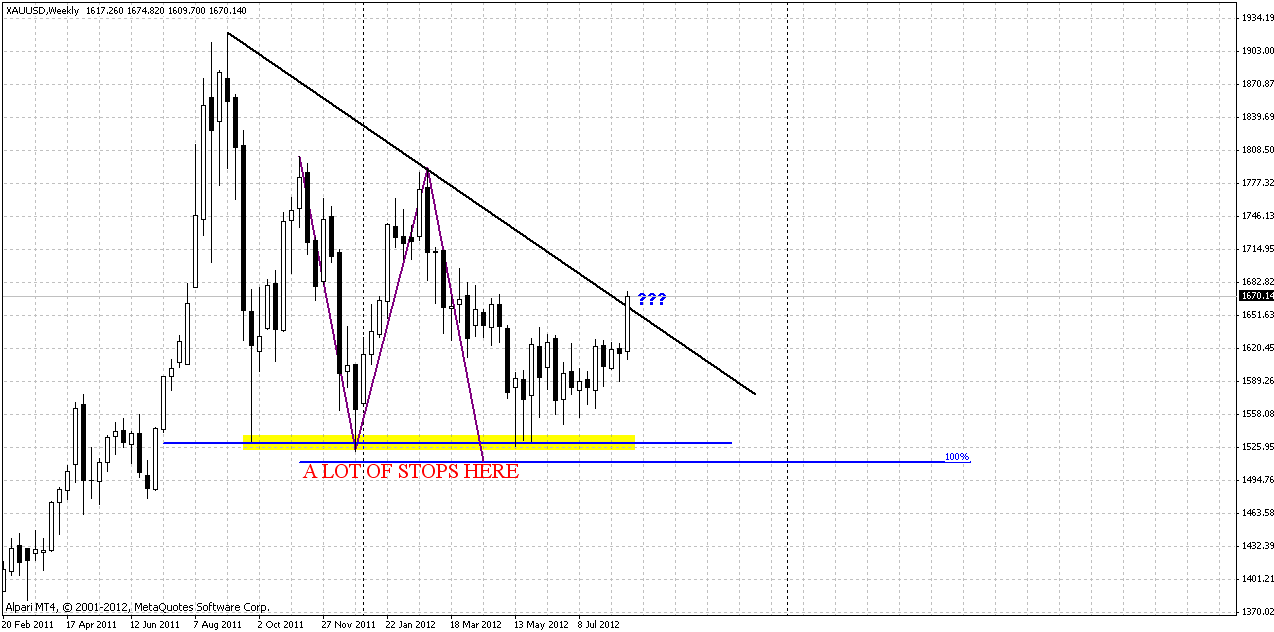
May be it will seem a bit curious for you, but I offer you to look at gold chart. You will better understand my confusion. First of all – gold never reverses smooth. This commodity likes to twist and turn and churn traders. On weekly chart we see clear support level with a lot of stops below it and Fib extension target that stands slightly below this level – perfect situation to see simulteniously completement of AB=CD and W&R, that could let you calmly open long position. In long-term perspectives I have bullish view on gold. It is seasonally bullish now (till early spring of 2013), pattern itself is bullish and fundamentally, with a lot of QE’s programms with negative interest rates support gold.
By this reasons I have some doubts about current breakout. That might become our life-jacket. If gold will return back inside of this triangle – it will lead to reversal on EUR/USD as well. And even more – it will probably lead to move to 1500 area. Hence, EUR USD will probably continue move down in term of monthly time frame.
But, if gold will hold – it could lead to Butterfly “Sell” appearing (try to find it without my assistance) and move to 2000 area. EUR in this case should show upward continuation. Unfortunately, it is difficult to say how long we will have to wait to get this clue.
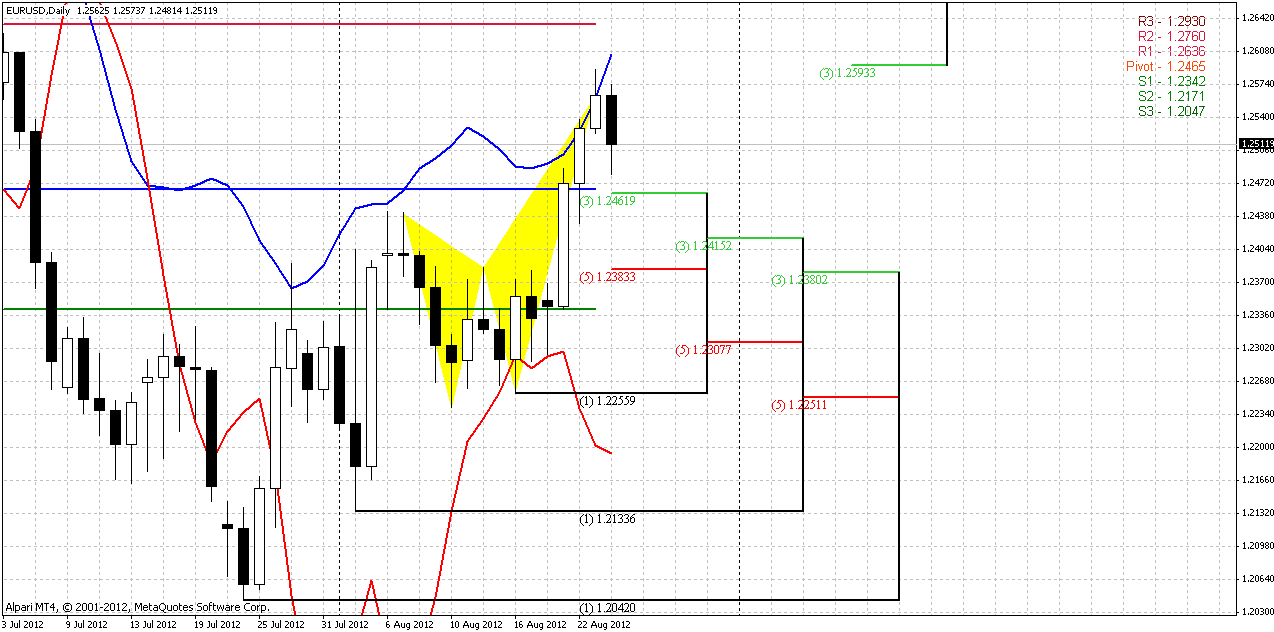
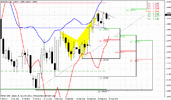
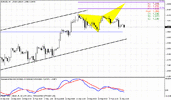
Daily
So, since we’ve got at least some prompt in medium-term perspective, let’s start with short-term trading plan.
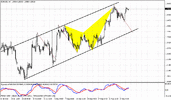
On daily time-frame trend is bullish, but market stands at overbought at Fib support 1.2590 – that gives us directional “Stretch” bearish pattern. Here is also butterfly reversal point and some other targets that we’ve discussed during previous week. Now we have also bearish engulfing pattern here. So, for bears, who want to trade the Stretch pattern trading plan looks simple – place stop above engulfing pattern.
Potential target of Stretch probably will be some strong support level that bulls should keep an eye on. Personally I like major 3/8 Confluence support + WPS1 1.2380-1.2383 and 1.2342 area. If market will break it down probability of upward continuation will decrease. Moving below WPS1 will be the sign that move down is not just retracement, and, this also could shift trend to bearish.
So, if you’re bullish – wait when market will show pullback and reach some of supports. First worthy area is 1.2340-1.2380
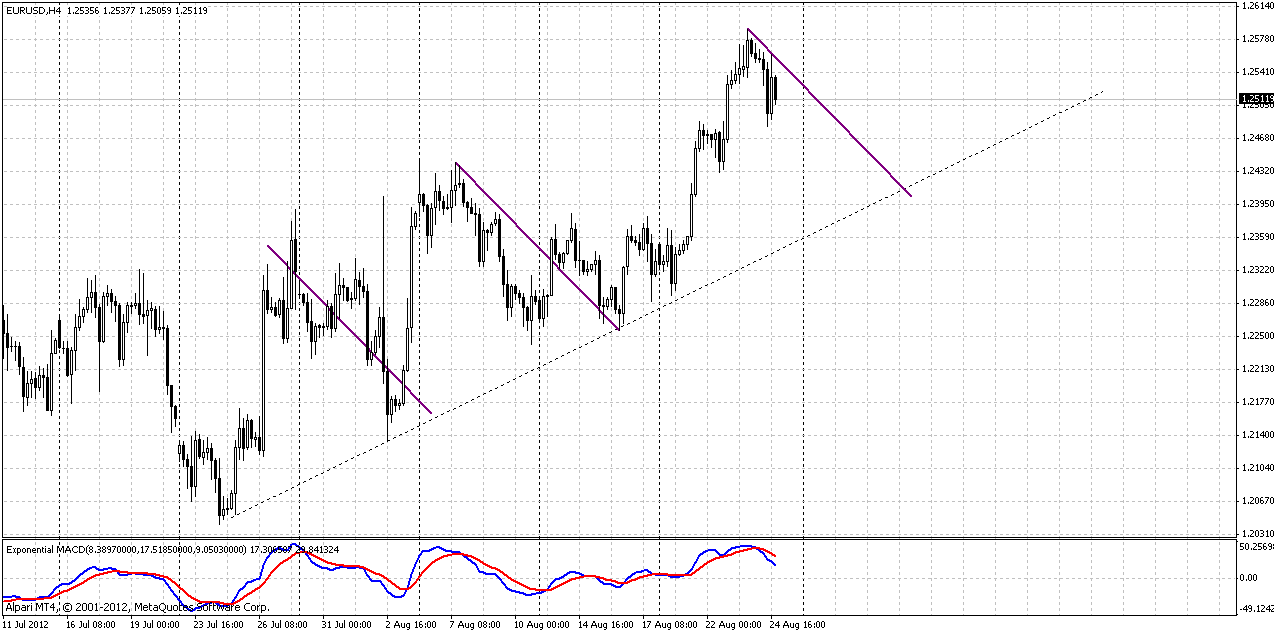
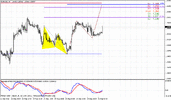
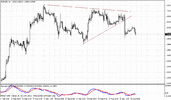
4-hour
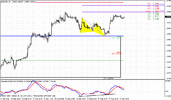
So, we’ve got some move down from resistance that we’ve specified. Actually on 4-hour chart I would like to tell about just two moments – trend has turned bearish, and, if market will hold the harmony of retracement, it should reach precisely an area of daily 1.2380 support. That also will be trend line support.
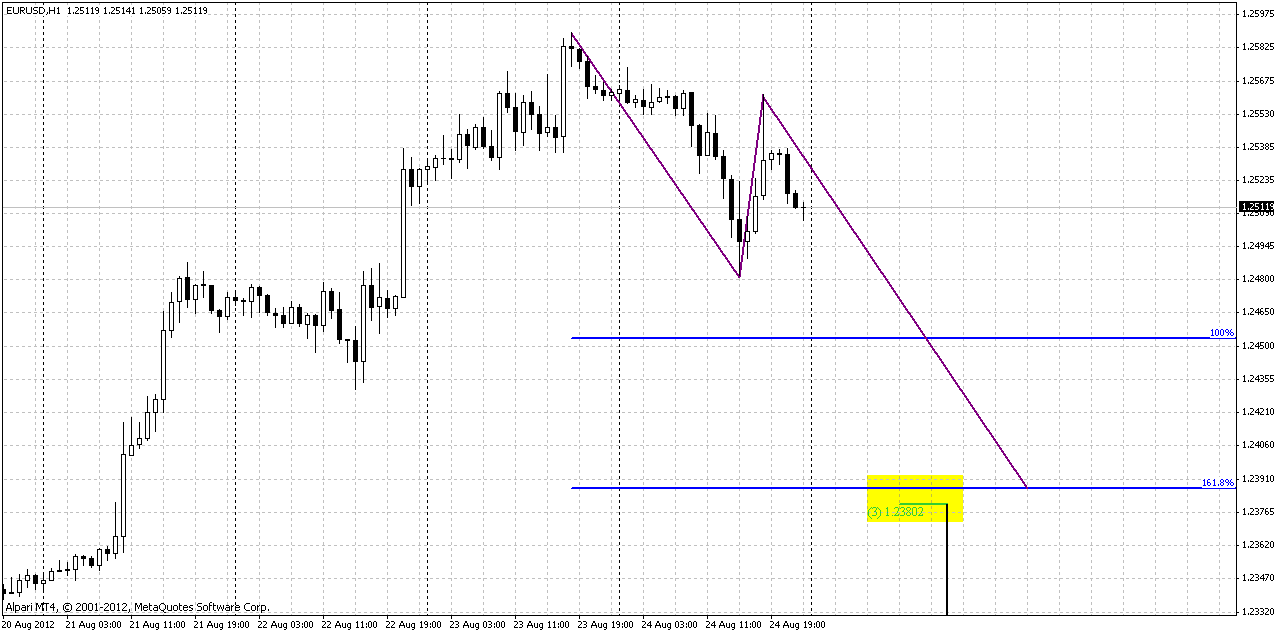
60-min
Hourly chart shows that this also an Agreement with current AB=CD 1.618 target point. At the same time, 1.0 target coinsides with WPP=1.2465 and nearest Fib support as well (take a look at daily chart). So, 1.2450 will be significant support as well. Still, since market at overbought – this will add more weight to downward move and I suppose that there is not bad chances to see 1.2380...
Conclusion:
Long-term bearish sentiment is still in play. Pullback that now in progress on monthly chart should not surprise us, if we take into consideration the level importance where this bounce has started. From long-term perspective, even move to 1.30 will not erase bearish context.
To not miss solution on weekly chart – keep an eye on gold market. If Gold will fail with current triangle breakout – EUR rally will over and we will see new leg down with creation of new lows probably.
In short-term perspective your action will depend on your view on market. Bears could try to trade Stretch pattern, while bulls should wait a pullback to enter long, since market at overbought and resistance.
The technical portion of Sive's analysis owes a great deal to Joe DiNapoli's methods, and uses a number of Joe's proprietary indicators. Please note that Sive's analysis is his own view of the market and is not endorsed by Joe DiNapoli or any related companies.
Monthly trend holds bearish. Price continues to force significant support area 1.19-1.23 that held EUR twice from collapse – first time in 2008 when sub-prime crisis has started and second – in 2010 at beginning of Greece turmoil.
Currently August continues to be an inside month to July, but now we see starting upward pullbackThis is not a surprise, if we recall what the level it is. This is 50% support of major EUR rally of all times 2000-2008 year. Although this level was penetrated previously in 2010, but looks like it is still valid. This is most powerful Fib support inside of 1.18-1.23 area.
Still, long-term bearish context still holds and target still is 1.16-1.17 area, based on analysis of quarterly chart of Dollar Index that we’ve made in Nov 2011. Index has 95% correlation with EUR/USD. Also this is AB=CD target of most recent pattern on current chart. Take a look – this is significant support of 2005 as well – marked by yellow rectangle.
By current bounce market has reached nearest Fib resistance at 1.2590 area. Current bearish context can hold move even to monthly K-resistance at 1.2950-1.3150 area.
In longer-term market is entering into very, say, “dangerous” area, and it comes to it not at oversold as it was two times previously. If it will break it – this will be the road to 1.07-1.10 area or ultimately even to parity.
So, major conclusion for us here is that market bounces from strong support and if it will pass though 1.26 – next area of monthly resistance is 1.30-1.31
Weekly
Now I’m looking at weekly chart and still can’t find any lead that could give us understadning how far current move up could be. Trend holds bullish here and market not at overbought. Blue line is a cloned previous retracement up and market currently has covered its distance already.
There are two things to discuss. From one point of you, that seems to me more important we have weekly butterfly “Buy” and bullish divergence right at major 50% monthly support. Such cobination assumes significant bounce per se.
From another point of you market does not show blistering upward action, butterfly’s minimum target, as 3/8 retracement has bit achieved... We know that usually if price is held by pivot resistance 1 – then it is probably just a retracement. So, market now is approaching to resistance – MPR1=1.2640, previous low resistance and Fib resistance around 1.2590-1.26. May be market will reach this area, but major question is – will it pass it?
May be it will seem a bit curious for you, but I offer you to look at gold chart. You will better understand my confusion. First of all – gold never reverses smooth. This commodity likes to twist and turn and churn traders. On weekly chart we see clear support level with a lot of stops below it and Fib extension target that stands slightly below this level – perfect situation to see simulteniously completement of AB=CD and W&R, that could let you calmly open long position. In long-term perspectives I have bullish view on gold. It is seasonally bullish now (till early spring of 2013), pattern itself is bullish and fundamentally, with a lot of QE’s programms with negative interest rates support gold.
By this reasons I have some doubts about current breakout. That might become our life-jacket. If gold will return back inside of this triangle – it will lead to reversal on EUR/USD as well. And even more – it will probably lead to move to 1500 area. Hence, EUR USD will probably continue move down in term of monthly time frame.
But, if gold will hold – it could lead to Butterfly “Sell” appearing (try to find it without my assistance) and move to 2000 area. EUR in this case should show upward continuation. Unfortunately, it is difficult to say how long we will have to wait to get this clue.
Daily
So, since we’ve got at least some prompt in medium-term perspective, let’s start with short-term trading plan.
On daily time-frame trend is bullish, but market stands at overbought at Fib support 1.2590 – that gives us directional “Stretch” bearish pattern. Here is also butterfly reversal point and some other targets that we’ve discussed during previous week. Now we have also bearish engulfing pattern here. So, for bears, who want to trade the Stretch pattern trading plan looks simple – place stop above engulfing pattern.
Potential target of Stretch probably will be some strong support level that bulls should keep an eye on. Personally I like major 3/8 Confluence support + WPS1 1.2380-1.2383 and 1.2342 area. If market will break it down probability of upward continuation will decrease. Moving below WPS1 will be the sign that move down is not just retracement, and, this also could shift trend to bearish.
So, if you’re bullish – wait when market will show pullback and reach some of supports. First worthy area is 1.2340-1.2380
4-hour
So, we’ve got some move down from resistance that we’ve specified. Actually on 4-hour chart I would like to tell about just two moments – trend has turned bearish, and, if market will hold the harmony of retracement, it should reach precisely an area of daily 1.2380 support. That also will be trend line support.
60-min
Hourly chart shows that this also an Agreement with current AB=CD 1.618 target point. At the same time, 1.0 target coinsides with WPP=1.2465 and nearest Fib support as well (take a look at daily chart). So, 1.2450 will be significant support as well. Still, since market at overbought – this will add more weight to downward move and I suppose that there is not bad chances to see 1.2380...
Conclusion:
Long-term bearish sentiment is still in play. Pullback that now in progress on monthly chart should not surprise us, if we take into consideration the level importance where this bounce has started. From long-term perspective, even move to 1.30 will not erase bearish context.
To not miss solution on weekly chart – keep an eye on gold market. If Gold will fail with current triangle breakout – EUR rally will over and we will see new leg down with creation of new lows probably.
In short-term perspective your action will depend on your view on market. Bears could try to trade Stretch pattern, while bulls should wait a pullback to enter long, since market at overbought and resistance.
The technical portion of Sive's analysis owes a great deal to Joe DiNapoli's methods, and uses a number of Joe's proprietary indicators. Please note that Sive's analysis is his own view of the market and is not endorsed by Joe DiNapoli or any related companies.
")