Sive Morten
Special Consultant to the FPA
- Messages
- 18,648
Monthly
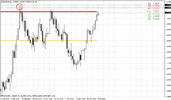
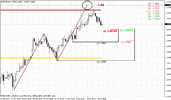
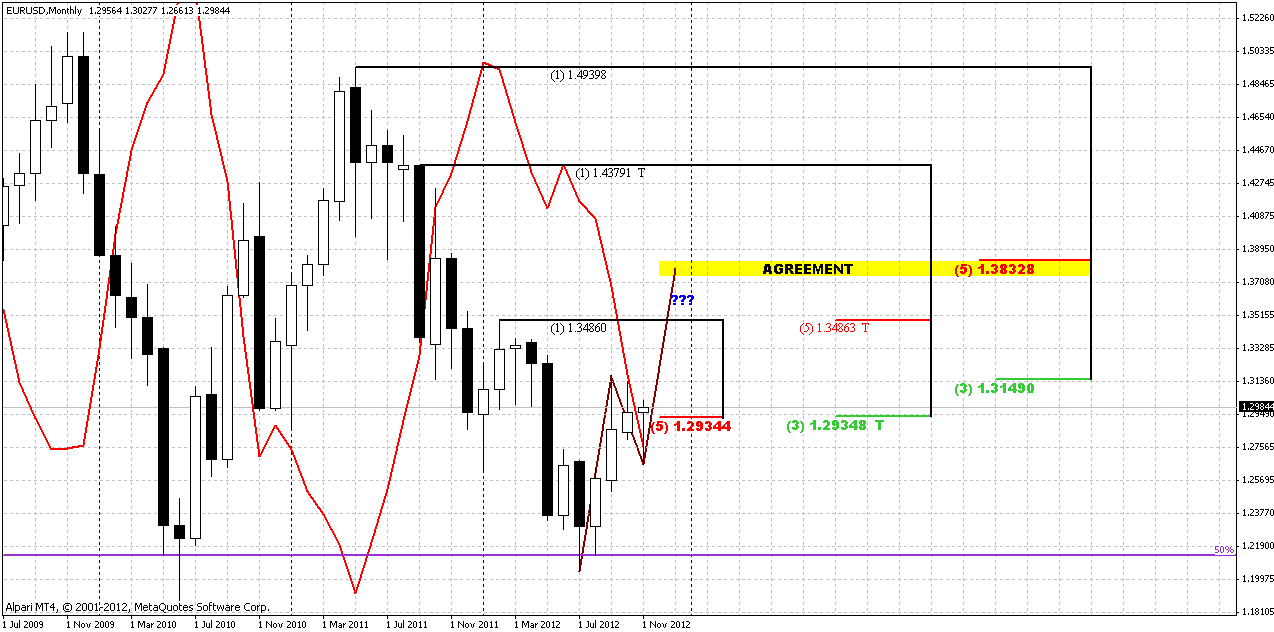
As we’ve mentioned on previous week – there was a really time of change on monthly chart during previous couple of weeks. Now we can point that monthly trend has turned bullish. This significantly changes overall perspectives. Still, market stands in K-resistance area of 1.2934-1.3149 and hasn’t broken it yet. As a potential bullish scenario we could get lightning bolt AB-CD right to 1.38 Agreement.
But what are the risks? I see currently only one – if K-area will hold price action. In this case market should form solid black candle. If simultaneously trend will shift bearish again – this will be a kind of 2-period stop grabber and strong bearish signal. But it hardly will happen unexpectedly. We definitely will see some bearish development on lower time frames before that.
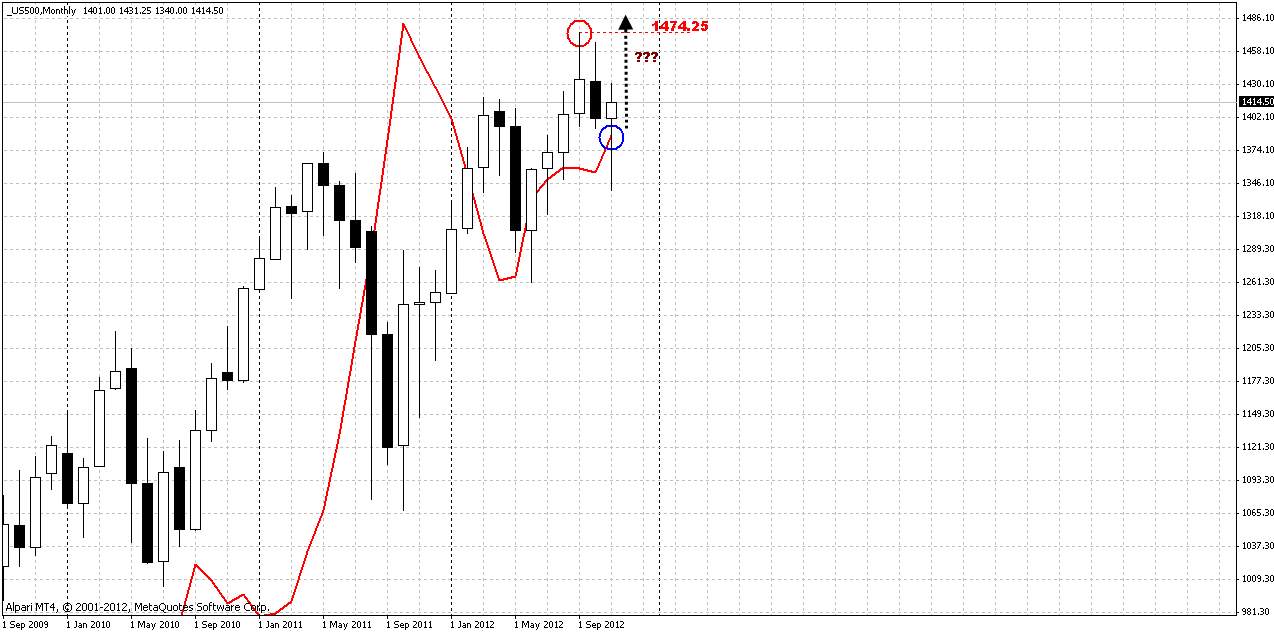
Also I would like to show you this nice bullish stop grabber on monthly S&P 500 index.
Weekly
I suppose that weekly chart again will be foundation for all our work within coming week. Recall that on previous weekend, after not very successful trading week, we’ve stated that since fundamental picture is tough – as in EU as in US data shows not impressive dynamic, so that competition stands not about those who have better data, but among those who have not so bad data as counterparty, we’ve suggested that better to follow long-term technical picture. At the same time following should be not blind – our major work is to search patterns that stand in a row with it, use it to enter in the same direction. Patterns are necessary, since they allow reduce our risk. And this tactics has given result on previous week. We’ve entered only in the same direction as weekly chart points.
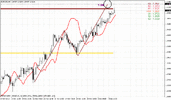
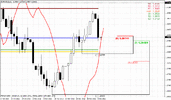
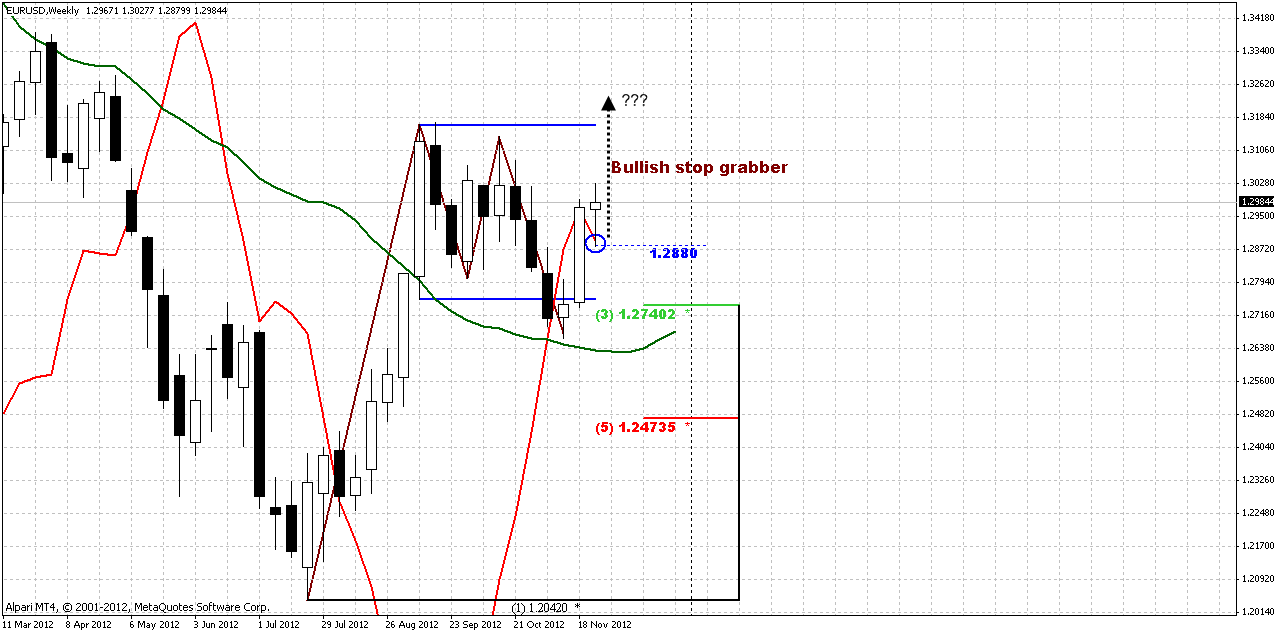
Now probably we should continue with it, especially because weekly time frame gives us more and more signs of potential upward continuation. The first chart is almost the same as on previous week, but with some details. Here we again see support that has come from 25x5 DMA – market initially has broken it and retested then from the other side. On weekly chart of EUR/USD there never was failure breakout of 25x5 by the way. Simultaneously we have bullish Gartley “222” Buy pattern. The specific of this pattern is that market has shown only 3/8 retracement on BC leg right to 25x5. Shallow retracement hints on bullish power.
Now we have new monthly pivots for December. MPR1=1.3121 creates solid barrier above and tandem with 3/8 resistance 1.3149 that has been tested already once. MPP stands at 1.2891, so we have to be ready for possible retracement to it sometime within December.
Minimum potential target is 0.618 extension around 1.3360 – and take a look, it stands above previous highs. But how we could get there with strong resistance above? Take a look at second chart…
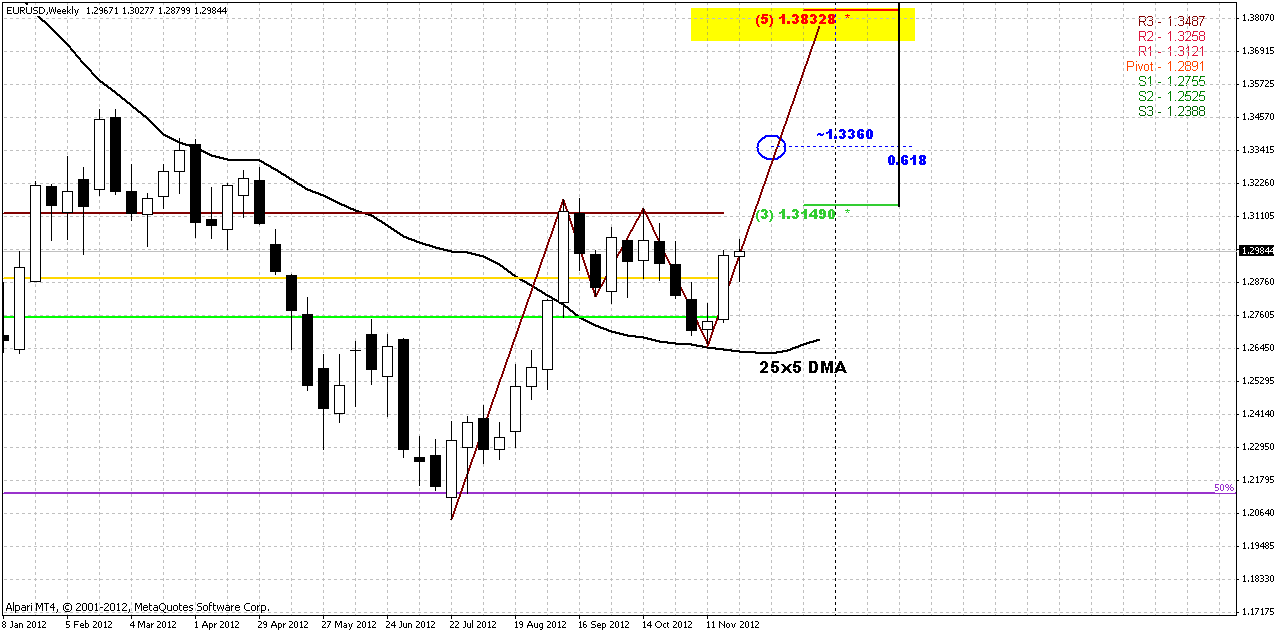
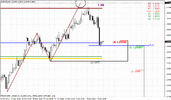
That is a bullish stop grabber. Although I like a bit different looking stop grabbers, but still, we can take this one too. Besides, we do not have anything else right now. This pattern can explain how we can get right above previous highs...
Besides, this pattern gives us huge advantage – it gives us tradable swing for daily time frame, since its invalidation point is it’s low at 1.2880. Once market will take it out – stop grabber will fail. Another significant moment is that new MPP stands slightly higher, so if even market will show pullback to it, there are some chances that stop grabber will survive.
Daily
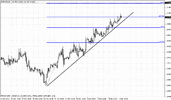
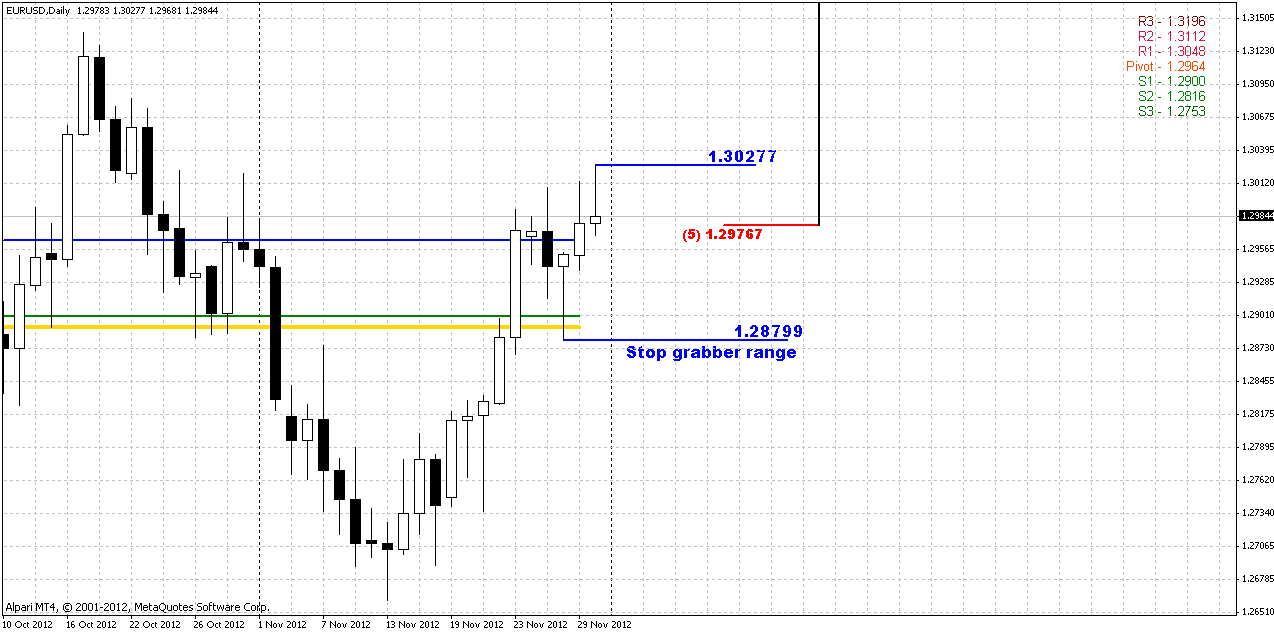
On daily time frame there are no patterns yet, so here I just show you our range for work within weekly stop grabber pattern. Trend holds bullish here, market is not at overbought. Take a note that inside of this range we have two significant support areas besides of Fib levels. First one is WPP at 1.2964, second is tandem of MPP and WPS1 at 1.2890-1.29 area. They will probably become potential areas to watch for long entry.
4-hour
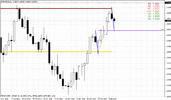
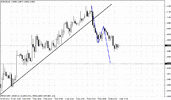
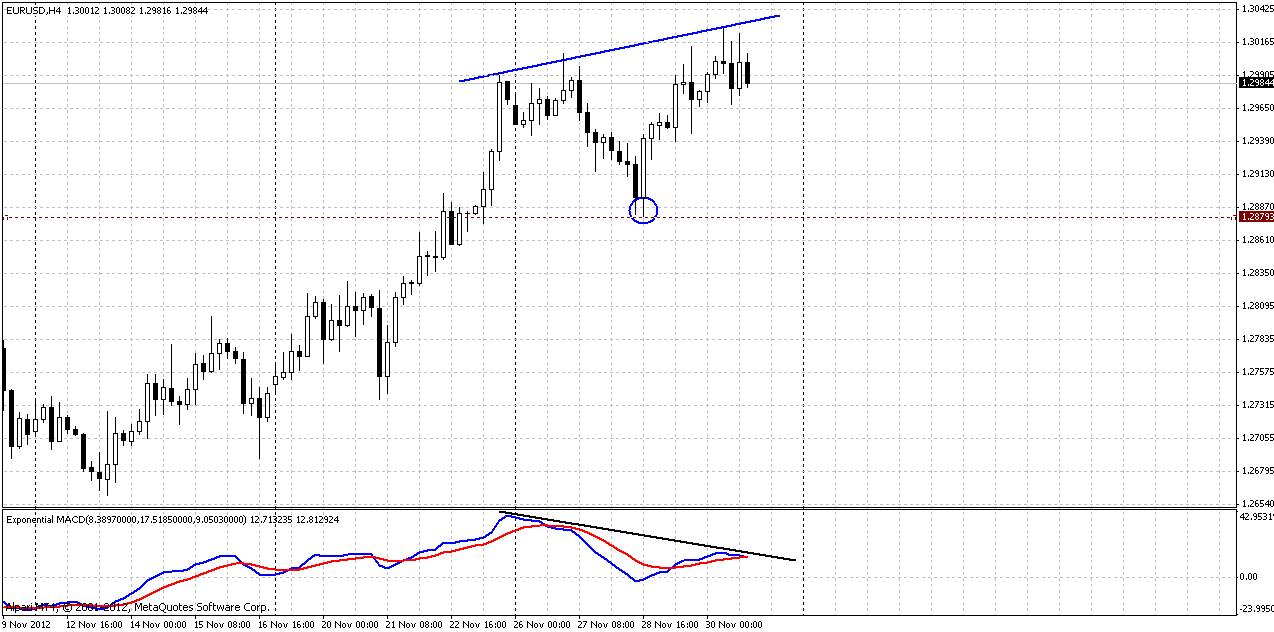
On Friday we’ve discussed possibility for Double Top pattern here. Although market has shown intention couple of time to start move down – it has not happened yet. The shape of potential pattern has changed a bit. To say, I prefer to see sharper slopes of the Tops, but here they a bit extended in time. Anyway, here we can note just single conclusion: if this will be Double Top, then it will lead to failure of weekly stop grabber, because it suggests much deeper move below the neckline. The neckline, in turn is a stop grabber invalidation point. May be we will be able foresee it by the speed of downmove on second after second top. If it will be very fast with solid bars down – it will be worry sign. If it will be gradual and choppy, then it will better remind retracement and add points to stop grabber.
1-hour
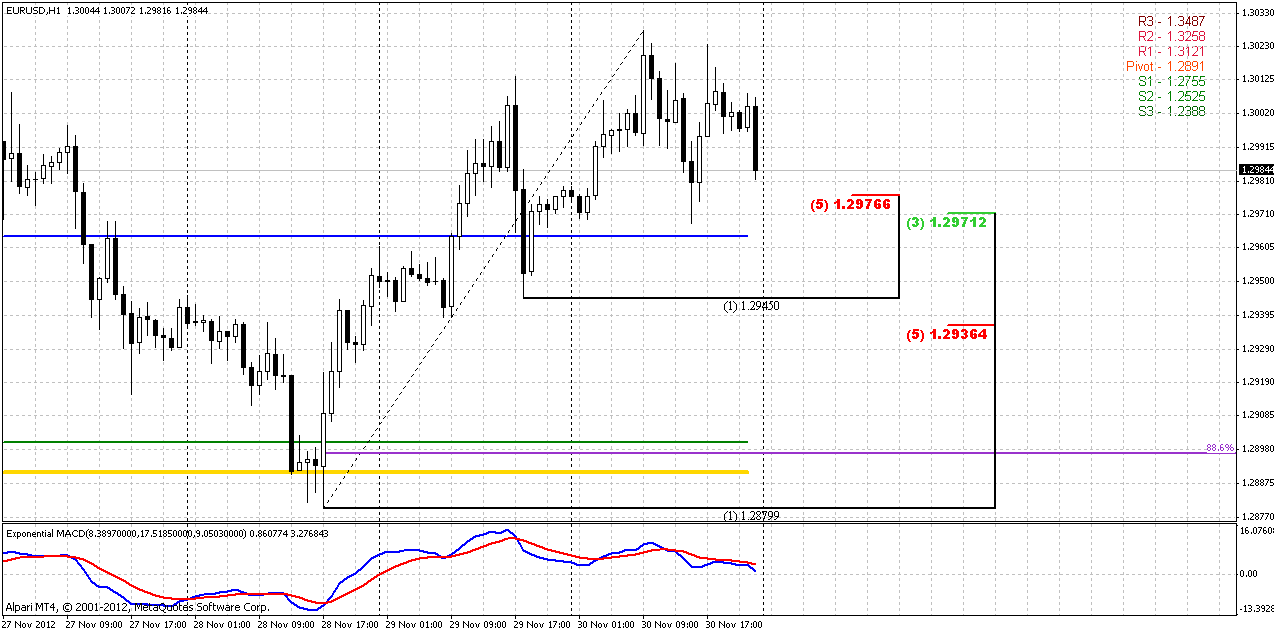
Here we can see some fib levels that come in play around pivot points. First of all is hourly K-support area around WPP. MPP and WPS1 in turn, stand close to deep 88.6% Fib support.
Current price action reminds a bit H&S pattern, but looks goofy – too skewed, no ratios executed between tops and shoulders – looks not very fascinating.
Conclusion:
Previously we’ve said that although market is showing thrilling changes on long-term charts, and potentially they are very attractive, overall situation is very difficult and it’s quite uneasy to take into consideration all parts of puzzle. In such sort of environment, may be we should move with direction of these changes, but controlling our risk by sticking with particular patterns on lower time frames. That should let us flow with the market and take advantage with unexpected possible acceleration. Probably we will hold this tactics on current week too.
The technical portion of Sive's analysis owes a great deal to Joe DiNapoli's methods, and uses a number of Joe's proprietary indicators. Please note that Sive's analysis is his own view of the market and is not endorsed by Joe DiNapoli or any related companies.
As we’ve mentioned on previous week – there was a really time of change on monthly chart during previous couple of weeks. Now we can point that monthly trend has turned bullish. This significantly changes overall perspectives. Still, market stands in K-resistance area of 1.2934-1.3149 and hasn’t broken it yet. As a potential bullish scenario we could get lightning bolt AB-CD right to 1.38 Agreement.
But what are the risks? I see currently only one – if K-area will hold price action. In this case market should form solid black candle. If simultaneously trend will shift bearish again – this will be a kind of 2-period stop grabber and strong bearish signal. But it hardly will happen unexpectedly. We definitely will see some bearish development on lower time frames before that.

Also I would like to show you this nice bullish stop grabber on monthly S&P 500 index.

Weekly
I suppose that weekly chart again will be foundation for all our work within coming week. Recall that on previous weekend, after not very successful trading week, we’ve stated that since fundamental picture is tough – as in EU as in US data shows not impressive dynamic, so that competition stands not about those who have better data, but among those who have not so bad data as counterparty, we’ve suggested that better to follow long-term technical picture. At the same time following should be not blind – our major work is to search patterns that stand in a row with it, use it to enter in the same direction. Patterns are necessary, since they allow reduce our risk. And this tactics has given result on previous week. We’ve entered only in the same direction as weekly chart points.
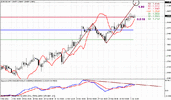
Now probably we should continue with it, especially because weekly time frame gives us more and more signs of potential upward continuation. The first chart is almost the same as on previous week, but with some details. Here we again see support that has come from 25x5 DMA – market initially has broken it and retested then from the other side. On weekly chart of EUR/USD there never was failure breakout of 25x5 by the way. Simultaneously we have bullish Gartley “222” Buy pattern. The specific of this pattern is that market has shown only 3/8 retracement on BC leg right to 25x5. Shallow retracement hints on bullish power.
Now we have new monthly pivots for December. MPR1=1.3121 creates solid barrier above and tandem with 3/8 resistance 1.3149 that has been tested already once. MPP stands at 1.2891, so we have to be ready for possible retracement to it sometime within December.
Minimum potential target is 0.618 extension around 1.3360 – and take a look, it stands above previous highs. But how we could get there with strong resistance above? Take a look at second chart…

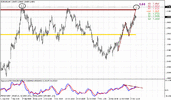
That is a bullish stop grabber. Although I like a bit different looking stop grabbers, but still, we can take this one too. Besides, we do not have anything else right now. This pattern can explain how we can get right above previous highs...
Besides, this pattern gives us huge advantage – it gives us tradable swing for daily time frame, since its invalidation point is it’s low at 1.2880. Once market will take it out – stop grabber will fail. Another significant moment is that new MPP stands slightly higher, so if even market will show pullback to it, there are some chances that stop grabber will survive.

Daily
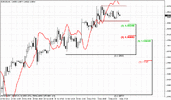
On daily time frame there are no patterns yet, so here I just show you our range for work within weekly stop grabber pattern. Trend holds bullish here, market is not at overbought. Take a note that inside of this range we have two significant support areas besides of Fib levels. First one is WPP at 1.2964, second is tandem of MPP and WPS1 at 1.2890-1.29 area. They will probably become potential areas to watch for long entry.

4-hour
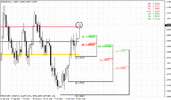
On Friday we’ve discussed possibility for Double Top pattern here. Although market has shown intention couple of time to start move down – it has not happened yet. The shape of potential pattern has changed a bit. To say, I prefer to see sharper slopes of the Tops, but here they a bit extended in time. Anyway, here we can note just single conclusion: if this will be Double Top, then it will lead to failure of weekly stop grabber, because it suggests much deeper move below the neckline. The neckline, in turn is a stop grabber invalidation point. May be we will be able foresee it by the speed of downmove on second after second top. If it will be very fast with solid bars down – it will be worry sign. If it will be gradual and choppy, then it will better remind retracement and add points to stop grabber.

1-hour
Here we can see some fib levels that come in play around pivot points. First of all is hourly K-support area around WPP. MPP and WPS1 in turn, stand close to deep 88.6% Fib support.
Current price action reminds a bit H&S pattern, but looks goofy – too skewed, no ratios executed between tops and shoulders – looks not very fascinating.

Conclusion:
Previously we’ve said that although market is showing thrilling changes on long-term charts, and potentially they are very attractive, overall situation is very difficult and it’s quite uneasy to take into consideration all parts of puzzle. In such sort of environment, may be we should move with direction of these changes, but controlling our risk by sticking with particular patterns on lower time frames. That should let us flow with the market and take advantage with unexpected possible acceleration. Probably we will hold this tactics on current week too.
The technical portion of Sive's analysis owes a great deal to Joe DiNapoli's methods, and uses a number of Joe's proprietary indicators. Please note that Sive's analysis is his own view of the market and is not endorsed by Joe DiNapoli or any related companies.
