Forex FOREX PRO WEEKLY, December 03 - 07, 2018

Personally I will be looking at price action carefully to gauge how price progresses up and to what extent such progress confirms bullish view.
Yep. I always look for progression as well. Now we have "222" Sell on EUR and this is still a question what we will get in result.
I also keep in mind weekly bearish grabber. It has no relation to EW count, but it is important in DiNapoli context.
 
Morning guys,

Situation on EUR is very interesting. Some positive news have come recently on US-China agreement on mutual trading and tariffs. China said that it is mostly focused on buying US goods and even agrees to purchase big amount of agriculture products. But, still tariffs that were initiated before are still working. And the positive charge could exhaust fast. So, although we expect some upside continuation within 1-2 session but we do not sure that real upside breakout of 1.15 area will happen.

From the technical point of view, we still keep in mind bearish grabber guys, massive suprising sell-off that happens from time to time here and irrational price action with our reverse H&S pattern. Thus, we do not exclude chances that market will form "222" Sell here and weekly grabber will start to work...
eur_d_04_12_18.png


On 1H chart this action could take the shape of butterfly "sell". Currently we could suggest "222" pattern here as well, but, on dollar index we have two side-by-side grabber which suggest further action above the top. This lets us focus on butterfly rather than on "222" pattern.
eur_1h_04_12_18.png


That's being said, positive background could hold within 1-2 sessions, or till NFP release, and market could reach 1.1440 area, but we still keep on the table bearish scenario as well, and completion of AB=CD pattern at 1.1440 should become critical point for further direction.
 
Not a good sign for the bulls, closed 1 pip below yesterdays close, however still above monthly and weekly close at 1.1322.

As I posted last week ”November and the week closed lower, 1.1322 (London close time). There is a good chance the lows will be tested this week.”
The Problem is to find out the timing.
B993489C-5228-4C2C-A61D-DF28A5977E5C.png
 
Greetings everybody,

It looks like that our doubts on upside perspective are not in vain. Indeed we've got minor upside continuation above recent top, so dollar index grabbers have been completed, but price has failed proceed above 1.15.

Our "222" Sell pattern has been formed, although downside reversal was a bit earlier than we've suggested.
Anyway, overall price action here doesn't match normal bullish market. Although we do not yet final confirmation on paper, as price stands above 1.1280 lows still and H&S has not been crushed totally. But, things that we see right now tell about it at high degree.

It means that now we have chain of downside targets and the first one is AB=CD @ 1.12 lows.
eur_d_05_12_18.png


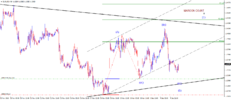
On 4H chart is another pattern that could be formed later with 1.1146 target. This is butterfly. Also take a look that EUR was not able to reach minor COP target:
eur_4h_05_12_18.png


On 1H chart we have big triangle, which actually is just a pennant pattern on weekly. That's the reason why price has not quite reached 1.1440 1.27 butterfly target. So, here we're watching for two moments - drop below "C" point within few hours and breaking of triangle down should become important steps in confirmation of our bearish scenario. Thus, currently it is difficult to find any reasons to go long.
eur_1h_05_12_18.png
 
Morning guys,

Hold your Breath time. Price certainly hasn't thrust decisively past 1.1440 but I still think it will get there this week (maybe even today) , probably after a small move down towards Sive's lower trend line on the hourly.
Of course this is but speculation, as Stag says only price action will prove if a wave count is correct. But I remain long and risk free so still smiling !
 

Attachments

  • EURUSDM30 ar 18 12 05.png
    EURUSDM30 ar 18 12 05.png
    47.7 KB · Views: 1
Morning guys,

Hold your Breath time. Price certainly hasn't thrust decisively past 1.1440 but I still think it will get there this week (maybe even today) , probably after a small move down towards Sive's lower trend line on the hourly.
Of course this is but speculation, as Stag says only price action will prove if a wave count is correct. But I remain long and risk free so still smiling !

Great analyze, Gwynfor! Agree completely with your view, this is also what I expect to happen. Will post it shortly.
 
Update on EUR. I see this drop only as retracement which is already completed. My trading plan is to go long immediately against 1.1266 low and seek higher targets. On 4H chart I believe we are in 1-2-1-2 move with wave 2 already finished or about to finish which means bullish wave 3 of wave 3 is about to start which should be very powerful and impulsive to the upside. This plan provides great risk/reward ratio, over 1:5. I am completely bullish on EUR as long as 1.1266 support holds.

WEEKLY CHART:

View attachment 40624

DAILY CHART:

View attachment 40625

4H CHART:

View attachment 40626

15 MIN CHART:

View attachment 40627

How to trade this?

Long entry in zone = 1.1310-1.1340, SL=1.1265, TP1 zone = 1.1524-1.1593; TP2 zone = 1.1593-1.1940

Update on EUR.

I believe we are witnessing complex, extended ABC correction in wave 2 which I expect to finish in 1.1280-1.1310 zone, and then bullish wave 3 could start. Nothing has changed and I keep my bullish view intact as long as 1.1266 support holds.

4H CHART:

EURUSDkH4.png


1H CHART:

EURUSDkH1.png
 
Morning guys,

Currently I do not see some inner direction on EUR, its just floated by external, mostly political factors. First it was J. Powell words - up, then risk aversion before G 20 - down, then US-China relief - up again, yesterday inverse interest rate curve - down etc...So recent action stands chaotic without clear patterns and valuable setups. When you do not see anything on lower time frames - you turn and govern by higher time frames:
eur_1h_06_12_18.png


On higher time frames - we've got daily bullish grabber, but it is not confirmed by dollar index. There we have nothing. It means that it is not very reliable. Besides, as I've said previously, daily/weekly setup looks bearish to me. Weekly grabber, inability of the market to proceed upside action that has started pretty nice and strong. Recent action mostly reminds bearish dynamic pressure. Thus, I mostly grabitate to bearish view guys and AB=CD pattern down to previous 1.12 lows. Bullish market should behave differently.
eur_d_06_12_18.png
 
Just putting in my two cents, valid as long as 1.1267 holds as support (partial labeling shown).

View attachment 40623

Taking into consideration the shape and internal structure of the decline off the 1.1815 peak, we can say that price action looks more neutral than bearish at this stage. On the short term prices went higher, but the scenario above proved to be incorrect.

The advance from 1.1267 looks corrective in nature and a weakness below 1.13054 would be troubling to a bullish outlook and a break of 1.1267 may continue below 1.1215. Note that price action may remain flat even if it goes above 1.1420.

No clear direction yet.
 
Back
Top