EUR/USD Daily Update, Fri 09, December 2011
Good morning,
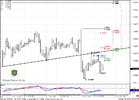
Current situation on daily time frame becomes more and more bearish with reestablishing of creating Dynamic pressure and solid close below as monthly as weekly pivot points. Although we still can't exclude possibility of AB=CD retracement, but now it's odds becomes blur.
Second pattern, that could appear on daily time frame if market still will show some small retracement up is butterfly "buy".
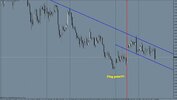
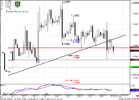
On 4 hour time frame trend is bearish. We see breakout of low border of trianlge and retesting it from downside after hitting of AB=CD target around 1.33
Potentially we can see Gartley "222" pattern. It clearly seen on hourly chart.
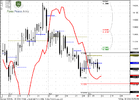
Hourly trend is bullish. AB=CD will create Agreement with hourly K-resistance and trend line.
This is an area for bears to search Sell signals.
If you're bullish - then your confirmation will be taking out the high at 1.3460 and returning back into triangle body. In this case, we probably could say that this was a fake out. But taking into consideration current price action the probability of that is not too much.