9 AM and the market has failed to break resistance
Sive,
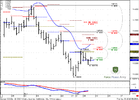
I am very new to Dinapoli although the technical analysis and connecting the Fibs in an ABCD fashion appeals to my engineering background. As of 9 AM the market has failed to break below the strong resistance @ 1.3200 with any substance. What is needed to confirm a a buying opportunity in the EUR/USD in a new uptrend. I have seen mention of displaced MAs though I am not sure whether to displace it forward or backwards. Any help or guidance from you is much appreciated.
Sive,
I am very new to Dinapoli although the technical analysis and connecting the Fibs in an ABCD fashion appeals to my engineering background. As of 9 AM the market has failed to break below the strong resistance @ 1.3200 with any substance. What is needed to confirm a a buying opportunity in the EUR/USD in a new uptrend. I have seen mention of displaced MAs though I am not sure whether to displace it forward or backwards. Any help or guidance from you is much appreciated.
")