ochills
Master Sergeant
- Messages
- 278
Good work Sive. thanks
Hi Sive,
compliment of the season in advance and to all FPA members,staffs and all forum members.
Pls I have 4 questions.
1. Can one use only Gartely AB-CD for entering and exit of a trade? if yes how can this be done?
2. Presently am reading Joe Dinapoli ebook. pls how can I determine the logical profit objective(M) i.e an exit point for profit as identify by Dinapoli in his book.
3. Base on your experience in the market can one enter the mark as soon as a double repo is formed or wait for retracement b4 pulling the trigger. and does this apply to BB & W&R
4.finally, pls what is fibnodes and daily confluence point and how can it be determine.
thanks in anticipation for your reply as usual.
thanks.
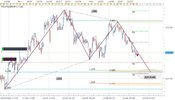
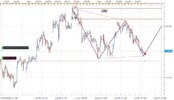
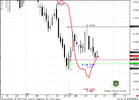
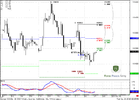
") great analysis ...
great analysis ...