Sive Morten
Special Consultant to the FPA
- Messages
- 18,648
Monthly
On the previous week, we’ve said that from fundamental analysis EUR seems overvalued above 1.3750-1.38 area. Seems our conclusion was correct and EUR/USD has shown solid move down during previous week.
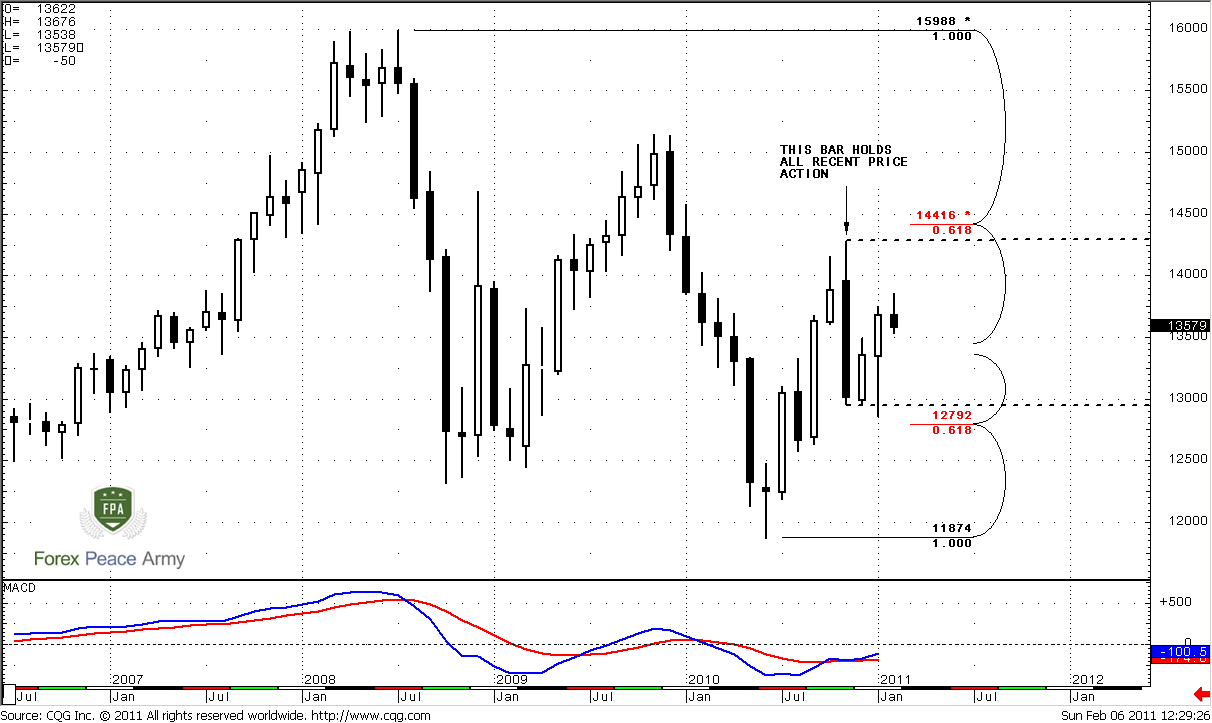
Although Trend holds bullish, market still stuck with the range of a huge nasty bar. This is quite common, when after strong move market stands in their range for some time. Currently we see it on monthly time frame. And speaking in terms of monthly time frame – we can call some event as “meaningful” only when market will move beyond the borders that I’ve pointed on the chart. Before that will happen only lower time frames analysis will be more interesting for us.
Nevertheless, the nearest upside target is 0.618 Fib expansion is at 1.4354 that creates an Agreement with 5/8 Fib resistance at 1.4416.
Weekly
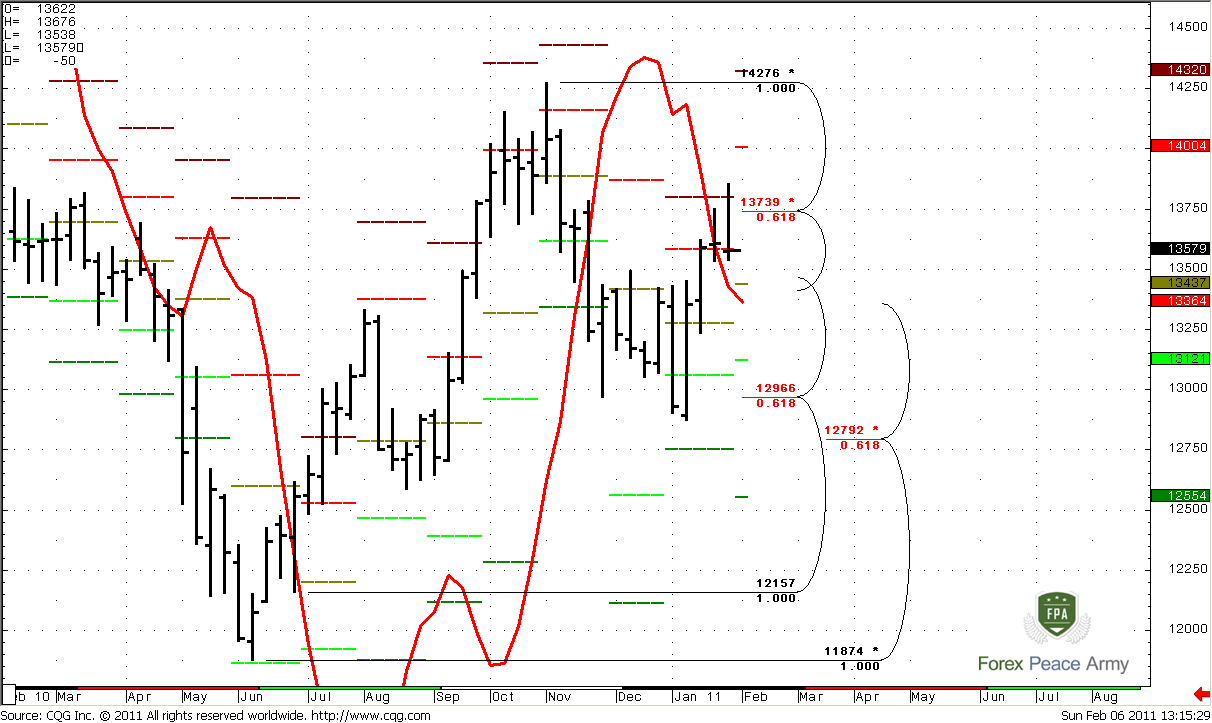
Trading action from weekly time perspective is very shallow. Trend is formally bullish, we see second doji in a row. May be it’s possible to treat them as “gravestone doji”, but for that purpose they should be a bit higher, not so deep inside the body of previous candle.
Second moment that attracts my attention is a close level of previous week – it’s very near to the low of the week. This is a bearish sign.
Anyway, I do not see any significant patterns and signals to trade on weekly time frame. May be we will see dynamic pressure with MACDP indicator after sometime. Although we already see that trend turns bullish, but price action is not and stands tight during the recent couple weeks, I think that this is too few bars to speak about dynamic pressure. But some bearish sign are started to appear.
Now let’s point significant levels. Just above the market 5/8 Fib resistance at 1.3739 that has been tested already and I think that it’s not so strong currently. 1.4004 – monthly pivot resistance 1.
Supports stand at 1.3447 – Feb pivot point, 1.3121 – pivot support 1 and Fib supports at 1.2966 and 1.2792.
Daily
Daily time frame is a most important for us currently. So let’s start from the most exciting moment that some of you, guys have asked me about on forum, and then will shift to general analysis.
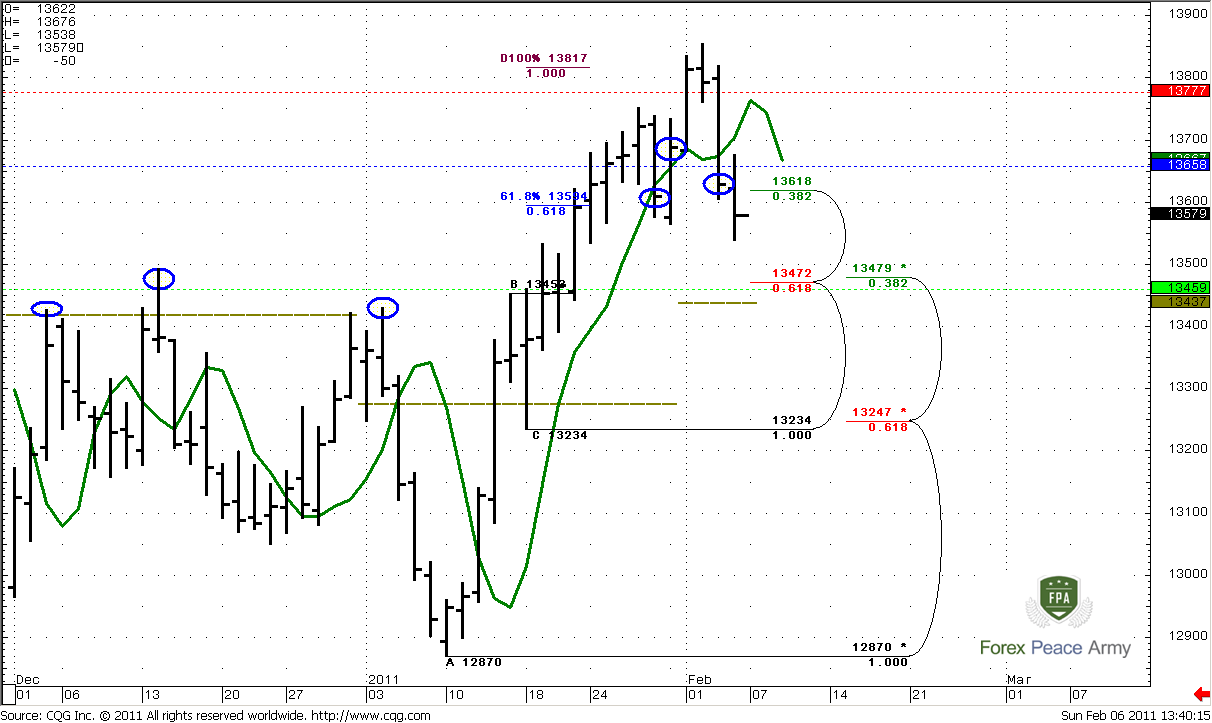
On #1 chart green line is a 3x3 DMA that you are familiar with already. We see excellent thrust up with nice separation from 3x3, close below 3x3, close above and establishing new highs, (that I like to see) and close below 3x3 again. This is confirmed DRPO “Sell” pattern. And you’ve asked me, what’s wrong with it. My answer is nothing wrong; it is DRPO “Sell”, although I better treat it as LAL (Look-alike), because for me it is too large difference between tops, and I prefer to see tops that are closer to each other. But particularly in this case it seems logical – just look at ABC pattern, its 100 % target stands precisely at 1.3817 and the second top of DRPO. Market just accomplished this target and turned to the downside, so, it allows us to speak about nice DRPO “Sell” on daily time frame. Now, what is the nearest target, is it too late to enter, and where we should place stop?
Usually, the potential target of DRPO is 100% expansion from ABC pattern of its tops. But currently we can’t do that, because the second top is higher. DiNapoli shows two other approaches that allow us estimate the target. First approach is – the next strong area of support. This is 1.3460-1.3480 area, and it includes daily Confluence support, weekly pivot support 1 and previous highs (marked in left part of the chart). Also take a look – 1.3437 is a monthly pivot point. Odds suggest that this area could force market to bounce, hence, this is the first target. If your context for short trading is DRPO along – this is your profit target.
Second approach is a dynamic profit target that could give as better result as worse one. Until price holds below 3x3 – you keep short position. Your exit point is a daily close above 3x3. The choice is up to you, but it worth to say that if market will bounce from the area that we’ve pointed, then it will definitely close above 3x3 during bouncing and this approach will give you worse results than the first one.
Where to enter and where to place stop we will discuss on intraday part of the research, and no let’s take a look at daily time frame at common.
#1
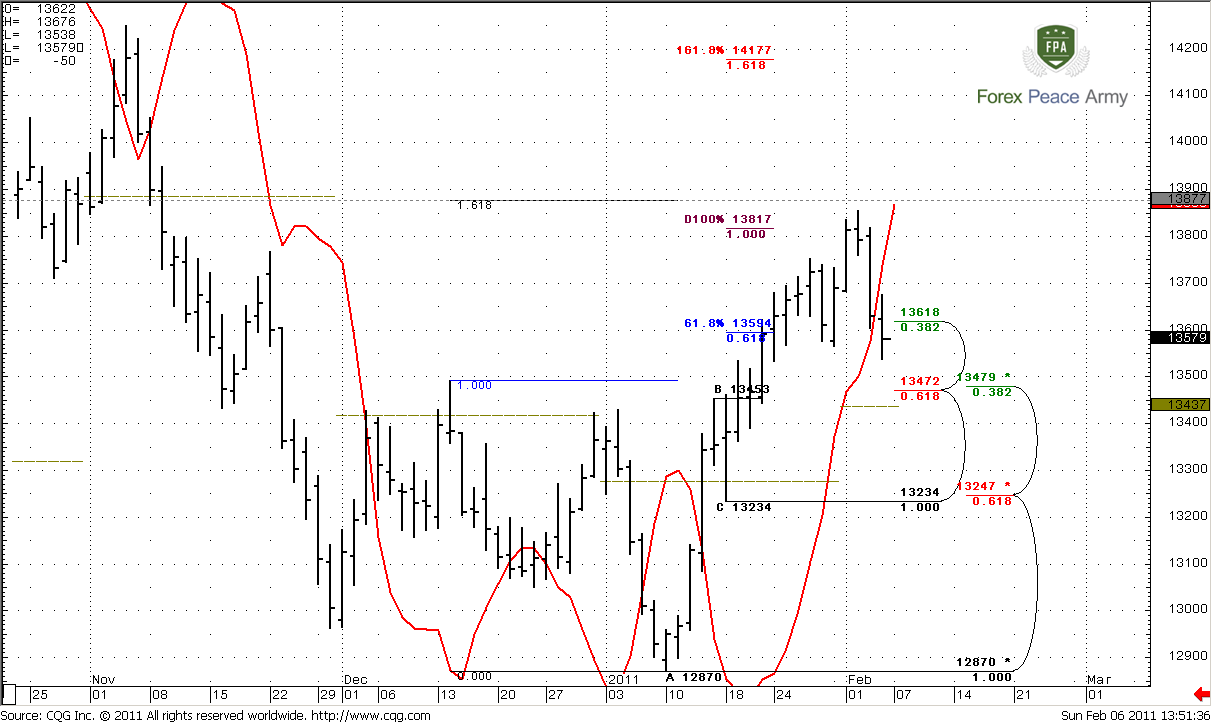
On the #2 chart we can see, that market also was near 1.618 target of a Butterfly pattern at 1.3877, as well as AB-CD pattern. Trend clearly turns bearish. Market is neither oversold nor overbought, so we can use a retracement higher from the recent swing down to enter on the short side of the market. Let’s see at this possibility in more details…
#2
4-Hour
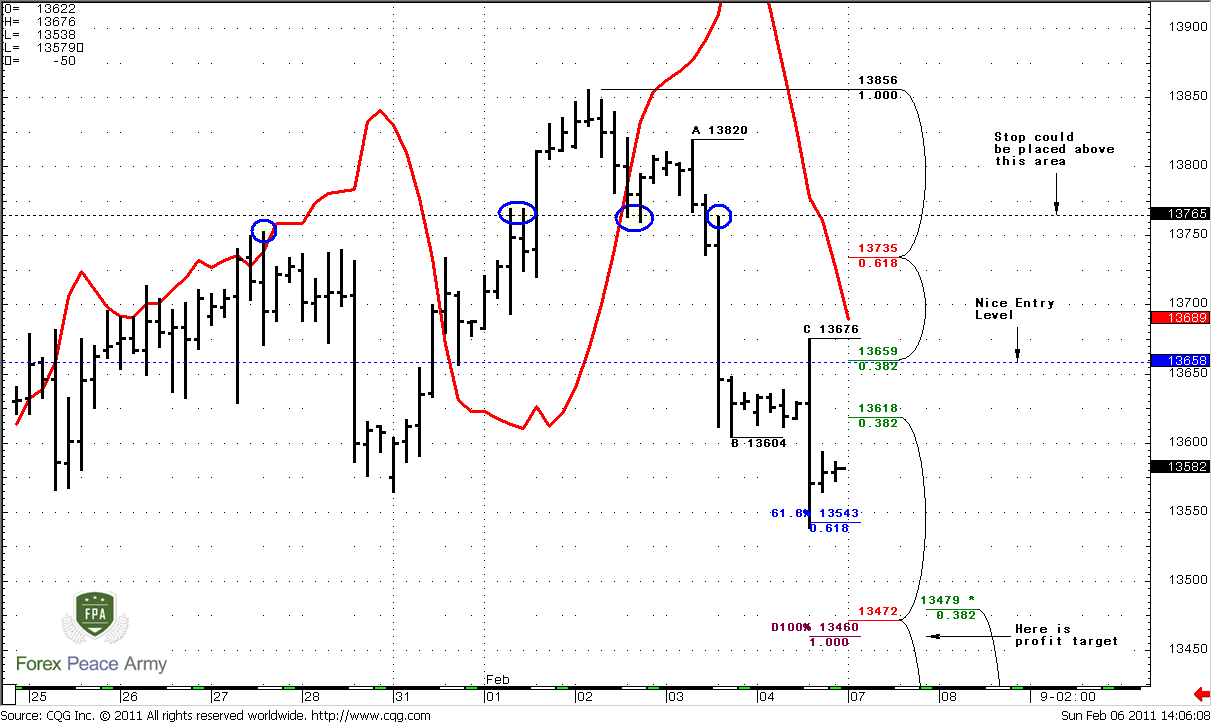
This chart, in fact, shows all that we need to see. Look at ABC pattern, market has reached already 0.618 target and turned to some retracement. Keep in mind that if this is a really DRPO on daily, then market never shows strong retracement after reaching 0.618, even shows any at all. So, we need to enter at nearest Fib resistance level. This is 3/8 Fib level at 1.3659, that is also a weekly pivot point. Also I do not mind if you will choose even lower fib resistance from the high of “C” point at 1.3676. But pivots are traded by the market in 80% of cases, so, from the probability perspective, 1.3659 seems reasonable. Also take a look that 4-hour trend is also bearish as daily and will stay bearish until our entry level. It should not turn bullish.
Stop order better to place above 1.3765, because this is an area that market protected (see blue circles) and will protect. Anyway, if market will move above 5/8 Fib resistance and above weekly pivot – then something wrong. It should not happen if it is a really DRPO “Sell”. Be careful.
The target is 1.3460 – Agreement with daily Confluence + weekly pivot resistance 1+ monthly pivot.
Conclusion:
Fundamentally, EUR/USD looks heavy for further move up; although I can’t exclude that this is possible. 1.37-1.38 levels seems reasonable, and possibly here market can reestablish down trend.
Market shows clear DRPO “Sell” pattern at daily time frame that is not too late to enter on Monday.
Entry level 1.3660-1.3670, stop above 1.3765, profit – 1.3460. Also be careful, if market will break above weekly pivot at 1.3458 and hold there, anyway, market should not show deep retracement, and should stay below 1.3735. If it will not do that – then something is wrong. The DRPO price action does not assume deep retracement just after reaching of 0.618 target.
The technical portion of Sive's analysis owes a great deal to Joe DiNapoli's methods, and uses a number of Joe's proprietary indicators. Please note that Sive's analysis is his own view of the market and is not endorsed by Joe DiNapoli or any related companies.
On the previous week, we’ve said that from fundamental analysis EUR seems overvalued above 1.3750-1.38 area. Seems our conclusion was correct and EUR/USD has shown solid move down during previous week.
Although Trend holds bullish, market still stuck with the range of a huge nasty bar. This is quite common, when after strong move market stands in their range for some time. Currently we see it on monthly time frame. And speaking in terms of monthly time frame – we can call some event as “meaningful” only when market will move beyond the borders that I’ve pointed on the chart. Before that will happen only lower time frames analysis will be more interesting for us.
Nevertheless, the nearest upside target is 0.618 Fib expansion is at 1.4354 that creates an Agreement with 5/8 Fib resistance at 1.4416.
Weekly
Trading action from weekly time perspective is very shallow. Trend is formally bullish, we see second doji in a row. May be it’s possible to treat them as “gravestone doji”, but for that purpose they should be a bit higher, not so deep inside the body of previous candle.
Second moment that attracts my attention is a close level of previous week – it’s very near to the low of the week. This is a bearish sign.
Anyway, I do not see any significant patterns and signals to trade on weekly time frame. May be we will see dynamic pressure with MACDP indicator after sometime. Although we already see that trend turns bullish, but price action is not and stands tight during the recent couple weeks, I think that this is too few bars to speak about dynamic pressure. But some bearish sign are started to appear.
Now let’s point significant levels. Just above the market 5/8 Fib resistance at 1.3739 that has been tested already and I think that it’s not so strong currently. 1.4004 – monthly pivot resistance 1.
Supports stand at 1.3447 – Feb pivot point, 1.3121 – pivot support 1 and Fib supports at 1.2966 and 1.2792.
Daily
Daily time frame is a most important for us currently. So let’s start from the most exciting moment that some of you, guys have asked me about on forum, and then will shift to general analysis.
On #1 chart green line is a 3x3 DMA that you are familiar with already. We see excellent thrust up with nice separation from 3x3, close below 3x3, close above and establishing new highs, (that I like to see) and close below 3x3 again. This is confirmed DRPO “Sell” pattern. And you’ve asked me, what’s wrong with it. My answer is nothing wrong; it is DRPO “Sell”, although I better treat it as LAL (Look-alike), because for me it is too large difference between tops, and I prefer to see tops that are closer to each other. But particularly in this case it seems logical – just look at ABC pattern, its 100 % target stands precisely at 1.3817 and the second top of DRPO. Market just accomplished this target and turned to the downside, so, it allows us to speak about nice DRPO “Sell” on daily time frame. Now, what is the nearest target, is it too late to enter, and where we should place stop?
Usually, the potential target of DRPO is 100% expansion from ABC pattern of its tops. But currently we can’t do that, because the second top is higher. DiNapoli shows two other approaches that allow us estimate the target. First approach is – the next strong area of support. This is 1.3460-1.3480 area, and it includes daily Confluence support, weekly pivot support 1 and previous highs (marked in left part of the chart). Also take a look – 1.3437 is a monthly pivot point. Odds suggest that this area could force market to bounce, hence, this is the first target. If your context for short trading is DRPO along – this is your profit target.
Second approach is a dynamic profit target that could give as better result as worse one. Until price holds below 3x3 – you keep short position. Your exit point is a daily close above 3x3. The choice is up to you, but it worth to say that if market will bounce from the area that we’ve pointed, then it will definitely close above 3x3 during bouncing and this approach will give you worse results than the first one.
Where to enter and where to place stop we will discuss on intraday part of the research, and no let’s take a look at daily time frame at common.
#1
On the #2 chart we can see, that market also was near 1.618 target of a Butterfly pattern at 1.3877, as well as AB-CD pattern. Trend clearly turns bearish. Market is neither oversold nor overbought, so we can use a retracement higher from the recent swing down to enter on the short side of the market. Let’s see at this possibility in more details…
#2
4-Hour
This chart, in fact, shows all that we need to see. Look at ABC pattern, market has reached already 0.618 target and turned to some retracement. Keep in mind that if this is a really DRPO on daily, then market never shows strong retracement after reaching 0.618, even shows any at all. So, we need to enter at nearest Fib resistance level. This is 3/8 Fib level at 1.3659, that is also a weekly pivot point. Also I do not mind if you will choose even lower fib resistance from the high of “C” point at 1.3676. But pivots are traded by the market in 80% of cases, so, from the probability perspective, 1.3659 seems reasonable. Also take a look that 4-hour trend is also bearish as daily and will stay bearish until our entry level. It should not turn bullish.
Stop order better to place above 1.3765, because this is an area that market protected (see blue circles) and will protect. Anyway, if market will move above 5/8 Fib resistance and above weekly pivot – then something wrong. It should not happen if it is a really DRPO “Sell”. Be careful.
The target is 1.3460 – Agreement with daily Confluence + weekly pivot resistance 1+ monthly pivot.
Conclusion:
Fundamentally, EUR/USD looks heavy for further move up; although I can’t exclude that this is possible. 1.37-1.38 levels seems reasonable, and possibly here market can reestablish down trend.
Market shows clear DRPO “Sell” pattern at daily time frame that is not too late to enter on Monday.
Entry level 1.3660-1.3670, stop above 1.3765, profit – 1.3460. Also be careful, if market will break above weekly pivot at 1.3458 and hold there, anyway, market should not show deep retracement, and should stay below 1.3735. If it will not do that – then something is wrong. The DRPO price action does not assume deep retracement just after reaching of 0.618 target.
The technical portion of Sive's analysis owes a great deal to Joe DiNapoli's methods, and uses a number of Joe's proprietary indicators. Please note that Sive's analysis is his own view of the market and is not endorsed by Joe DiNapoli or any related companies.
")