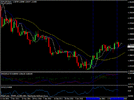
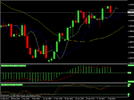
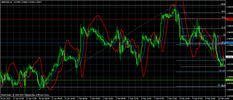
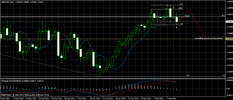
FOREX PRO Weekly February 13-17, 2012

Thank you sir

As per 4hr butterfly sell @ 3290-3310
we got 120pips :) thank you sive sir

And now you make the latest analysis crystal clear,
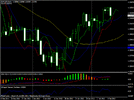
if market will break the wadge and proceed lower 3150-40 area then it will go further to hit our target 2890-2900..
if it will go back i would like to add few lots with stop above 3260 and if finally if it break 3260 then we will wait for 3360 for 3 DRIVE..

Thank you very much for giving the precious time,
we all wish you GoodLuck..
 
Hey sive
Thanks for your great analysis. By the the way we have a great forum now were we discuses your analysis and the marked during the day. Maybe fpa one day can make a site were we can discus on the mark.
Kind regards Mau
 
Honestly Sive , analyzing each chart in detail and combining them together is not a bed of roses especially recognizing patterns. Good Job Sir Commander With in-depth explanation,label and charts.
thanks.
 
wonderful analysis sive,please how do i insert dma on my chart thanks


Hi Anned,
To insert DMA in your chart in your MT4
1.Click on insert,point ur cursor on indicators,go to trend and click moving average
2.click parameters, input 3 on the period,and 3 on the shift box as well
3,MA method choose simple and apply to close.that is all.
but remember 3 by 3 MA is for short term trend. read more on this in the forex military school under Moving average dynamic resistance and support.
 
Hi everyone

First thanks Sive thanks FPA for time and effort.

To find Dinappoli directional signals on spot market is near impossible simply because different brokers have different closes for the day and data (see charts attached) .

My question is how to overcome this problem? is it by trading only futures?
I'm wondering sir if you will cover Options in your FPA lessons ?

Thanks again for time and effort to educate us .


eurusd.gifeurusd.gifeurusd.gif
 
gbp

Hello everyone!
I want to share an interesting situation on GBP and maybe get an expert opinion from Mr. Morten:

GBP is at Weekly confluence resistance and price returned to close below it. I expect a respect of this area so I am looking for sell signals.

DRPO is one option but, as it was already noticed, I could get it wrong because of my broker OHLC.
Other option is H&S but I might miss the train and not get such retracement up.

Trend turned bearish but not very convincing.
Also, Monthly pivot point is at 50% retracement and it has not been touched this month.

Hourly K area is at Weekly pivot. So, what action to take for entering on short side?
 

Attachments

  • gbp1.gif
    gbp1.gif
    41.7 KB · Views: 30
  • gbp.gif
    gbp.gif
    31.2 KB · Views: 24
georgeta,

how about waiting for a retrace up to 38.2 or 61.8 to enter short? also, i can't really tell by your charts, but it looks like the lower bound of the bull channel might cross the 61.8 node and broken channel bounds are usually re-tested from the other side, in this case, market moves up to test that lower channel bound, and if it coincides with 61.8 node, then put your sell order in front of the 61.8 retrace level. and another sell order in front of 38.2 if all the bearish signs are strong and convincing.
 
Hi Rijal,
Well, as possible decision could be to get official closes of futures market at cmegroup.com and calculate MA - then investigate was any close or not.
No, we will not study options due many reasons. First, this is too extended material, starting from what is an option and classical models till volatility trading, smile, subject hedging and so on. Second, there are a lot of books dedicated to this topic, third - there are few brokers who offers forex options.
 
Back
Top