Sive Morten
Special Consultant to the FPA
- Messages
- 18,621
Monthly
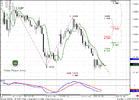
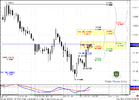
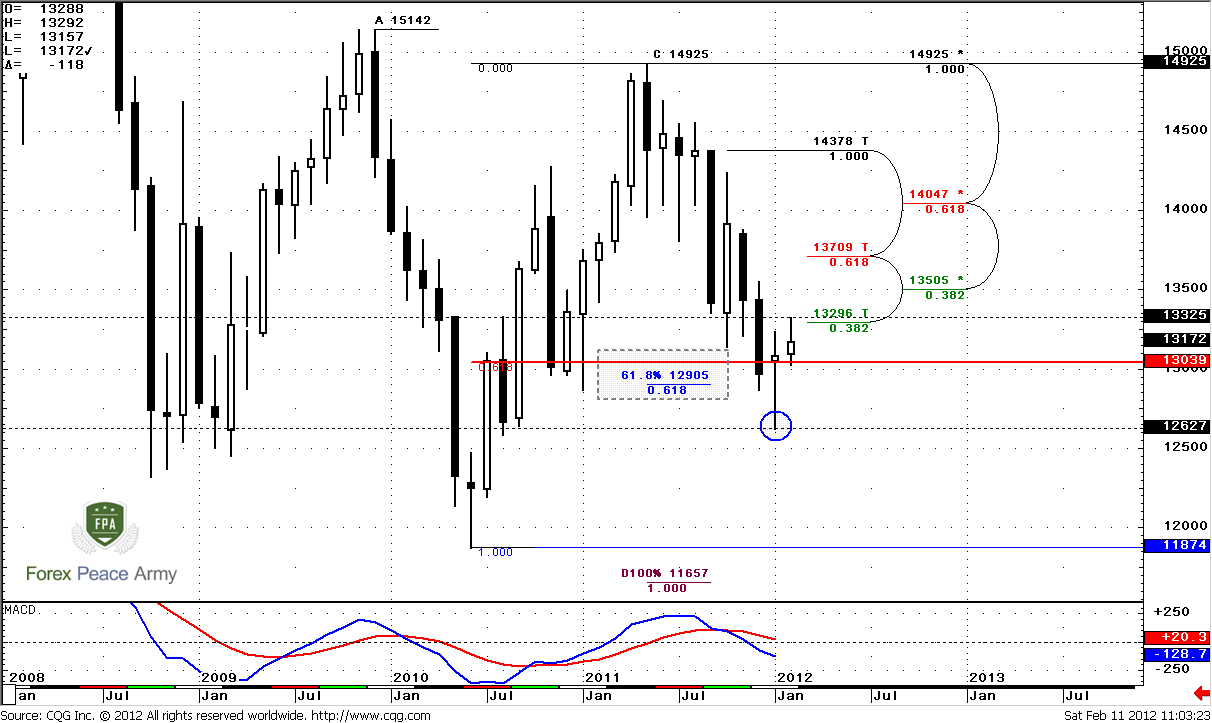
Trend is bearish, market is not at oversold. In fact I leave previous analysis of monthly time frame intact. One thing that I would like to add is that market has touched first Fib resistance level at 1.3296.
Currently market is showing some pullback that may be a respect of our Agreement level. January’s candle forces me to search for some analogues in closest past, so, if you will take a look at recent bottoms on monthly chart you will find the same pattern as in January. This is type of hammer with small body and close slightly below top. Current price action is a bit shallow for now. So it does not add more information. One thing that we have to note still is that market has returned back above 0.618 support and January has closed above it also. That could be important. Next monthly target stands as AB=CD pattern at 1.1650. Since market has reached just 0.618 target, retracement should not be too deep. I suppose to 1.3505-1.3707 as max.
There are two significant levels of resistance at monthly chart that are mostly close to current price action – 1.3296 as 0.382 resistance from solid thrust bar down and 1.3505 – major 0.382 resistance level. From perspective of hammer pattern, we can say that downward move has continued only if price will take out its low 1.2627.
Conclusion from monthly chart is as follows – market has found some support and now under way to respect it by bullish hammer pattern. Breakout of 1.2627 can be as indicator of reestablishing downward trend, while to the upside nearest resistances are 1.3296 and 1.3505
Weekly
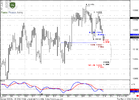
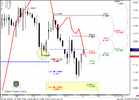
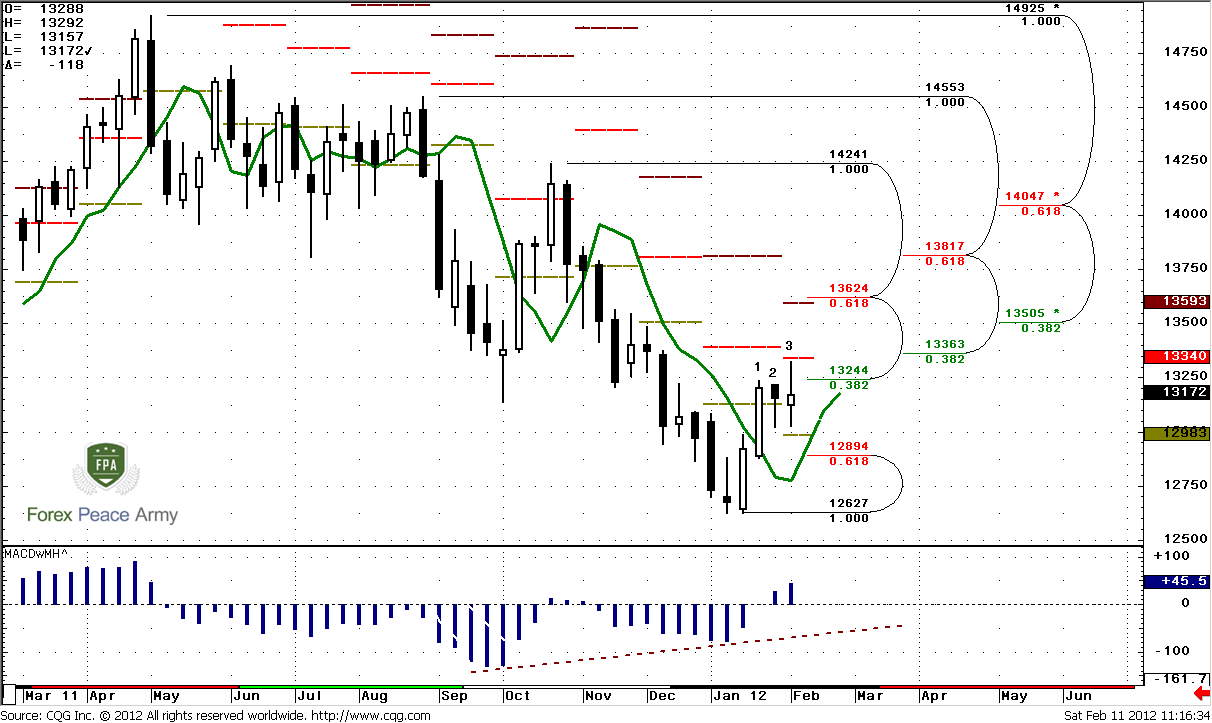
Here I do not see anything but potential for B&B “Sell” pattern. Trend is not so important for us here, despite the fact that it holds bullish. According to DiNapoli framework - Direction overrules Trend, and B&B is Directional bearish pattern. So our direction on weekly time frame is bearish.
Second moment is that market has accomplished theoretical conditions for B&B “Sell” pattern – shown thrust, reached significant resistance within 3 periods by close after penetration of 3x3 DMA. That is conditions noted by DiNapoli for B&B. From that perspective market should start move to B&B target – 0.618 support at 1.2894 at minimum. I just want to make some light note here. We have to be rather flexible to strict conditions, since market is a not precise mechanism or engine – this is more living substance, since it is driven by human beings. That’s why real start or failure of B&B sometimes could be a bit different and skew either one side or another. I mean that if you will ask me why B&B has started after 4 bars but not 3 – I can’t answer on it. In fact to catch the starting point of B&B is a real task that is based on continuing analysis and monitoring of lower time frames. DiNapoli gives just general conditions, based on probability – in most cases B&B starts to work within 1-3 periods after penetration of DMA, but this is not mean that it always happens like that.
Third moment is reaching of monthly pivot resistance 1 at 1.3340. When market stands at long-term bear trend upward retracements usually holds by pivot resistance. So, that has happened.
What conclusion could be made here? Market has not bad chances to show downward move in the beginning of the week. It stands at resistance and shows context for B&B “Sell”. Hope we will be lucky to get some more confirmation on lower time frames…
Daily
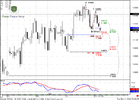
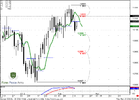
On daily time frame we see some bearish signs. Although trend is bullish, market has returned right below previous high at 1.3237 and was not able to reach next resistance at 1.3360 area. Could we treat recent price action as W&R – is an open question, but solid move down right from that area is a bearish sign. Here we tough task to do.
DRPO SCENARIO
On the first view – all clear, we have DRPO “Sell” pattern. I’ve marked bars of penetration 3x3 DMA by circles and numbers. Still, situation a bit trickier than it seems. Why? First of all I see this DRPO but I do not like it very much – difference between tops significant, consolidation between first penetration of 3x3 DMA and second one is almost equal to thrust length. So, it will be honest to qualify it as DRPO LAL probably. Let’s suppose that it will work, since in general it stands in a row with B&B “Sell” on weekly and although it is LAL, nevertheless could work as pure DRPO. How we will play it?
The failure point of DRPO is 0.618 resistance at 1.3261 at close. So, to treat it as failure pattern market has to close above this level. Some weight is added by the fact that this level stands above 1.3237. Since market has already returned below it – moving back again is unnatural for bearish development. From that perspective I like this level. IF you want to trade purely DRPO you have to place stop somewhere above 1.3261. Your target is 1.2894 – B&B “Sell” minimum target. How you can enter? There are two possible ways – just by market in the beginning of the week, second - wait some pullback to nearest Fib resistance on intraday charts or combine both of them.
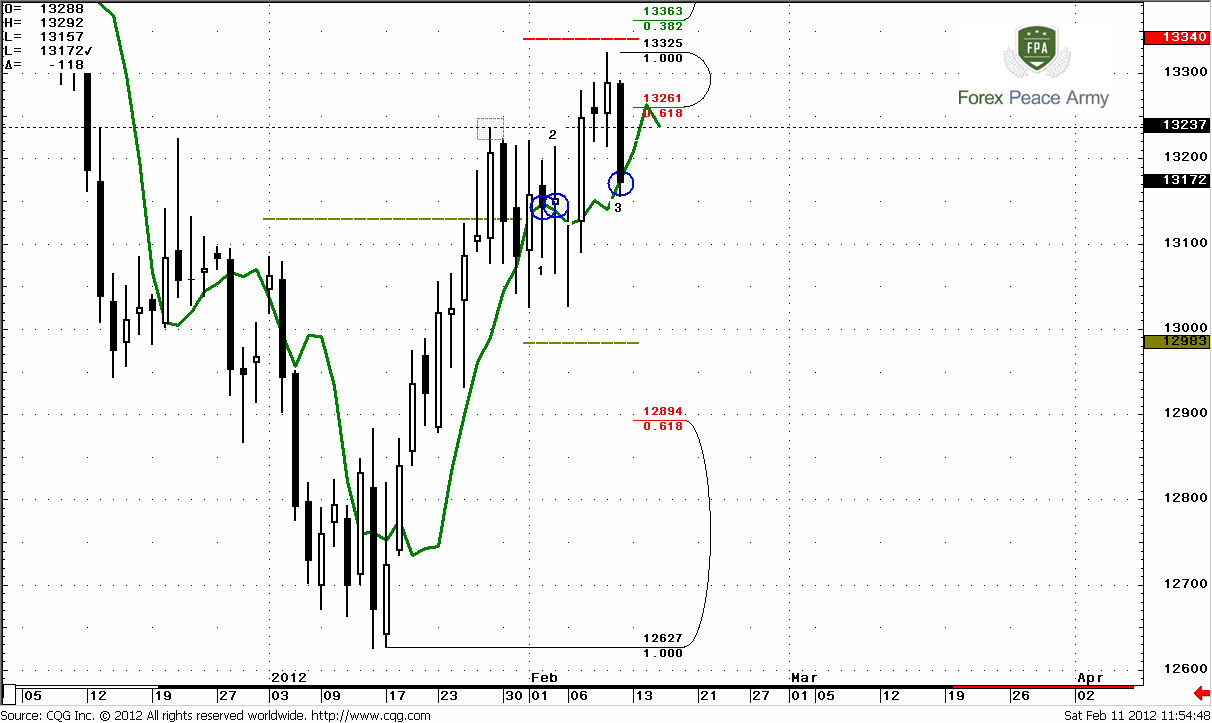
And now I will show you why I a bit worry about it…
3-DRIVE SCENARIO
Such a bit extended action of DRPO makes room open for shifting to 3-Drive “Sell” pattern. As we know already – current top has appeared right at 1.27 extension of 4-hour butterfly “Sell” that we’ve discussed through the week. Very often Butterfly becomes a part of 3-Drive pattern. Take a look that 1.618 extension stands right at 1.3363 resistance level and very close to monthly pivot resistance. If market will turn to upside right from current level – then 1.27 extension from potential 2nd drive will stand at the same area – so this could become perfect 1.618/1.27 3-Drive “Sell” pattern. Also pay attention how drives harmonic are. Retracements during 1st and 2nd drives are almost both at 200 pips.
Even more, if this move to 1.3360 and fast reverse will happen within next week – it will not erase B&B “Sell” pattern, since move down will start.
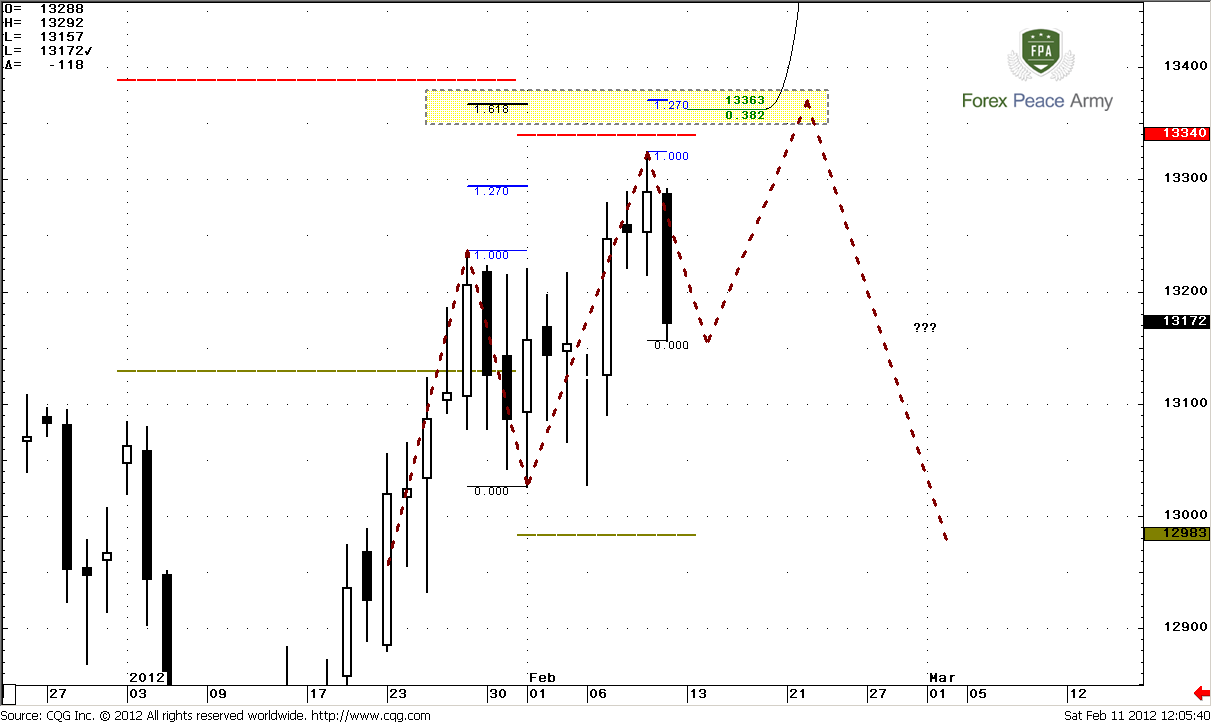
So, what we’re going to do?
Conservative approach is to wait both downward continuation and breaking of harmony with 3-Drive or reaching of 1.3360 area and trade 3-Drive pattern.
Aggressive path is to enter by DRPO “Sell”. Then if market will take your stop and form failure DRPO – this will simultaneously mean that 3-Drive is under way. So you will have two patterns – DRPO failure and 3-Drive in progress. Reverse your position with target at 1.3360-1.3370. This will let you return your loss from DRPO trade and then be prepared to trade purely 3-Drive.
May be you will find other wise solutions and can share with them on forum. This will be greatly appreciated.
8-hour
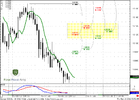
Here I’ve used 8-hour chart to reduce noise and better show you overall situation. We have really significant support levels: around pivot 1.3141-1.3155 and with major 0.382 support – 1.3050-1.3059. Also we see nice bearish divergence with MACD. This chart could help us catch hint on potential move to 1.3360 area. Now market stands at first K-support and will open right around pivot point. If it will return above 1.3240 high again – keep close look to 1.3261 level, since this is DRPO Failure point. As you can see – they are close to each other. Also here you can see nice bearish wedge if you will add corresponding trend lines. Wedge is often company for 3-Drive, as divergence.
1-hour
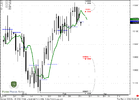
This is contracted hourly chart. Let’s get some freedom to imagination. This is 3-Drive pattern as it very often happens – like compounding of side-by-side two butterflies, classical wedge and divergence. Hourly trend is now bullish and market stands at solid K-support area. If market will break this level down – this will be huge advantage for bears and very probable that DRPO will prevail over 3-Drive. In this case harmony of 3 Drive pattern will be broken. Market will move below pivot and all trends will be bearish. Second scenario, if market will jump out from this border to upside, then it will turn us to difficult period of expectation. I’ve drawn just one possible scenario – as smaller Butterfly “sell”. What will happen in reality – who knows…
Conclusion:
Long-term bias still holds bearish, but market now turning to some pause with nice hammer pattern. Probably this is respect of the area that we’ve discussed previously. We can speak about downward continuation only if market will take low at 1.2627.
Weekly time frame is most important in current days, since it has context for directional pattern with excellent trading potential. At the same time this task looks not so simple, since there are could be two different patterns here. We have to apply such trading plan that will allow us to deal with both and to not skip entry in B&B trade. They could be either DRPO “Sell” LAL or 3-Drive “Sell”.
Since we’ve announced as aggressive as conservative tactics – you may choose what you personally like or even find some better solution to trade and share with others on forum.
Firs level to watch for on Monday is 1.3150-1.3175. If market will break it down, then DRPO “Sell” will get an advantage over 3-Drive.
The technical portion of Sive's analysis owes a great deal to Joe DiNapoli's methods, and uses a number of Joe's proprietary indicators. Please note that Sive's analysis is his own view of the market and is not endorsed by Joe DiNapoli or any related companies.
Trend is bearish, market is not at oversold. In fact I leave previous analysis of monthly time frame intact. One thing that I would like to add is that market has touched first Fib resistance level at 1.3296.
Currently market is showing some pullback that may be a respect of our Agreement level. January’s candle forces me to search for some analogues in closest past, so, if you will take a look at recent bottoms on monthly chart you will find the same pattern as in January. This is type of hammer with small body and close slightly below top. Current price action is a bit shallow for now. So it does not add more information. One thing that we have to note still is that market has returned back above 0.618 support and January has closed above it also. That could be important. Next monthly target stands as AB=CD pattern at 1.1650. Since market has reached just 0.618 target, retracement should not be too deep. I suppose to 1.3505-1.3707 as max.
There are two significant levels of resistance at monthly chart that are mostly close to current price action – 1.3296 as 0.382 resistance from solid thrust bar down and 1.3505 – major 0.382 resistance level. From perspective of hammer pattern, we can say that downward move has continued only if price will take out its low 1.2627.
Conclusion from monthly chart is as follows – market has found some support and now under way to respect it by bullish hammer pattern. Breakout of 1.2627 can be as indicator of reestablishing downward trend, while to the upside nearest resistances are 1.3296 and 1.3505
Weekly
Here I do not see anything but potential for B&B “Sell” pattern. Trend is not so important for us here, despite the fact that it holds bullish. According to DiNapoli framework - Direction overrules Trend, and B&B is Directional bearish pattern. So our direction on weekly time frame is bearish.
Second moment is that market has accomplished theoretical conditions for B&B “Sell” pattern – shown thrust, reached significant resistance within 3 periods by close after penetration of 3x3 DMA. That is conditions noted by DiNapoli for B&B. From that perspective market should start move to B&B target – 0.618 support at 1.2894 at minimum. I just want to make some light note here. We have to be rather flexible to strict conditions, since market is a not precise mechanism or engine – this is more living substance, since it is driven by human beings. That’s why real start or failure of B&B sometimes could be a bit different and skew either one side or another. I mean that if you will ask me why B&B has started after 4 bars but not 3 – I can’t answer on it. In fact to catch the starting point of B&B is a real task that is based on continuing analysis and monitoring of lower time frames. DiNapoli gives just general conditions, based on probability – in most cases B&B starts to work within 1-3 periods after penetration of DMA, but this is not mean that it always happens like that.
Third moment is reaching of monthly pivot resistance 1 at 1.3340. When market stands at long-term bear trend upward retracements usually holds by pivot resistance. So, that has happened.
What conclusion could be made here? Market has not bad chances to show downward move in the beginning of the week. It stands at resistance and shows context for B&B “Sell”. Hope we will be lucky to get some more confirmation on lower time frames…
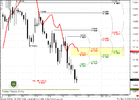
Daily
On daily time frame we see some bearish signs. Although trend is bullish, market has returned right below previous high at 1.3237 and was not able to reach next resistance at 1.3360 area. Could we treat recent price action as W&R – is an open question, but solid move down right from that area is a bearish sign. Here we tough task to do.
DRPO SCENARIO
On the first view – all clear, we have DRPO “Sell” pattern. I’ve marked bars of penetration 3x3 DMA by circles and numbers. Still, situation a bit trickier than it seems. Why? First of all I see this DRPO but I do not like it very much – difference between tops significant, consolidation between first penetration of 3x3 DMA and second one is almost equal to thrust length. So, it will be honest to qualify it as DRPO LAL probably. Let’s suppose that it will work, since in general it stands in a row with B&B “Sell” on weekly and although it is LAL, nevertheless could work as pure DRPO. How we will play it?
The failure point of DRPO is 0.618 resistance at 1.3261 at close. So, to treat it as failure pattern market has to close above this level. Some weight is added by the fact that this level stands above 1.3237. Since market has already returned below it – moving back again is unnatural for bearish development. From that perspective I like this level. IF you want to trade purely DRPO you have to place stop somewhere above 1.3261. Your target is 1.2894 – B&B “Sell” minimum target. How you can enter? There are two possible ways – just by market in the beginning of the week, second - wait some pullback to nearest Fib resistance on intraday charts or combine both of them.
And now I will show you why I a bit worry about it…
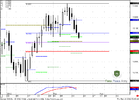
3-DRIVE SCENARIO
Such a bit extended action of DRPO makes room open for shifting to 3-Drive “Sell” pattern. As we know already – current top has appeared right at 1.27 extension of 4-hour butterfly “Sell” that we’ve discussed through the week. Very often Butterfly becomes a part of 3-Drive pattern. Take a look that 1.618 extension stands right at 1.3363 resistance level and very close to monthly pivot resistance. If market will turn to upside right from current level – then 1.27 extension from potential 2nd drive will stand at the same area – so this could become perfect 1.618/1.27 3-Drive “Sell” pattern. Also pay attention how drives harmonic are. Retracements during 1st and 2nd drives are almost both at 200 pips.
Even more, if this move to 1.3360 and fast reverse will happen within next week – it will not erase B&B “Sell” pattern, since move down will start.
So, what we’re going to do?
Conservative approach is to wait both downward continuation and breaking of harmony with 3-Drive or reaching of 1.3360 area and trade 3-Drive pattern.
Aggressive path is to enter by DRPO “Sell”. Then if market will take your stop and form failure DRPO – this will simultaneously mean that 3-Drive is under way. So you will have two patterns – DRPO failure and 3-Drive in progress. Reverse your position with target at 1.3360-1.3370. This will let you return your loss from DRPO trade and then be prepared to trade purely 3-Drive.
May be you will find other wise solutions and can share with them on forum. This will be greatly appreciated.
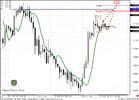
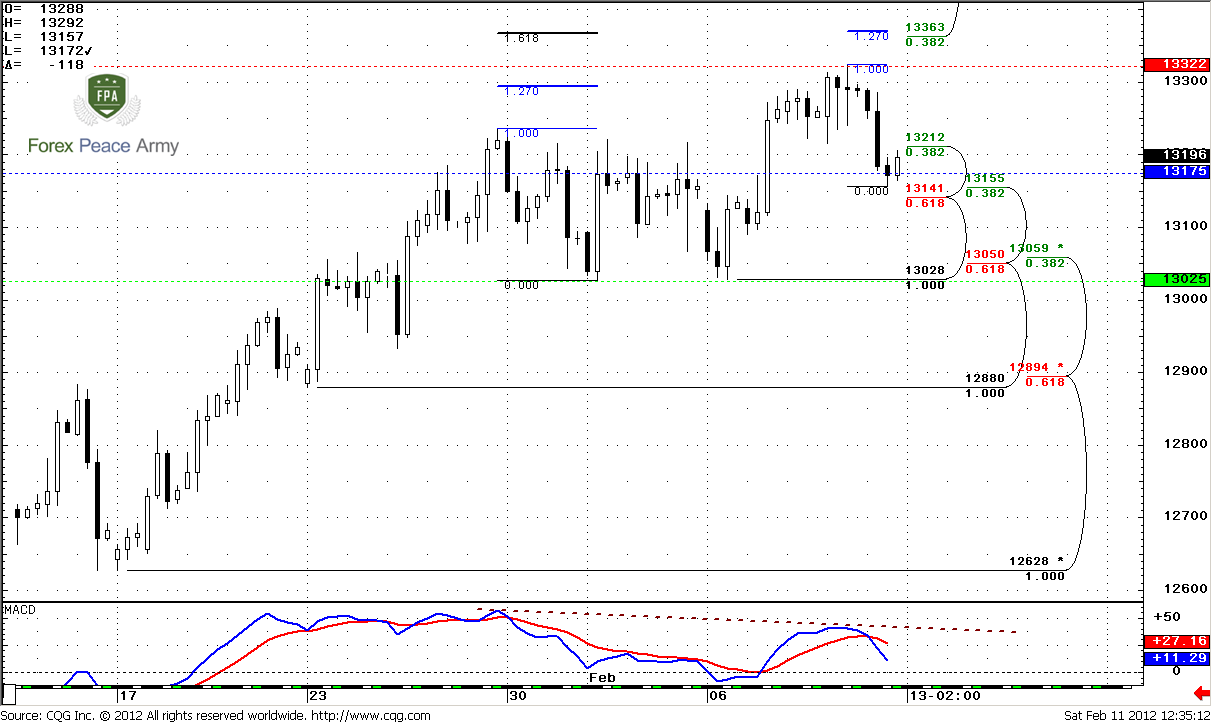
8-hour
Here I’ve used 8-hour chart to reduce noise and better show you overall situation. We have really significant support levels: around pivot 1.3141-1.3155 and with major 0.382 support – 1.3050-1.3059. Also we see nice bearish divergence with MACD. This chart could help us catch hint on potential move to 1.3360 area. Now market stands at first K-support and will open right around pivot point. If it will return above 1.3240 high again – keep close look to 1.3261 level, since this is DRPO Failure point. As you can see – they are close to each other. Also here you can see nice bearish wedge if you will add corresponding trend lines. Wedge is often company for 3-Drive, as divergence.
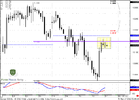
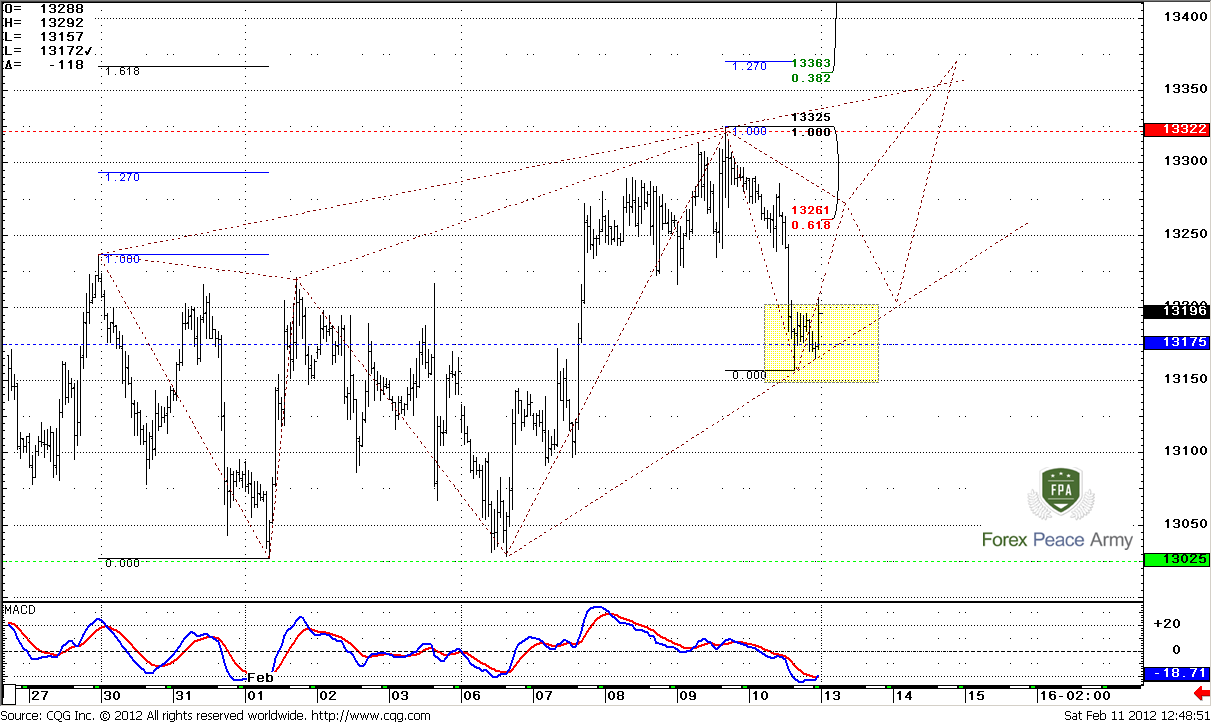
1-hour
This is contracted hourly chart. Let’s get some freedom to imagination. This is 3-Drive pattern as it very often happens – like compounding of side-by-side two butterflies, classical wedge and divergence. Hourly trend is now bullish and market stands at solid K-support area. If market will break this level down – this will be huge advantage for bears and very probable that DRPO will prevail over 3-Drive. In this case harmony of 3 Drive pattern will be broken. Market will move below pivot and all trends will be bearish. Second scenario, if market will jump out from this border to upside, then it will turn us to difficult period of expectation. I’ve drawn just one possible scenario – as smaller Butterfly “sell”. What will happen in reality – who knows…
Conclusion:
Long-term bias still holds bearish, but market now turning to some pause with nice hammer pattern. Probably this is respect of the area that we’ve discussed previously. We can speak about downward continuation only if market will take low at 1.2627.
Weekly time frame is most important in current days, since it has context for directional pattern with excellent trading potential. At the same time this task looks not so simple, since there are could be two different patterns here. We have to apply such trading plan that will allow us to deal with both and to not skip entry in B&B trade. They could be either DRPO “Sell” LAL or 3-Drive “Sell”.
Since we’ve announced as aggressive as conservative tactics – you may choose what you personally like or even find some better solution to trade and share with others on forum.
Firs level to watch for on Monday is 1.3150-1.3175. If market will break it down, then DRPO “Sell” will get an advantage over 3-Drive.
The technical portion of Sive's analysis owes a great deal to Joe DiNapoli's methods, and uses a number of Joe's proprietary indicators. Please note that Sive's analysis is his own view of the market and is not endorsed by Joe DiNapoli or any related companies.