Sive Morten
Special Consultant to the FPA
- Messages
- 18,644
Fundamentals
There are a lot of events happened this week. Some them are mostly related to politics or geopolitics, such as J. Biden to Congress speech and earthquake in Turkey. We discuss it tomorrow in Gold report. On economical stage we probably should mention J. Powell comments and few statistics data, such as PMI and see how market sentiment has changed, and how reasonable these changes are.
Market overview
In attempting to parse last week's blockbuster January jobs report, the Federal Reserve Chair on Tuesday reprised his take from last Wednesday's policy meeting - essentially that another couple of Fed rate hikes were probably needed to get across inflation fully, but that it was anyone's guess after that. After doubting Fed guidance all year, financial markets have taken one look at the strength of the labour market last month and stopped fighting the central bank. They now agree that two more quarter point hikes to just above 5% are in the pipeline by July - jarring stock and bond markets for a couple of days, but not much more.
Fed Chair Jerome Powell provided fuel for both sides of the argument at the Economic Club of Washington on Tuesday. He said rates might need to move higher if the U.S. economy remained strong, but reiterated "disinflation" is underway.
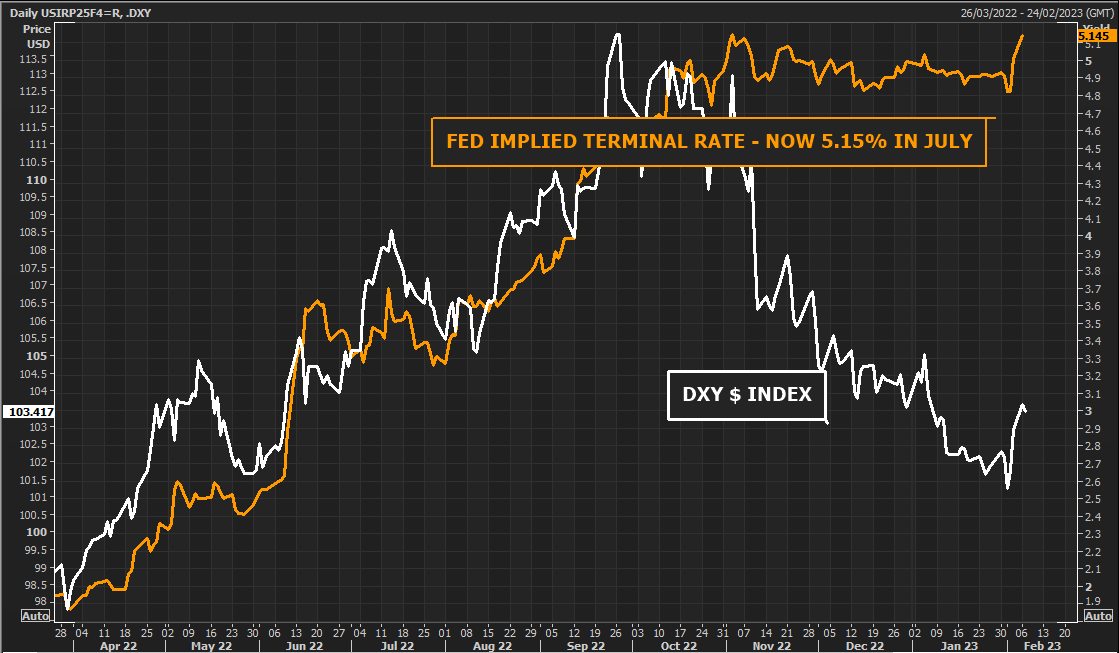
Despite some high-octane hawkishness from his colleagues - several more of whom are speaking on Wednesday - Powell seemed to reassure investors with some basic honesty about the peculiarity of this business cycle - and the dangers of extrapolating too much from a few data points or overcommitting on future policy moves.
Euro bulls might have to curb their enthusiasm after the rush to buy the single currency may have left it vulnerable in the short term, particularly given the uncertainty about many global central banks' interest rate plans. The prospect of a milder recession thanks to falling energy prices and plentiful supplies of natural gas, coupled with China finally emerging from three years of harsh COVID restrictions, have ignited investor appetite for European assets generally.
Such extreme positioning in an asset is often seen as a negative, as it suggests there are comparatively few investors left to buy and plenty who could decide to sell.
Proprietary iFlow positioning data from the custodian bank showed its clients' long euro positions against all other currencies (i.e. bets the euro will rise) are almost four times greater than the average position over the last 20 years, a record for the series.
Yu said some recovery was needed from September when "everyone was quite negative on the euro zone economy", but "this is overpricing things". Underweight positions in euro were almost three and a half times their usual size in September, according to the data.
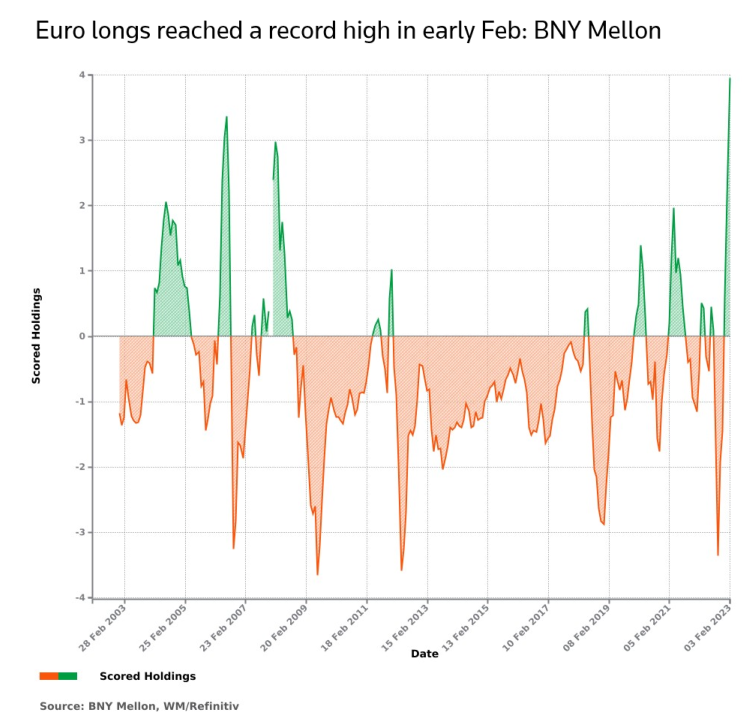
The Commodity Futures Trading Commission's Commitment of Traders report shows a similar picture. The latest data, for the week to Jan. 24, shows an increase in net long euro positions to $18.3 billion. The euro's gains have not just been at the expense of the dollar. Against the pound , it rose to its highest in over five months last week and hit a near 14-year high against the Swedish crown this week.
Medium term however, ING still thinks the Fed will cut rates aggressively in the second half of this year, and rate differentials will once again drive the euro/dollar pair. That, they say, will push the euro to around $1.15 by the end of the second quarter of 2023.
The University of Michigan surveys on Friday showed a one-year inflation outlook of 4.2%, higher than the final number in January. The overall index of consumer sentiment came in at 66.4, up from 64.9 the prior month.
Aside from the Michigan data, revisions showed that U.S. monthly consumer prices rose in December instead of falling as previously estimated, while data for the prior two months was also revised higher, according to the Bureau of Labor Statistics.
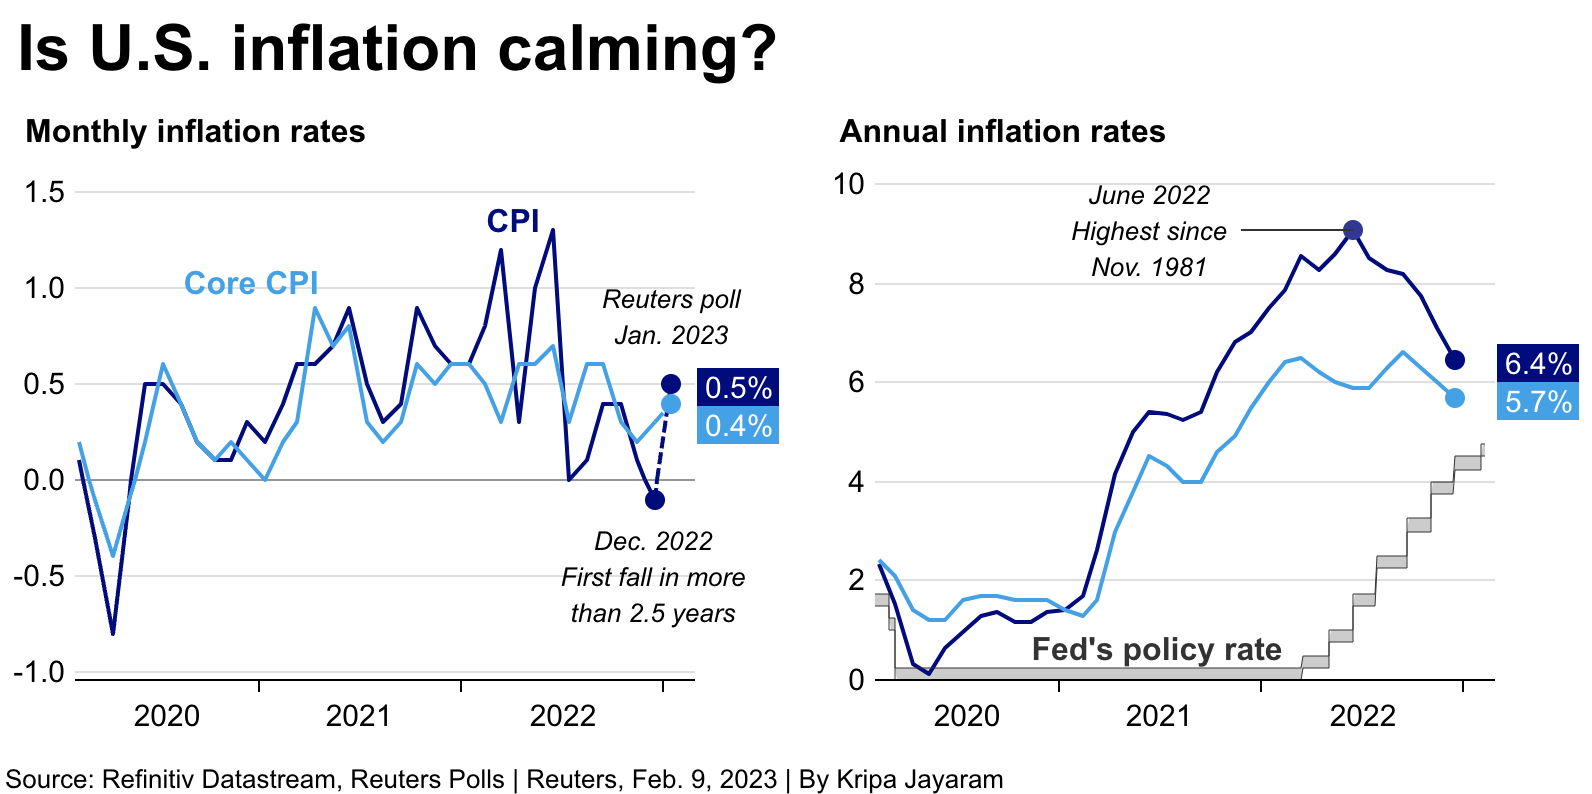
Data next Tuesday is likely to show that the U.S. consumer price index (CPI) climbing 0.4% month-on-month in January and the core CPI gaining 0.4% as well, according to a Reuters poll. A sell-off in government debt set the day's tone. The yield on benchmark 10-year Treasury notes hit a more than one-month high and the 10-year German bund posted its biggest weekly rise this year as European Central Bank policymakers warned about inflation.
The European Central Bank may extend its streak of large interest hikes into May if core inflation doesn't ease by then, ECB policymaker Klaas Knot said on Wednesday.
The ECB raised interest rates by half a percentage point last week and pencilled in a move of the same magnitude for next month but kept options open for its following meeting in May, with sources telling Reuters they expected a 25- or 50- basis-point increase then.
So, who is right?
According to Fathom Consulting, markets are too optimistic on disinflation pace right now. In the case of the US, market pricing through last month implied a fall of some five percentage points from 7.1% in November 2022 to just over 2.0% in November 2023. The speed of the disinflation that is priced in is the fastest we have seen since the global financial crisis; before that, we must look as far back as the recession of the early 1980s for a similarly steep decline. Could the US really disinflate that rapidly, and still avoid recession? That is what equity investors are hoping for; and there is plentiful evidence that the market is pricing in a Goldilocks scenario of low inflation and strong growth. For us, this is too optimistic – curbing double digit inflation almost always requires pushing the economy into a recession.
At the same time Fathom points on multiple positive shifts in overall data - high employment, turing of ISM index, decreasing inflation across the board - CPI, wages, regional indicators etc.

In other words, the US economy is so far evolving precisely as we said it must if a recession were to be avoided. Those two conditions were necessary; however, they may not be sufficient to ensure continued expansion. What we continue to find troubling is the scale of the historical precedent. The US has never avoided recession with consumer confidence as low as it has been in recent months. It has once avoided recession with inflation as high as it has been in recent months, but that was as long ago as 1952 (in time of a Gold standard that is incomparable).
The chief executive of JPMorgan Chase & Co., the biggest U.S. bank, cautioned against declaring victory against inflation too early, warning the Federal Reserve could raise interest rates above the 5% mark if higher prices ended up "sticky." In reference to inflation, Dimon said "people should take a deep breath on this one before they declare victory because a month’s number looked good."
U.S. bond manager Pacific Investment Management Company (PIMCO) is sticking to its previous forecast that the U.S. economy is headed toward a recession, despite recent data indicating economic resilience. Tiffany Wilding, PIMCO North American economist, said the strong economic data suggests a recession may come later than previously expected, but remains likely.
So, it seems that recession alarm bells are ringing, but (much) less loudly than before. The major arguments of optimists are rapid reopening of China's economy, plunging European gas prices and cooling U.S. inflation suggest a global recession may not be as deep and protracted as feared just weeks ago. That's propelled by the so-called Goldilocks view that the global economy will cool just enough to quell inflation, but not so much that earnings will collapse.
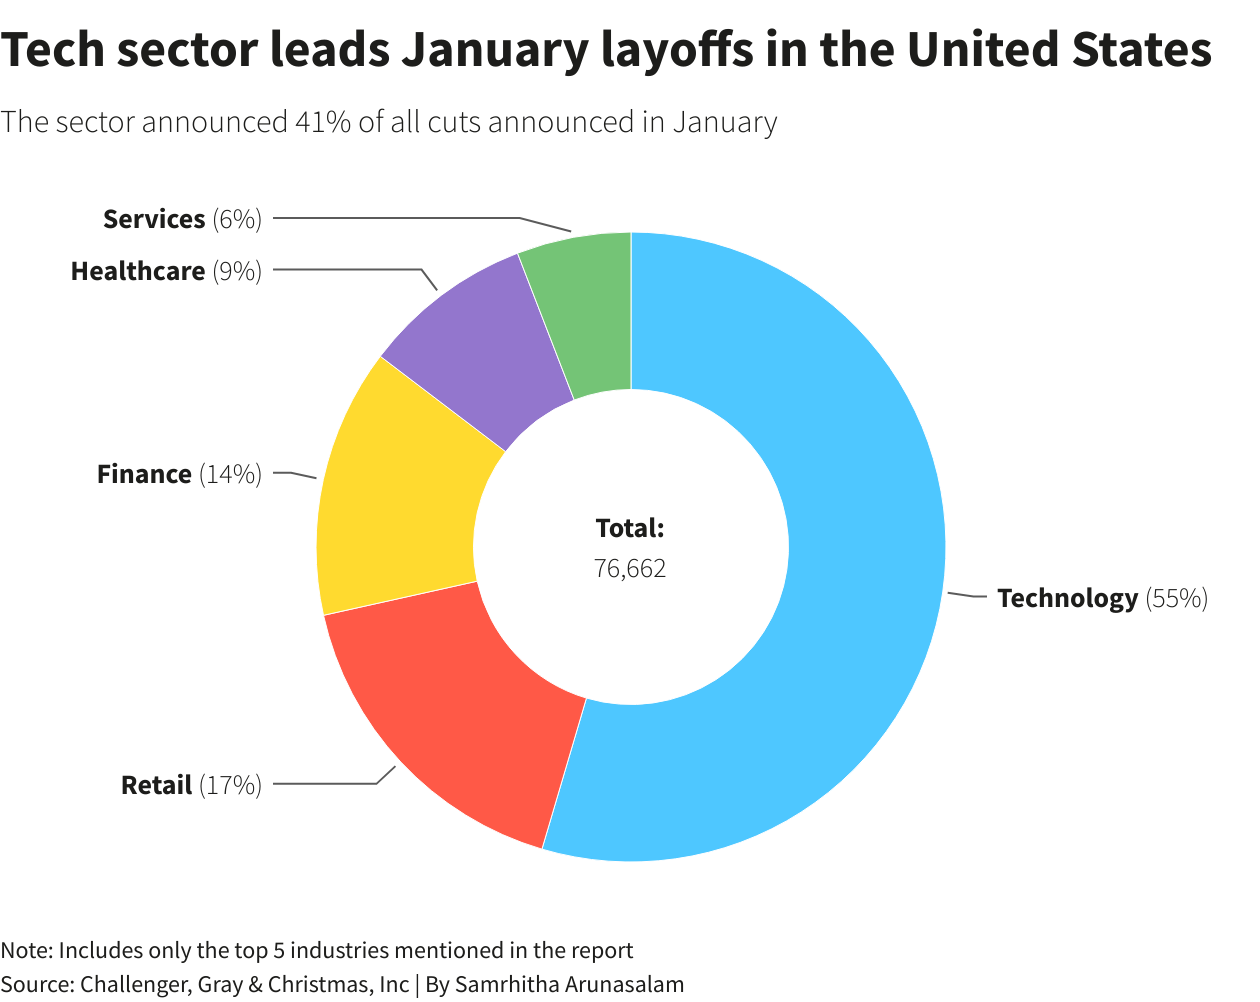
Some of the world's largest companies including Meta, IBM and Amazon are cutting thousands of jobs. But many of the layoffs are from beaten down tech firms that hired aggressively during the pandemic, Goldman Sachs economist Ronnie Walker notes.
Most economists still expect a U.S. recession, but businesses and some banks have cut the probability of one. Others note that future growth indicators such as manufacturing activity, housing market data and consumer confidence remain bleak.
Major indicators look confusing, what we're gonna do now?
The answer is simple - let's dig a bit deeper and take a look at secondary indicators, a kind of data of a "second stage". And here is what we see. Retail Volume decreasing as in EU as in the US. As we have repeatedly shown, this indicator has replaced inflation in the dynamics of the crisis (the specifics of the structural crisis, it is constantly moving from industry to industry). Now industry and retail sales are coming out on top. Theoretically, the volume of construction is competing with them, but most likely, in the near future the government will begin to support mortgages (this is too important a social factor). At the same time, of course, inflation may jump again …
The average age of the home buyer in the US. It turns out that if before the beginning of the 2008 crisis this age rarely exceeded 40 years, now it has risen to almost 50 ... Of course, this could mean an elongation of the psychological perception of youth, but the economic component also cannot be ignored:
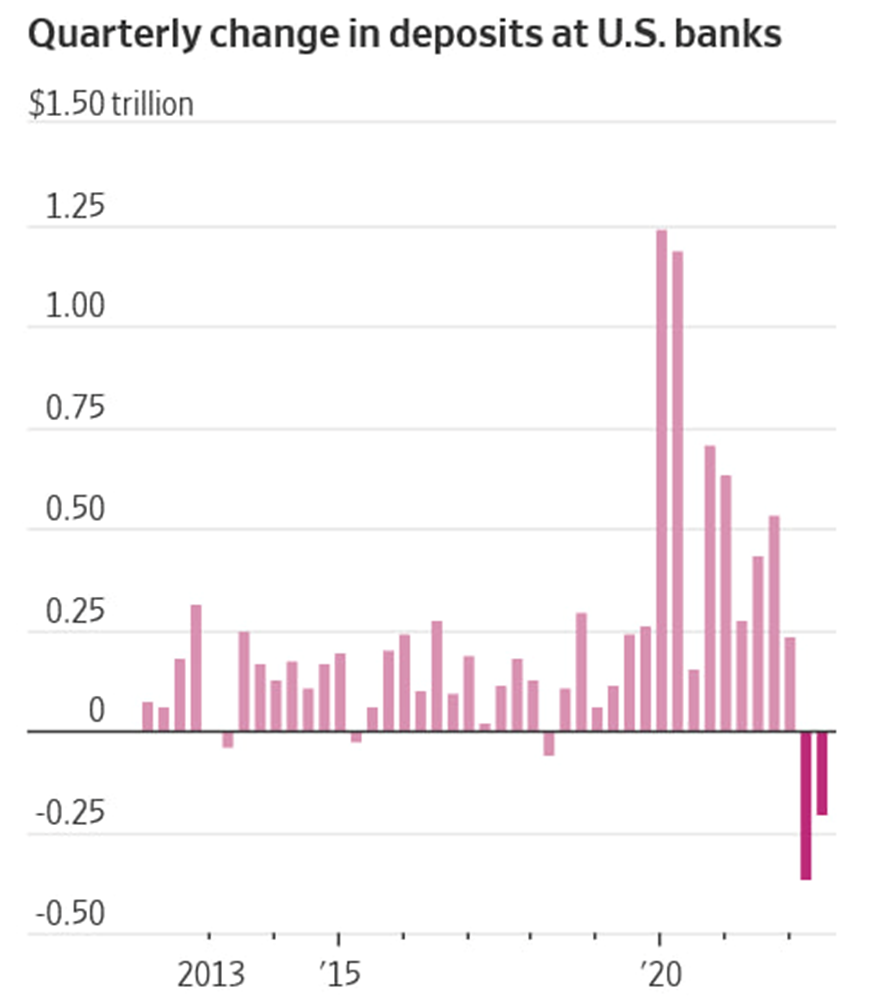
Next, local problems, already purely Biden. Quarterly changes in deposits in American banks. There are no comments here:
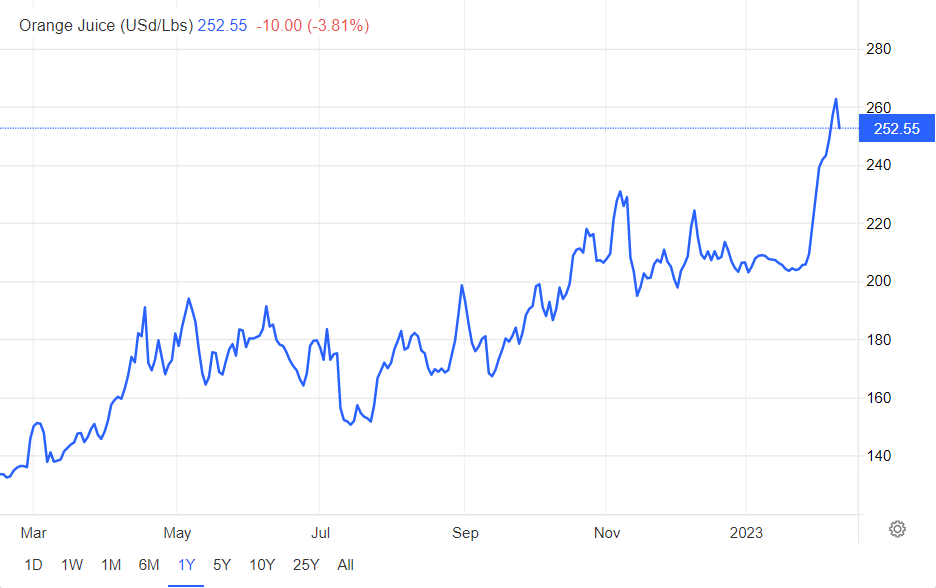
And now - bing. Orange juice - either inflation still exists or we have a lack of oranges around the world...
In 2022, credit card debt in the United States reached a record high of $960.6 billion. This is 18% more than a year ago! The average debt per person is $5805. And the rate on credit cards in 2022 was at a peak of 18.94% per annum.
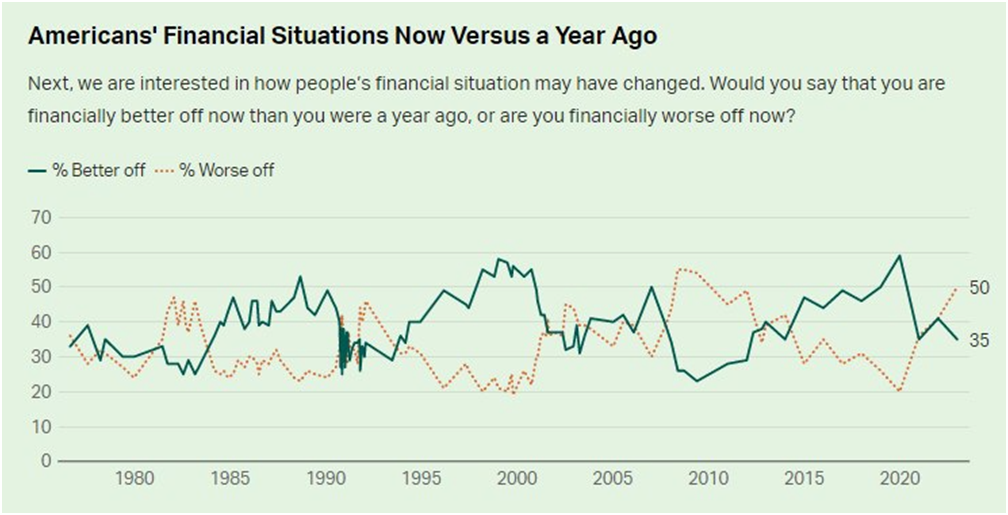
And in conclusion, an assessment of the future of financial markets from American citizens. I think it's not for nothing that citizens look at life with such pessimism.
Now, a few more numbers:

Finally, recently we hear a lot of things about Chinese economy "reopening" and that it should boost global growth. But, numbers tell the opposite. China feels not as good. At first glance, PPI is dropping, but this is the sign of slowdown, that perfectly agrees with the data that we've shown you in our previous reports. As we've said PBOC NET INJECTION HITS 1T YUAN IN 3 DAYS TO EASE CASH SQUEEZE

Due to fast slowdown in China, it makes impact on the US Export/Import data as well. And with slowdown in China it can't be any growth anywhere else isolately. Using these "secondary" indicators lets us to identify very important thing. While primary indicators, such as GDP, CPI, NFP and others shows positive changes, but "secondary" indicators show that we do not see corresponding shifts in growth. Inflation is slowing but no growth, employment is high but no growth etc. This disbalance might be due some lag in impact of high interest rates and second - lasting monetary support from the Fed, which reduce stimulus slower and sometimes even reverse it back. This is actually what PIMCO economist tells about...
Of course when you start talking about big fundamental processes it is difficult to be absolutely right, and it is more difficult to specify precise terms. But we're mostly tending to idea that recession has more chances to happen rather than not to happen. We remain sceptic on "soft landing" scenario.
Here is what analysts of big banks think about future EUR/USD performance. As you could see - nobody expects big moves. There are only 300 pips difference for 12 months - its nothing:
The dollar's recent comeback may not be indicative of a new broad trend, with FX strategists in a Reuters poll split on the greenback's path in the next few months.
There was no clear majority among analysts who answered an additional question on what the greater risk was to the dollar over the coming three months.
While 12 said it was that the greenback declines at a faster speed, 11 said it would decline at a slower speed. The remaining 19 said the dollar rising was the greater risk. However, the consensus view in the Feb. 2-7 poll of 66 forex strategists predicted the dollar to weaken over the next 12 months.
The euro up 1.5% against the dollar last month, its best start to the year since 2018, has since given up all of those gains. However, the common currency was forecast to strengthen from its current level to trade around $1.08, $1.09 and $1.11 in the next three, six and 12 months. That year-end prediction is around 3.5% higher from the $1.07 it was trading on Tuesday.
Median forecasts also showed the British pound strengthening from $1.20 to $1.24 in the next 12 months.
But much still depends on the outlook for the dollar.
Next week to watch
Tuesday's U.S. inflation data on the must-watch list. A strong inflation print could spark another rethink on whether the Fed will actually cut rates by year-end - potentially hurting a rally that has boosted stocks and bonds after last year's rout.
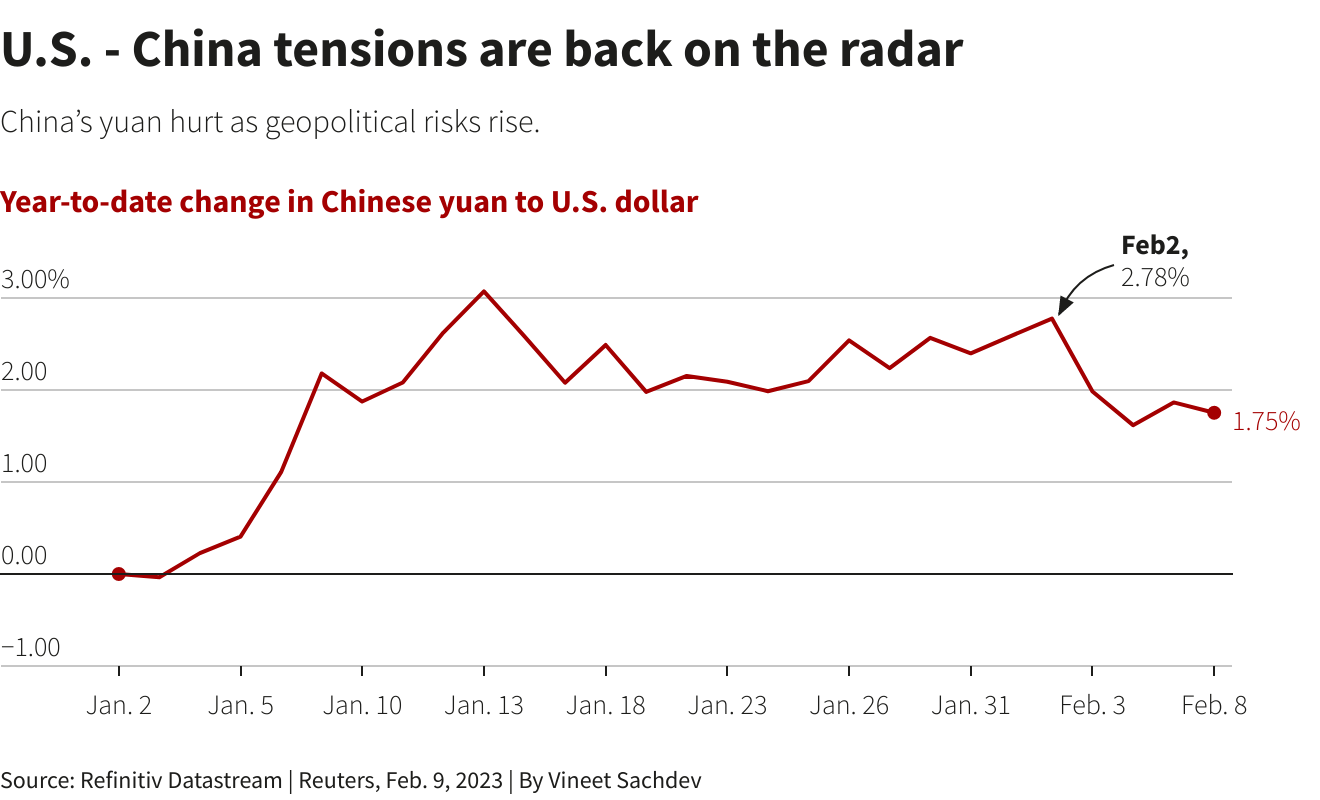
U.S.-China tensions are not new, but they have become fraught since former White House speaker Nancy Pelosi visited Taiwan last year. And almost a year on since Russia - NATO war started , investors know not to ignore geopolitical risks.
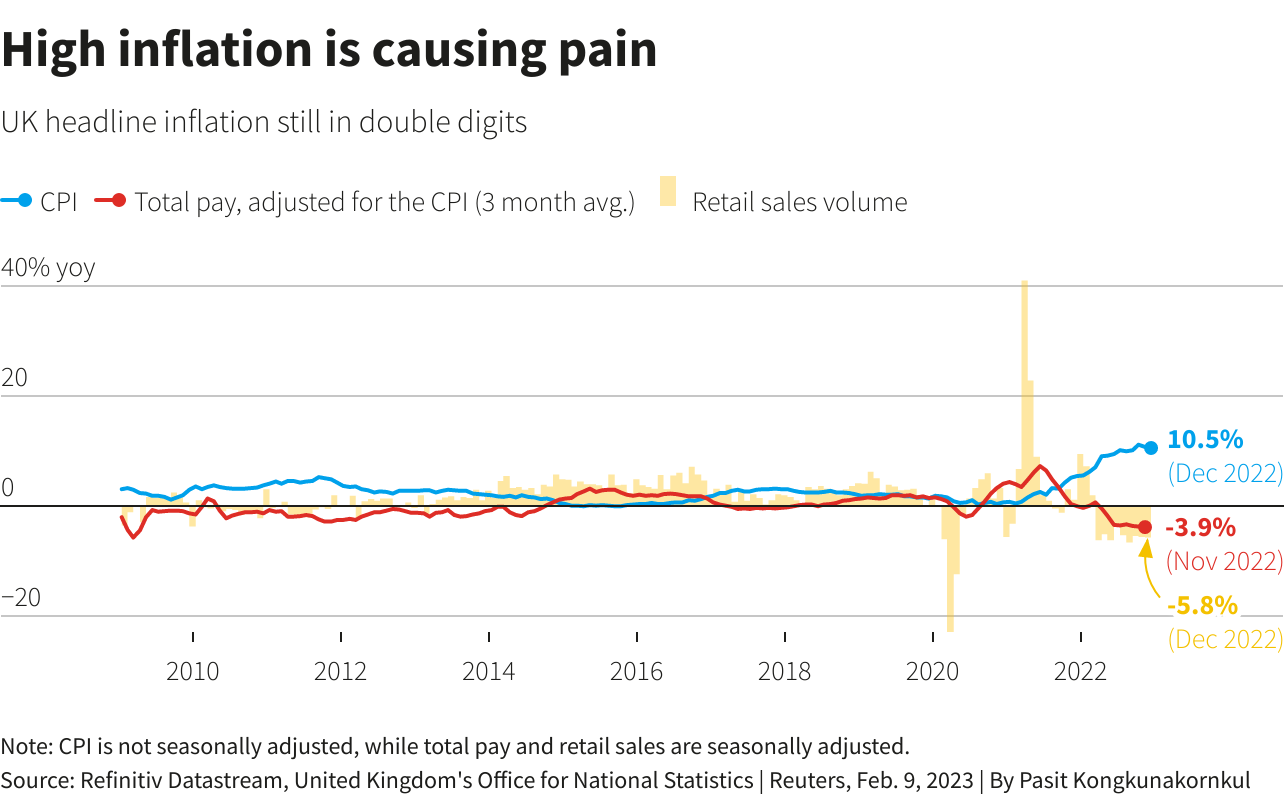
UK January's inflation report on Wednesday could show double-digit price rises, meaning no respite yet on the interest-rate front. With inflation-adjusted pay falling at its fastest since 2009, retail sales in December - when people are likely to splurge - fell by the most for that month in at least 25 years.
Friday's January retail sales data won't be much prettier. Consumers are certainly borrowing. Latest data shows credit card lending is around its highest since 2020, but that spending is not on houses - mortgage approvals are at 2009 lows - or out at the shops.
There are a lot of events happened this week. Some them are mostly related to politics or geopolitics, such as J. Biden to Congress speech and earthquake in Turkey. We discuss it tomorrow in Gold report. On economical stage we probably should mention J. Powell comments and few statistics data, such as PMI and see how market sentiment has changed, and how reasonable these changes are.
Market overview
In attempting to parse last week's blockbuster January jobs report, the Federal Reserve Chair on Tuesday reprised his take from last Wednesday's policy meeting - essentially that another couple of Fed rate hikes were probably needed to get across inflation fully, but that it was anyone's guess after that. After doubting Fed guidance all year, financial markets have taken one look at the strength of the labour market last month and stopped fighting the central bank. They now agree that two more quarter point hikes to just above 5% are in the pipeline by July - jarring stock and bond markets for a couple of days, but not much more.
Fed Chair Jerome Powell provided fuel for both sides of the argument at the Economic Club of Washington on Tuesday. He said rates might need to move higher if the U.S. economy remained strong, but reiterated "disinflation" is underway.
Despite some high-octane hawkishness from his colleagues - several more of whom are speaking on Wednesday - Powell seemed to reassure investors with some basic honesty about the peculiarity of this business cycle - and the dangers of extrapolating too much from a few data points or overcommitting on future policy moves.
"This cycle is different from other cycles...it has just confounded all sorts of attempts to predict," Powell admitted.
"We believe the data last week does not accurately reflect the U.S. economy. It isn't booming, although it clearly isn't on the verge of recession either," Columbia Threadneedle Investments economist Steven Bell wrote on Wednesday.
Euro bulls might have to curb their enthusiasm after the rush to buy the single currency may have left it vulnerable in the short term, particularly given the uncertainty about many global central banks' interest rate plans. The prospect of a milder recession thanks to falling energy prices and plentiful supplies of natural gas, coupled with China finally emerging from three years of harsh COVID restrictions, have ignited investor appetite for European assets generally.
"I'm still positive on the euro, but if I look at our positioning data, it shows that current longs in euro, or what we call 'current over-held positions', reached a record high," BNY Mellon EMEA strategist Geoffrey Yu said. The bar is extremely high for additional longs, or to add fresh euro exposure at current levels."
Such extreme positioning in an asset is often seen as a negative, as it suggests there are comparatively few investors left to buy and plenty who could decide to sell.
Proprietary iFlow positioning data from the custodian bank showed its clients' long euro positions against all other currencies (i.e. bets the euro will rise) are almost four times greater than the average position over the last 20 years, a record for the series.
Yu said some recovery was needed from September when "everyone was quite negative on the euro zone economy", but "this is overpricing things". Underweight positions in euro were almost three and a half times their usual size in September, according to the data.
The Commodity Futures Trading Commission's Commitment of Traders report shows a similar picture. The latest data, for the week to Jan. 24, shows an increase in net long euro positions to $18.3 billion. The euro's gains have not just been at the expense of the dollar. Against the pound , it rose to its highest in over five months last week and hit a near 14-year high against the Swedish crown this week.
"As long as gas prices were such an important driver for the euro, then higher or lower interest rates didn't matter. Now lower gas prices are allowing markets to look at interest rate differentials between Europe and the U.S.," said Francesco Pesole, currency strategist at ING.
Medium term however, ING still thinks the Fed will cut rates aggressively in the second half of this year, and rate differentials will once again drive the euro/dollar pair. That, they say, will push the euro to around $1.15 by the end of the second quarter of 2023.
The University of Michigan surveys on Friday showed a one-year inflation outlook of 4.2%, higher than the final number in January. The overall index of consumer sentiment came in at 66.4, up from 64.9 the prior month.
Aside from the Michigan data, revisions showed that U.S. monthly consumer prices rose in December instead of falling as previously estimated, while data for the prior two months was also revised higher, according to the Bureau of Labor Statistics.
Mazen Issa, senior FX strategist at TD Securities said next week's CPI report has been "put in the crosshairs because this morning we had indications that...inflation was on a stronger footing than initially perceived last year.""This is really challenging the idea that the Fed could cut rates and stronger data like payrolls, ISM (Institute for Supply Management) and continued tightness in labor markets are pushing the...higher-for-longer policy stance by the Fed...and that might what ends up happening. That puts the dollar back on the front foot."
Data next Tuesday is likely to show that the U.S. consumer price index (CPI) climbing 0.4% month-on-month in January and the core CPI gaining 0.4% as well, according to a Reuters poll. A sell-off in government debt set the day's tone. The yield on benchmark 10-year Treasury notes hit a more than one-month high and the 10-year German bund posted its biggest weekly rise this year as European Central Bank policymakers warned about inflation.
"For all the enthusiasm or hopeful optimism that the (Federal Reserve) will be cutting rates by the end of the year, I'm skeptical that that's going to happen," said Michael Arone, chief investment strategist for the U.S. SPDR business at State Street Global Advisors in Boston. "The economy, earnings and potentially the labor market won't look so good as this year wears on and maybe into next year. That doesn't necessary translate into market losses," he said.
"But I'm not seeing signals of ... quick decline in the economic data, and I am prepared for a longer fight," Federal Reserve Governor Christopher Waller said. The surprisingly strong gain of 517,000 jobs in January showed the economy was holding up well, for example, Waller said, but also meant that "labor income will also be robust and buoy consumer spending, which could maintain upward pressure on inflation in the months ahead. Though wage growth has slowed, the decline is "not enough," Waller said. "The Fed will need to keep a tight stance of monetary policy for some time. Though we have made progress reducing inflation, I want to be clear today that the job is not done," Waller said.
The European Central Bank may extend its streak of large interest hikes into May if core inflation doesn't ease by then, ECB policymaker Klaas Knot said on Wednesday.
The ECB raised interest rates by half a percentage point last week and pencilled in a move of the same magnitude for next month but kept options open for its following meeting in May, with sources telling Reuters they expected a 25- or 50- basis-point increase then.
So, who is right?
According to Fathom Consulting, markets are too optimistic on disinflation pace right now. In the case of the US, market pricing through last month implied a fall of some five percentage points from 7.1% in November 2022 to just over 2.0% in November 2023. The speed of the disinflation that is priced in is the fastest we have seen since the global financial crisis; before that, we must look as far back as the recession of the early 1980s for a similarly steep decline. Could the US really disinflate that rapidly, and still avoid recession? That is what equity investors are hoping for; and there is plentiful evidence that the market is pricing in a Goldilocks scenario of low inflation and strong growth. For us, this is too optimistic – curbing double digit inflation almost always requires pushing the economy into a recession.
At the same time Fathom points on multiple positive shifts in overall data - high employment, turing of ISM index, decreasing inflation across the board - CPI, wages, regional indicators etc.
In other words, the US economy is so far evolving precisely as we said it must if a recession were to be avoided. Those two conditions were necessary; however, they may not be sufficient to ensure continued expansion. What we continue to find troubling is the scale of the historical precedent. The US has never avoided recession with consumer confidence as low as it has been in recent months. It has once avoided recession with inflation as high as it has been in recent months, but that was as long ago as 1952 (in time of a Gold standard that is incomparable).
The chief executive of JPMorgan Chase & Co., the biggest U.S. bank, cautioned against declaring victory against inflation too early, warning the Federal Reserve could raise interest rates above the 5% mark if higher prices ended up "sticky." In reference to inflation, Dimon said "people should take a deep breath on this one before they declare victory because a month’s number looked good."
"It’s perfectly reasonable for the Fed to go to 5% and wait a while," Dimon said. But if inflation comes down to 3.5% or 4% and stays there, "you may have to go higher than 5% and that could affect short rates, longer rates," he said.
U.S. bond manager Pacific Investment Management Company (PIMCO) is sticking to its previous forecast that the U.S. economy is headed toward a recession, despite recent data indicating economic resilience. Tiffany Wilding, PIMCO North American economist, said the strong economic data suggests a recession may come later than previously expected, but remains likely.
"Recent data on net haven’t caused us to change our outlook for a mild U.S. recession – we’re only pushing the timing back a little bit," she said in a note. Although market-based measures of financial conditions have eased somewhat recently, financial conditions are still tight by historical standards," Wilding said. We think it’s under-appreciated how much tightening pressure the overnight rate actually puts on the economy."
So, it seems that recession alarm bells are ringing, but (much) less loudly than before. The major arguments of optimists are rapid reopening of China's economy, plunging European gas prices and cooling U.S. inflation suggest a global recession may not be as deep and protracted as feared just weeks ago. That's propelled by the so-called Goldilocks view that the global economy will cool just enough to quell inflation, but not so much that earnings will collapse.
Some of the world's largest companies including Meta, IBM and Amazon are cutting thousands of jobs. But many of the layoffs are from beaten down tech firms that hired aggressively during the pandemic, Goldman Sachs economist Ronnie Walker notes.
"These characteristics suggest that the companies conducting layoffs are not representative of the broader economy," Walker said.
Most economists still expect a U.S. recession, but businesses and some banks have cut the probability of one. Others note that future growth indicators such as manufacturing activity, housing market data and consumer confidence remain bleak.
"A lot of leading indicators and surveys look quite abysmal at face value, although many of them are stabilizing or even bouncing back," said Patrick Saner, head of macro strategy at Swiss Re. "In the context of inflation, though, core services is what matters and that is underpinned by a still very strong labor market that isn't showing many signs of slowing."
Major indicators look confusing, what we're gonna do now?
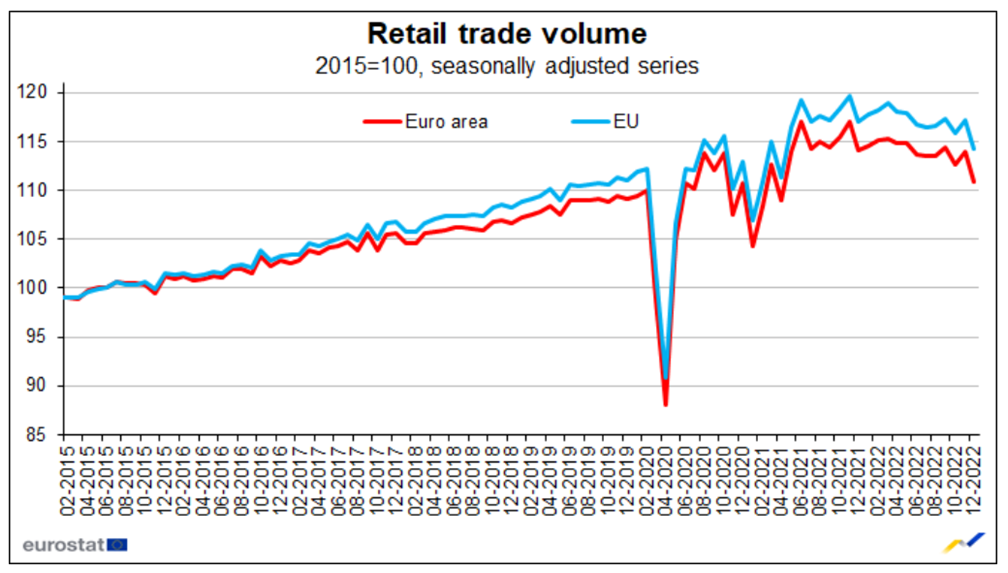
The answer is simple - let's dig a bit deeper and take a look at secondary indicators, a kind of data of a "second stage". And here is what we see. Retail Volume decreasing as in EU as in the US. As we have repeatedly shown, this indicator has replaced inflation in the dynamics of the crisis (the specifics of the structural crisis, it is constantly moving from industry to industry). Now industry and retail sales are coming out on top. Theoretically, the volume of construction is competing with them, but most likely, in the near future the government will begin to support mortgages (this is too important a social factor). At the same time, of course, inflation may jump again …
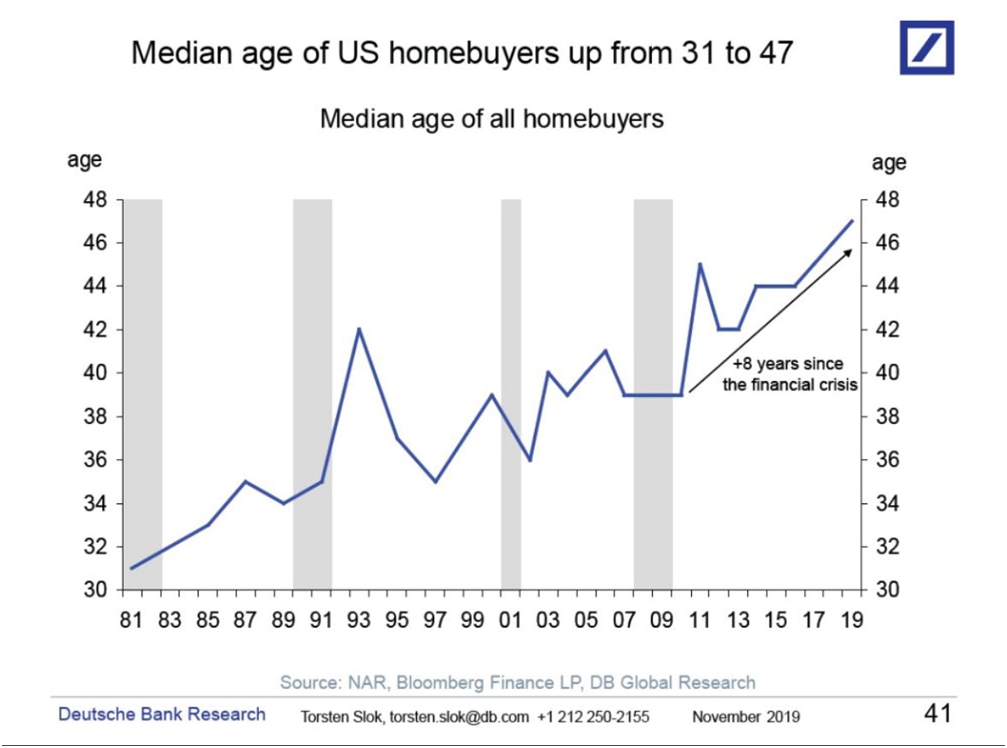
The average age of the home buyer in the US. It turns out that if before the beginning of the 2008 crisis this age rarely exceeded 40 years, now it has risen to almost 50 ... Of course, this could mean an elongation of the psychological perception of youth, but the economic component also cannot be ignored:
Next, local problems, already purely Biden. Quarterly changes in deposits in American banks. There are no comments here:
And now - bing. Orange juice - either inflation still exists or we have a lack of oranges around the world...
In 2022, credit card debt in the United States reached a record high of $960.6 billion. This is 18% more than a year ago! The average debt per person is $5805. And the rate on credit cards in 2022 was at a peak of 18.94% per annum.
And in conclusion, an assessment of the future of financial markets from American citizens. I think it's not for nothing that citizens look at life with such pessimism.
Now, a few more numbers:
Finally, recently we hear a lot of things about Chinese economy "reopening" and that it should boost global growth. But, numbers tell the opposite. China feels not as good. At first glance, PPI is dropping, but this is the sign of slowdown, that perfectly agrees with the data that we've shown you in our previous reports. As we've said PBOC NET INJECTION HITS 1T YUAN IN 3 DAYS TO EASE CASH SQUEEZE
Due to fast slowdown in China, it makes impact on the US Export/Import data as well. And with slowdown in China it can't be any growth anywhere else isolately. Using these "secondary" indicators lets us to identify very important thing. While primary indicators, such as GDP, CPI, NFP and others shows positive changes, but "secondary" indicators show that we do not see corresponding shifts in growth. Inflation is slowing but no growth, employment is high but no growth etc. This disbalance might be due some lag in impact of high interest rates and second - lasting monetary support from the Fed, which reduce stimulus slower and sometimes even reverse it back. This is actually what PIMCO economist tells about...
Of course when you start talking about big fundamental processes it is difficult to be absolutely right, and it is more difficult to specify precise terms. But we're mostly tending to idea that recession has more chances to happen rather than not to happen. We remain sceptic on "soft landing" scenario.
Here is what analysts of big banks think about future EUR/USD performance. As you could see - nobody expects big moves. There are only 300 pips difference for 12 months - its nothing:
The dollar's recent comeback may not be indicative of a new broad trend, with FX strategists in a Reuters poll split on the greenback's path in the next few months.
There was no clear majority among analysts who answered an additional question on what the greater risk was to the dollar over the coming three months.
While 12 said it was that the greenback declines at a faster speed, 11 said it would decline at a slower speed. The remaining 19 said the dollar rising was the greater risk. However, the consensus view in the Feb. 2-7 poll of 66 forex strategists predicted the dollar to weaken over the next 12 months.
"In the shorter run there's some chance for the dollar to gain a bit...especially if the data stays relatively good and the Fed gets in at least two more hikes and there is some upside risk to the terminal rate for the Fed," said Brian Rose, senior economist at UBS Global Wealth Management.
The euro up 1.5% against the dollar last month, its best start to the year since 2018, has since given up all of those gains. However, the common currency was forecast to strengthen from its current level to trade around $1.08, $1.09 and $1.11 in the next three, six and 12 months. That year-end prediction is around 3.5% higher from the $1.07 it was trading on Tuesday.
Median forecasts also showed the British pound strengthening from $1.20 to $1.24 in the next 12 months.
But much still depends on the outlook for the dollar.
So, if we see these processes in the US - the same will happen in EU. Besides, some political reasons exist, why it could be faster in EU and more devastating. We will discuss this in our Gold report tomorrow. Based on all things that we've discussed today - I do not see any prove of the US economy growth by far. What I see is market overreaction as in positive as in negative side, depending on the news background. This makes evident emotional tiredness and instability, market misunderstanding of ongoing situation, indecision. So we should be ready to big volatility but the background seems insufficient for changing of major tendency by far."We continue to expect the dollar to weaken - a number of factors sort of underpin that view. We do think the U.S. economy is likely to continue to slow but the most recent data we got on Friday certainly push us back against that hypothesis," said Brian Daingerfield, head of G10 currency strategy at NatWest Markets. "We also think inflation pressure is likely to continue to moderate as we go through the year and so we're seeing less upside risk to the fed funds rate or the path of the fed funds rate as an upside risk to the dollar."
Next week to watch
Tuesday's U.S. inflation data on the must-watch list. A strong inflation print could spark another rethink on whether the Fed will actually cut rates by year-end - potentially hurting a rally that has boosted stocks and bonds after last year's rout.
U.S.-China tensions are not new, but they have become fraught since former White House speaker Nancy Pelosi visited Taiwan last year. And almost a year on since Russia - NATO war started , investors know not to ignore geopolitical risks.
UK January's inflation report on Wednesday could show double-digit price rises, meaning no respite yet on the interest-rate front. With inflation-adjusted pay falling at its fastest since 2009, retail sales in December - when people are likely to splurge - fell by the most for that month in at least 25 years.
Friday's January retail sales data won't be much prettier. Consumers are certainly borrowing. Latest data shows credit card lending is around its highest since 2020, but that spending is not on houses - mortgage approvals are at 2009 lows - or out at the shops.