Sive Morten
Special Consultant to the FPA
- Messages
- 18,644
Monthly
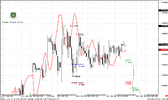
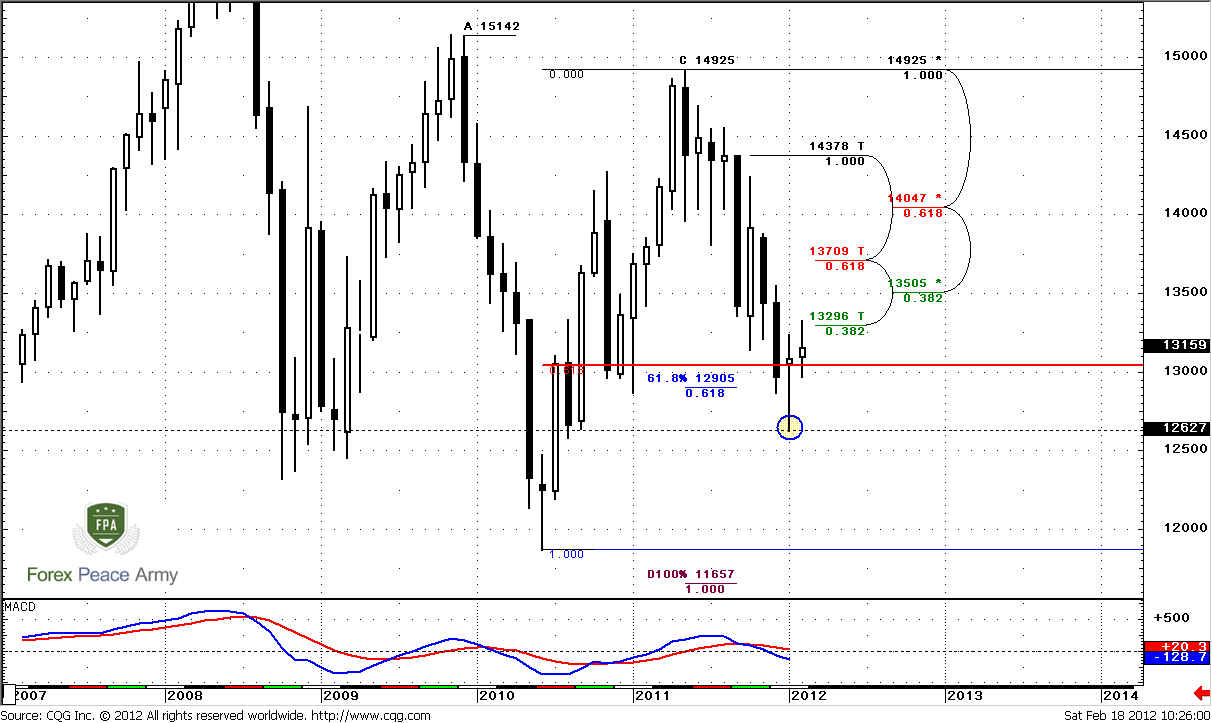
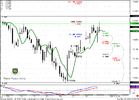
Trend is bearish, market is not at oversold. In fact I leave previous analysis of monthly time frame intact. One thing that I would like to add is that market has touched first Fib resistance level at 1.3296. Here we see almost the same candle for February as on previous week.
Currently market is showing some pullback that may be a respect of our Agreement level. January’s candle forces me to search for some analogues in closest past, so, if you will take a look at recent bottoms on monthly chart you will find the same pattern as in January. This is type of hammer with small body and close slightly below top. Current price action is a bit shallow for now. So it does not add more information. One thing that we have to note still is that market has returned back above 0.618 support and January has closed above it also. That could be important. Next monthly target stands as AB=CD pattern at 1.1650. Since market has reached just 0.618 target, retracement should not be too deep. I suppose to 1.3505-1.3707 as max.
There are two significant levels of resistance at monthly chart that are mostly close to current price action – 1.3296 as 0.382 resistance from solid thrust bar down and 1.3505 – major 0.382 resistance level. From perspective of hammer pattern, we can say that downward move has continued only if price will take out its low 1.2627.
Conclusion from monthly chart is as follows – market has found some support and now under way to respect it by bullish hammer pattern. Breakout of 1.2627 can be as indicator of reestablishing downward trend, while to the upside nearest resistances are 1.3296 and 1.3505
Weekly
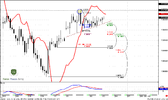
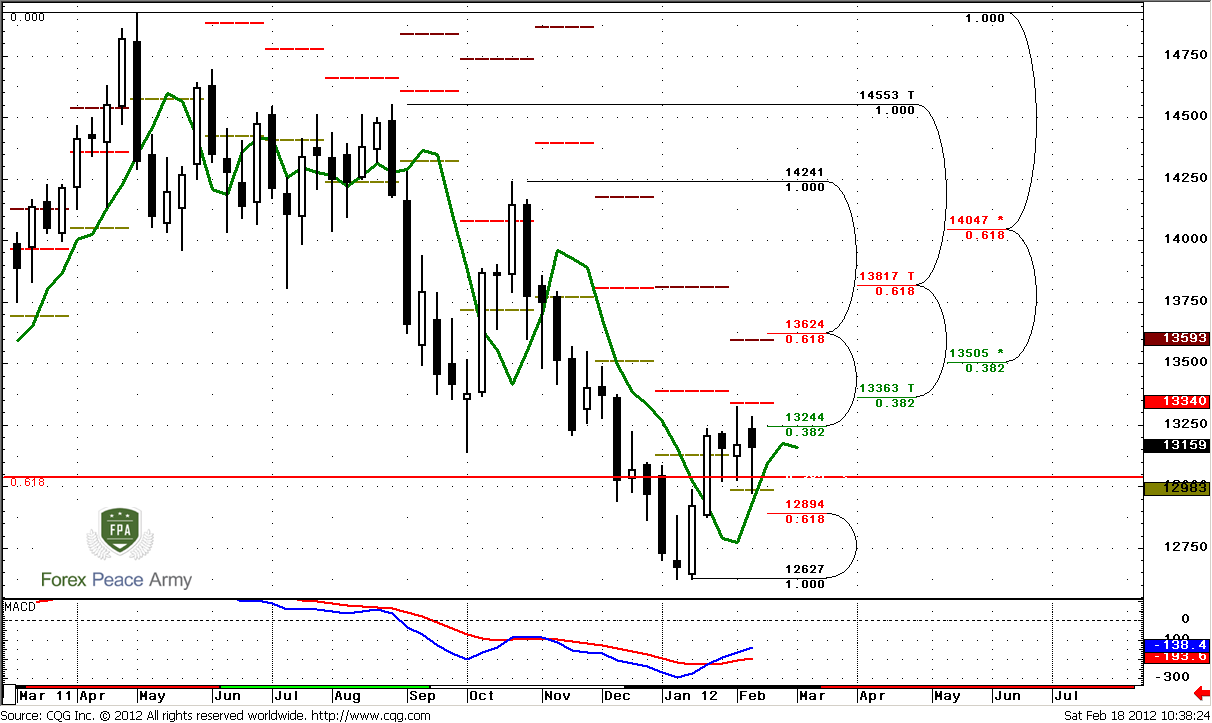
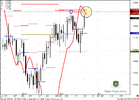
Trend here is bullish. Market is not at overbought/oversold. During previous weeks we’ve talked about B&B “Sell” pattern, with target around 1.29 level. Today I would like to discuss with you some thoughts about perspective of this pattern. In two words – we have to be careful; because some signs have appeared that we just can’t skip out.
Looking at details, what is a B&B in general? B&B is a pattern that based on momentum of the market. That’s all. Applying to it some targets (0.618) and triggering conditions (length of the thrust, number of closes beyond 3x3 DMA etc.) are based just on probability. It means that although this pattern almost always works, but achieving predefined targets and conditions is a not rule of thumb. Probability suggests that in most cases – it will happen, but not always. Why I’m speaking about it…
Take a look at weekly time frame. When market has started move down during previous week – it has reached 50% target, but not 0.618. Now I want to ask – can B&B been completed with just 50% retracement but not with 0618? Absolutely, why not. By this statement I do not want to say, that it will not proceed to 0.618. I just want to say that we have to be flexible enough when we deal with such kind of pattern, and when destination is based at such unstable issue as market’s momentum. What else can we see here?
In favor of bullish standpoint we might say following thoughts. Market stands above monthly pivot second month in a row. Second is, market holds 3rd week above monthly 0.618 support level, and during previous 3 weeks trading range was relatively tight, compares to other weeks. Trend has turned bullish. And last one is – B&B is short-term pattern. It finishes when market reaches its target. B&B is not a reversal pattern and when it comes to an end – our major focus turns to trend direction. Based on monthly analysis we can’t exclude retracement to 1.3505-1.3650 K-resistance, especially when we have weekly trend is still bullish.
From bearish perspective we can say that pivot resistance still holds upward move, suggesting that market could continue move lower right from that area. And, as we know – retracement in long-term bear trend usually held by pivot resistance 1.
So, what we can say from this contradictive view on weekly time frame? The most important is to be flexible when dealing with such as issue as market momentum. There are some worries signs exist for perspective of achieving 1.29. We have to be careful and be ready to react fast if lower time frames will give us the clue that market sentiment has changed.
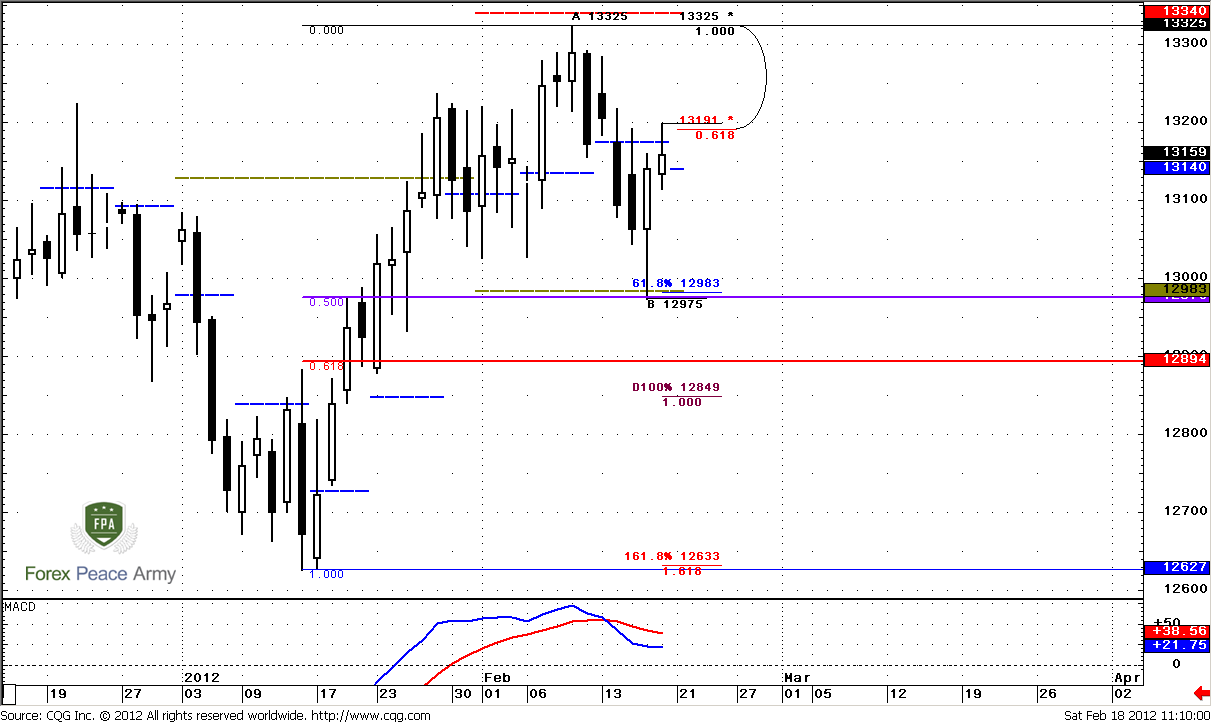
Daily
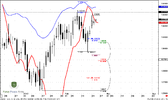
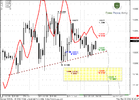
In current environment daily analysis is much simpler than on previous week. Trend is bearish. Market has reached major 0.618 resistance as we’ve planned on yesterday’s trading plan and pushed back from it. So, if you’ve entered short, as we suggested – this is excellent chance to eliminate risk and move your stops to breakeven. That’s why we always recommend entering at some significant levels – even if you will become wrong, in most cases market somehow, even with shallow retracement, but respect this level. This will allow you to move your stop to breakeven. That should be done, I suppose.
Here we will not guess and gamble about B&B. We will base on absolute things. What are they? First of all this is trend direction. It’s bearish and holds 0.618 market retracement. If you’ve read our Forex Military School and part dedicated to multiple time frame analysis, you should understand trend compounding technique. We have bullish trend on weekly and bearish trend on daily. What does it mean and how it can be traded purely on trend direction? Even if we will not take into consideration bearish directional weekly pattern (and direction overrules trend), it means that market will show deeper downward retracement on daily. Second is that we can enter long, based on weekly time frame only when daily trend will turn bullish. By these thoughts we get clear picture what to watch for and what is a crucial moment for daily time frame and weekly B&B trade:
- If daily trend will turn bullish then we will have to search possibility to enter Long.
- Until this will happen market has chances to show deeper move down.
That’s why from this standpoint, 1.3190 level is important. If market will proceed higher, then there will not be any resistance above it and it makes trend shifting to bullish very probable.
So, trading plan for daily time frame is hold bearish position (if you have it), move stop to breakeven. If market will take out 1.32 area – sit on hands and wait for further clarification and confirmation of bullish bias. In this case chances to reach 1.29 will contract significantly.
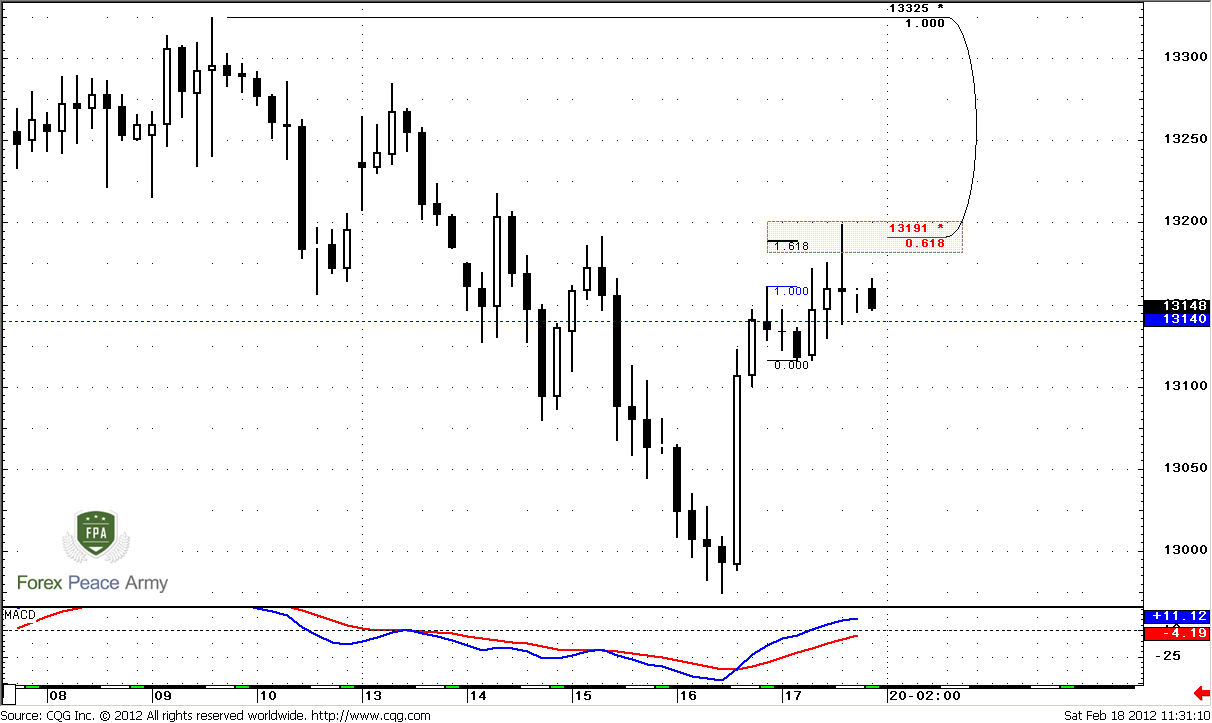
4-hour
Trend is bullish here. In fact we do not see anything, but respect of area that we’ve pointed yesterday. 1.3140 is pivot point for coming week. This is our advantage that it stands close to current price action. Probably, based on market behavior around it we can understand its sentiment sooner rather than later.
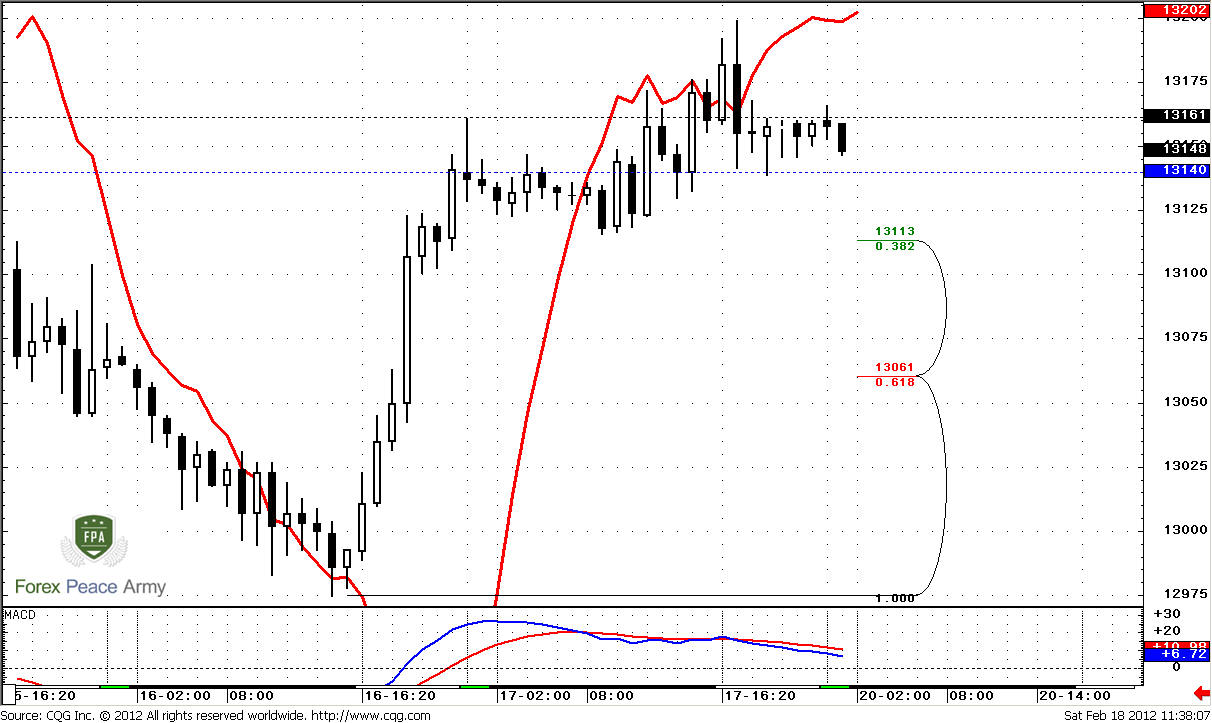
1-hour
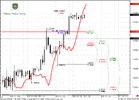
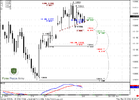
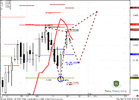
Trend is bearish, I remain as MACDP as simple MACD just to show how they add-on each other. On simple MACD we see bearish divergence right at 0.618 daily resistance, while on MACDP we see stop grabber pattern, that suggests move below pivot point. Also this perfect bearish engulfing pattern is nothing else as W&R of 1.3191 level and grabbing stops above it. This is also bearish pattern. Nearest support level is 1.3113 next one is 1.3061. Here we have context for Monday:
- Daily trend is bearish, hourly trend is bearish. If you do not have short position you can get it at nearest upward retracement, when it will happen – probably after reaching of some support level;
- Crucial level is 1.3202. If market will take it – this will mean that market could shift to bullish bias, as we’ve discussed already.
Conclusion:
Long-term bias still holds bearish, but market now turning to some pause by respect Agreement area on monthly time frame. Retracement even to 1.35-1.3650 will be normal. We can speak about downward continuation only if market will take low at 1.2627.
Weekly time frame is one that mostly shows market indecision. Although we have bearish directional momentum pattern B&B “Sell” with theoretical target at 1.29, at the same time there are some potentially bullish hints there. It forces us to be very careful to details and price action on lower time frames.
Still, daily time frame currently holds bearish bias – 0.618 retracement at bearish trend is absolutely normal price action. Based on our analysis we have to watch for couple of things – daily trend and 1.32 level. If market will erase bearish bias on hourly time frame by taking out 1.32 level and later will shift daily trend to bullish – these moments are particularly reason to change our view on medium-term perspectives to bullish. The same moments probably will destroy perspectives of weekly B&B to reach 1.29 area.
The technical portion of Sive's analysis owes a great deal to Joe DiNapoli's methods, and uses a number of Joe's proprietary indicators. Please note that Sive's analysis is his own view of the market and is not endorsed by Joe DiNapoli or any related companies.
Trend is bearish, market is not at oversold. In fact I leave previous analysis of monthly time frame intact. One thing that I would like to add is that market has touched first Fib resistance level at 1.3296. Here we see almost the same candle for February as on previous week.
Currently market is showing some pullback that may be a respect of our Agreement level. January’s candle forces me to search for some analogues in closest past, so, if you will take a look at recent bottoms on monthly chart you will find the same pattern as in January. This is type of hammer with small body and close slightly below top. Current price action is a bit shallow for now. So it does not add more information. One thing that we have to note still is that market has returned back above 0.618 support and January has closed above it also. That could be important. Next monthly target stands as AB=CD pattern at 1.1650. Since market has reached just 0.618 target, retracement should not be too deep. I suppose to 1.3505-1.3707 as max.
There are two significant levels of resistance at monthly chart that are mostly close to current price action – 1.3296 as 0.382 resistance from solid thrust bar down and 1.3505 – major 0.382 resistance level. From perspective of hammer pattern, we can say that downward move has continued only if price will take out its low 1.2627.
Conclusion from monthly chart is as follows – market has found some support and now under way to respect it by bullish hammer pattern. Breakout of 1.2627 can be as indicator of reestablishing downward trend, while to the upside nearest resistances are 1.3296 and 1.3505
Weekly
Trend here is bullish. Market is not at overbought/oversold. During previous weeks we’ve talked about B&B “Sell” pattern, with target around 1.29 level. Today I would like to discuss with you some thoughts about perspective of this pattern. In two words – we have to be careful; because some signs have appeared that we just can’t skip out.
Looking at details, what is a B&B in general? B&B is a pattern that based on momentum of the market. That’s all. Applying to it some targets (0.618) and triggering conditions (length of the thrust, number of closes beyond 3x3 DMA etc.) are based just on probability. It means that although this pattern almost always works, but achieving predefined targets and conditions is a not rule of thumb. Probability suggests that in most cases – it will happen, but not always. Why I’m speaking about it…
Take a look at weekly time frame. When market has started move down during previous week – it has reached 50% target, but not 0.618. Now I want to ask – can B&B been completed with just 50% retracement but not with 0618? Absolutely, why not. By this statement I do not want to say, that it will not proceed to 0.618. I just want to say that we have to be flexible enough when we deal with such kind of pattern, and when destination is based at such unstable issue as market’s momentum. What else can we see here?
In favor of bullish standpoint we might say following thoughts. Market stands above monthly pivot second month in a row. Second is, market holds 3rd week above monthly 0.618 support level, and during previous 3 weeks trading range was relatively tight, compares to other weeks. Trend has turned bullish. And last one is – B&B is short-term pattern. It finishes when market reaches its target. B&B is not a reversal pattern and when it comes to an end – our major focus turns to trend direction. Based on monthly analysis we can’t exclude retracement to 1.3505-1.3650 K-resistance, especially when we have weekly trend is still bullish.
From bearish perspective we can say that pivot resistance still holds upward move, suggesting that market could continue move lower right from that area. And, as we know – retracement in long-term bear trend usually held by pivot resistance 1.
So, what we can say from this contradictive view on weekly time frame? The most important is to be flexible when dealing with such as issue as market momentum. There are some worries signs exist for perspective of achieving 1.29. We have to be careful and be ready to react fast if lower time frames will give us the clue that market sentiment has changed.
Daily
In current environment daily analysis is much simpler than on previous week. Trend is bearish. Market has reached major 0.618 resistance as we’ve planned on yesterday’s trading plan and pushed back from it. So, if you’ve entered short, as we suggested – this is excellent chance to eliminate risk and move your stops to breakeven. That’s why we always recommend entering at some significant levels – even if you will become wrong, in most cases market somehow, even with shallow retracement, but respect this level. This will allow you to move your stop to breakeven. That should be done, I suppose.
Here we will not guess and gamble about B&B. We will base on absolute things. What are they? First of all this is trend direction. It’s bearish and holds 0.618 market retracement. If you’ve read our Forex Military School and part dedicated to multiple time frame analysis, you should understand trend compounding technique. We have bullish trend on weekly and bearish trend on daily. What does it mean and how it can be traded purely on trend direction? Even if we will not take into consideration bearish directional weekly pattern (and direction overrules trend), it means that market will show deeper downward retracement on daily. Second is that we can enter long, based on weekly time frame only when daily trend will turn bullish. By these thoughts we get clear picture what to watch for and what is a crucial moment for daily time frame and weekly B&B trade:
- If daily trend will turn bullish then we will have to search possibility to enter Long.
- Until this will happen market has chances to show deeper move down.
That’s why from this standpoint, 1.3190 level is important. If market will proceed higher, then there will not be any resistance above it and it makes trend shifting to bullish very probable.
So, trading plan for daily time frame is hold bearish position (if you have it), move stop to breakeven. If market will take out 1.32 area – sit on hands and wait for further clarification and confirmation of bullish bias. In this case chances to reach 1.29 will contract significantly.
4-hour
Trend is bullish here. In fact we do not see anything, but respect of area that we’ve pointed yesterday. 1.3140 is pivot point for coming week. This is our advantage that it stands close to current price action. Probably, based on market behavior around it we can understand its sentiment sooner rather than later.
1-hour
Trend is bearish, I remain as MACDP as simple MACD just to show how they add-on each other. On simple MACD we see bearish divergence right at 0.618 daily resistance, while on MACDP we see stop grabber pattern, that suggests move below pivot point. Also this perfect bearish engulfing pattern is nothing else as W&R of 1.3191 level and grabbing stops above it. This is also bearish pattern. Nearest support level is 1.3113 next one is 1.3061. Here we have context for Monday:
- Daily trend is bearish, hourly trend is bearish. If you do not have short position you can get it at nearest upward retracement, when it will happen – probably after reaching of some support level;
- Crucial level is 1.3202. If market will take it – this will mean that market could shift to bullish bias, as we’ve discussed already.
Conclusion:
Long-term bias still holds bearish, but market now turning to some pause by respect Agreement area on monthly time frame. Retracement even to 1.35-1.3650 will be normal. We can speak about downward continuation only if market will take low at 1.2627.
Weekly time frame is one that mostly shows market indecision. Although we have bearish directional momentum pattern B&B “Sell” with theoretical target at 1.29, at the same time there are some potentially bullish hints there. It forces us to be very careful to details and price action on lower time frames.
Still, daily time frame currently holds bearish bias – 0.618 retracement at bearish trend is absolutely normal price action. Based on our analysis we have to watch for couple of things – daily trend and 1.32 level. If market will erase bearish bias on hourly time frame by taking out 1.32 level and later will shift daily trend to bullish – these moments are particularly reason to change our view on medium-term perspectives to bullish. The same moments probably will destroy perspectives of weekly B&B to reach 1.29 area.
The technical portion of Sive's analysis owes a great deal to Joe DiNapoli's methods, and uses a number of Joe's proprietary indicators. Please note that Sive's analysis is his own view of the market and is not endorsed by Joe DiNapoli or any related companies.
")