TradeSpotting
Private
- Messages
- 12
Hi Sive,
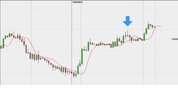
I'm watching for a triangle breakout on the 4 hr chart as part of a possible move up to the 1.36 level.
Mon is a holiday in the USA so will prob wait until Tuesday of this week.


I'm watching for a triangle breakout on the 4 hr chart as part of a possible move up to the 1.36 level.
Mon is a holiday in the USA so will prob wait until Tuesday of this week.
Last edited:
")