Sive Morten
Special Consultant to the FPA
- Messages
- 18,648
Today I’ve decided to talk about Australian dollar. First, because we do not speak about it for a long time (since November 2010, I suppose), second, because it has some good patterns. Giant 2, by the way, makes excellent work with fundamentals, so we will take a look at technical analysis purely.
Take a note however, that this is a futures chart so the quotes are a bit different to the spot market. But I’m sure that you will be able to draw the same levels by yourself.
I suggest you to read this analysis very carefully, because it a bit advance and contains a lot of non-obvious conclusions.
Monthly
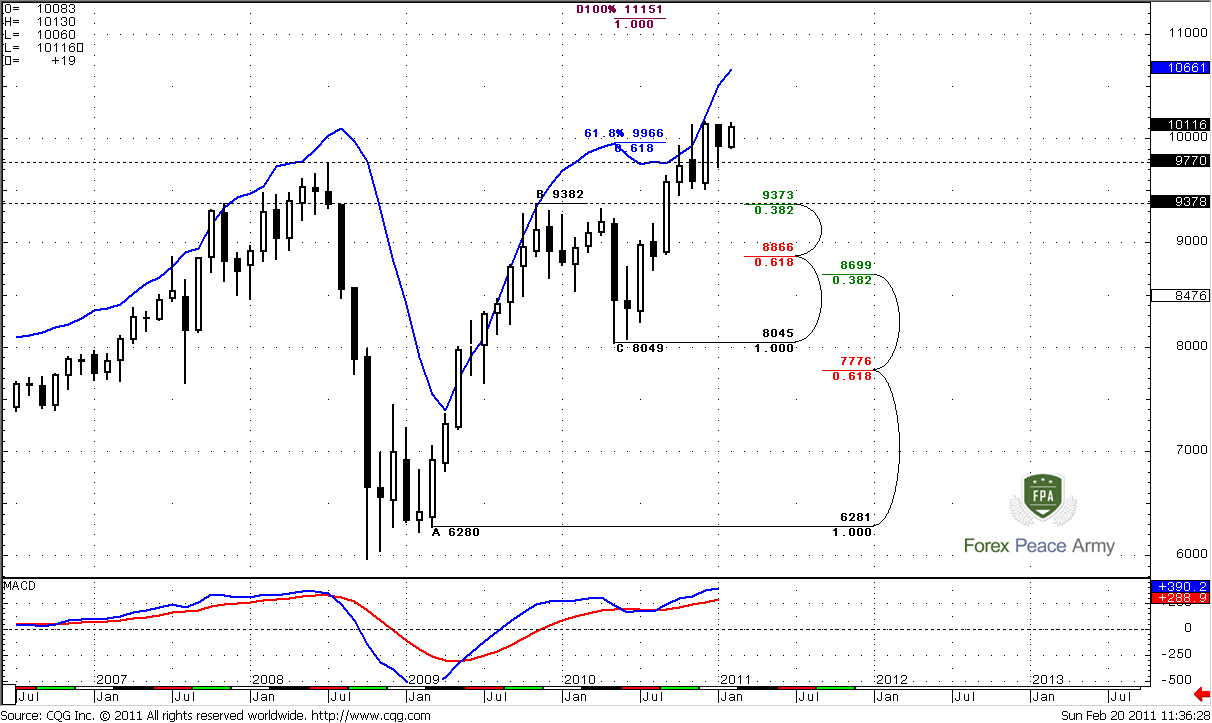
Monthly trend is strongly bullish; price action fully supports the trend direction. Although overall picture looks clear, there are some nuances here, that are not so obvious and allow as to make some assumptions about further market price action. First of all, as you can see market has reached 61.8 Fib expansion from ABC pattern. Simultaneously it has hit monthly overbought? Usually normal price action suggests that market should bounce to the downside. And what do we see after that - nothing. Market has not even a budge from there. It just stands near the overbought and continue to creep with it to the upside. As you can see – it didn’t show even 3/8 retracement from the latest reaction point (C=0.8049). This is a bullish sign.
Second, market holds above the previous highs at 0.9770 for third month in a row. This tells us than this is not a Wash&Rinse and true breakout has happened. Market also didn’t even touch highs at 0.9382, when it accelerated to the upside. All these things make me think that market is strong enough to continue move to the upside. Also, take a look – during the BC retracement – it was just 0.382 from AB swing. This is a sign of strength.
Just below the market some levels of support. First is a previous highs at 0.9770, second – 0.9373 Fib support and 0.9382 previous highs, and strong area of monthly Confluence resistance at 0.8699-0.8866. The level of monthly oversold, by the way, stands just below this area at 0.8476.
So, for confirmation of the strength of the market, I prefer do to see that market will hold above 0.9770. It gives me more confidence for bullish view. Currently we see it.
Weekly
Weekly time frame contains the most important information amongst other time frames. On the #1 chart we see, that market has reached and exceeded 100% expansion target and turned to consolidation. MACD clearly shows bearish divergence – this is excellent, because public usually takes such signals but we should do not the same as public. This is an excellent and very bullish context on weekly time frame. And the major reason for this is a bullish dynamic pressure. See –trend turns bearish, but price action does not confirm that. It’s viewed even more clearly with MACDP indicator (red line) – see, how market just stands below it.
Second – 1.618 Fib target at 1.0253 and it stands just above the market. I will not even think about shorting this market until this target will not be hit by the market.
Third – market stands above February pivot at 0.9932 and during three previous week push monthly pivot resistance.
Also I’ve marked support levels just below the market…
#1
Now, let’s take a look at most recent price action on #2 chart. Besides, 1.618 target we have 100% target from most recent AB-CD pattern at 1.0383 and 1.27 Expansion target from recent retracement (it’s not a butterfly, because next top at B point is higher). 1.618 target stands at 1.0518 - very close to weekly overbought.
#2
Currently we can’t estimate – will it be long move up or just hitting of 1.618 target, but I think that it’s not a big deal. Reaching of 1.025 is already solid move, and it will be enough, even if market will not continue go up further.
Daily
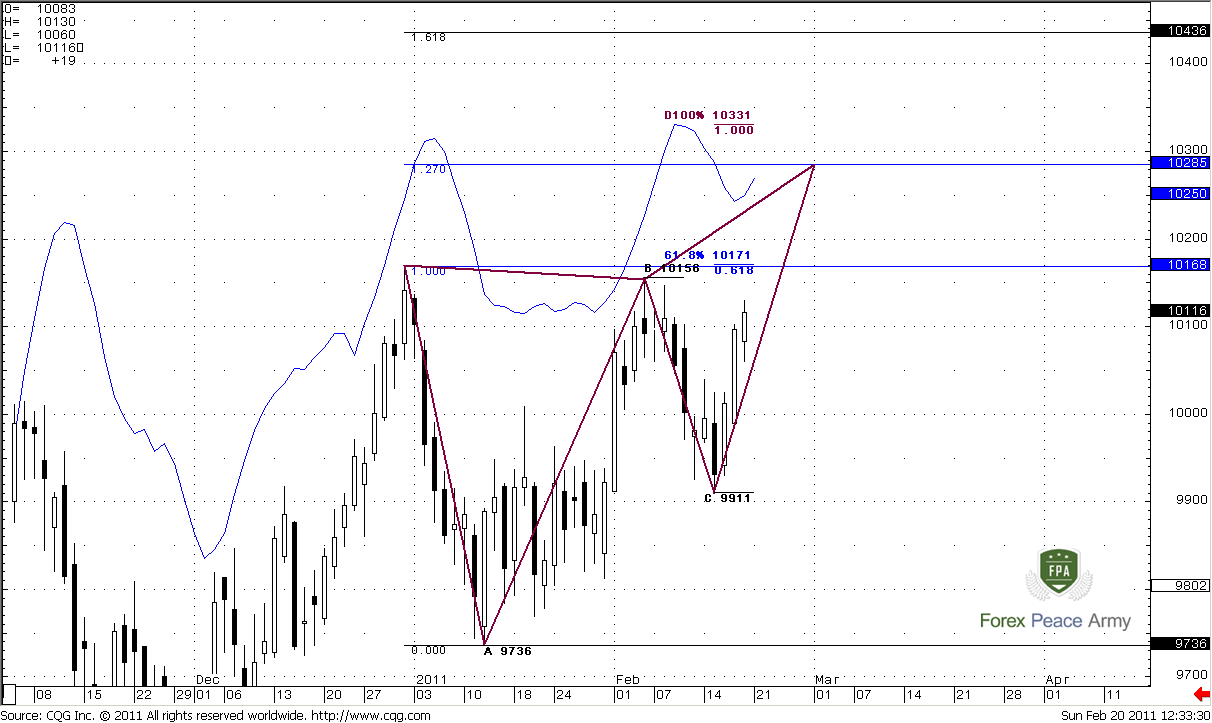
Daily chart is also overload with important information, so we will use two charts to analyze it. Let’s start from #1 and take a brief picture first. On Friday trend has turned bullish. Also take a look that market stands between pivot point and pivot resistance 1. This is moderately bullish sign. Although you can see that bearish wedge is forming on the market, it upper border is far enough from current market and take a note where it stands – around 1.030 area that also a monthly pivot resistance 2 and couple of weekly targets that we’ve just discussed.
Another important moment – take a look at ABC pattern that I’ve marked. 0.618 target is above the previous highs. It means that if market will continue move up (and I expect that this should happen) the stops that have been placed above these highs will be triggered and this will add fuel to further move up.
#1
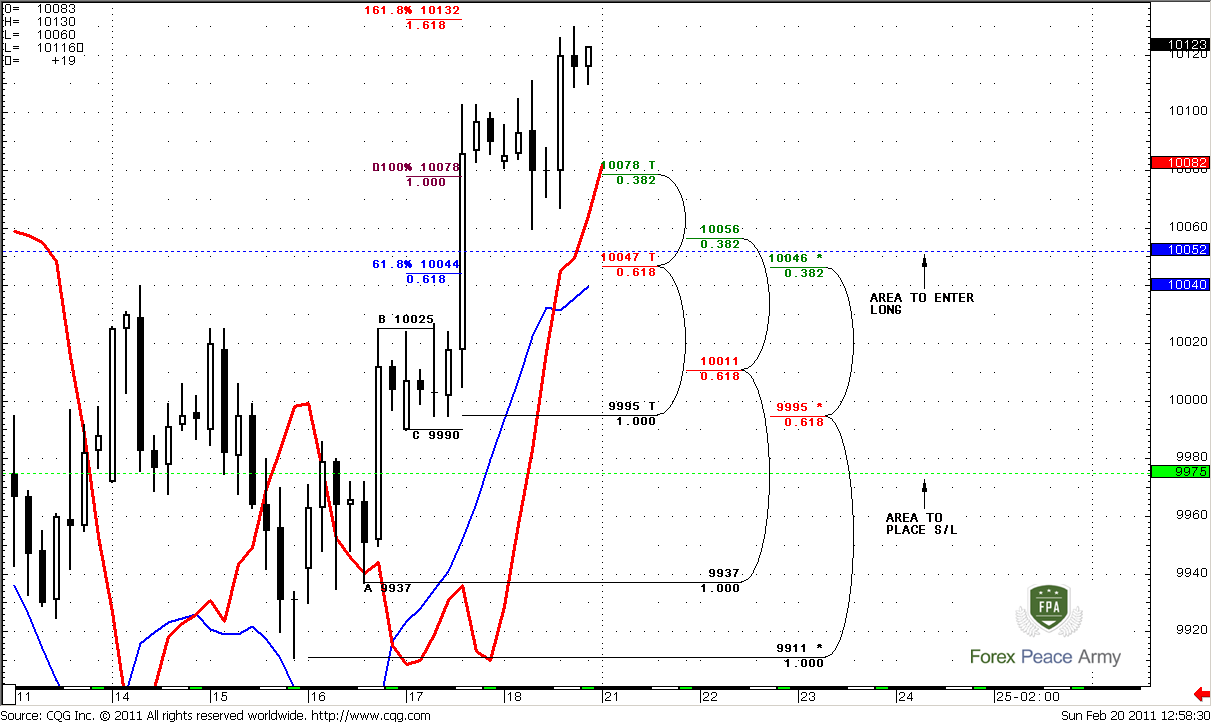
Now let’s shift at most recent price action at daily time frame. Here we have excellent Butterfly “Sell” pattern. It’s 1.27 target coincides with daily overbought and near target of AB-CD pattern. Also 1.30 is monthly pivot resistance 2 and upper border of the wedge. Also around 1.25-1.30 stand some weekly targets. It means that we should look for opportunity to enter on the Long side of the market. And I think that recent swing, from C-point could be used for that purpose, so let’s shift to 4-hour time frame.
#2
4-Hour
4-hour trend is bullish, market is near 4-hour 1.618 target. Market is neither oversold nor overbought on daily time frame, but stands at monthly pivot resistance at 1.0127 (I do not have it on this chart). So, I mean that market should not show very deep retracement – it could be to first fib support at 1.0078 or to 1.0046-1.0056 – 4-hour K-support, weekly pivot point, 50% support of a strong bar and, that is very important daily trend – it holds bullish till 1.050 area roughly. So, I think that this is very good area to enter Long. Just be sure that market does not fall like a stone to it. Stop could be placed below weekly pivot support at 0.9975, although I think that if market will break our area at 1.0050 and move below pivot – this already will be the signal to close longs and wait further development.
Conclusion:
Current price action on AUD/USD has a short-term bullish bias at all time frames. I will not even think about shorting this market until it hit 1.25-1.30 weekly targets in mid-term.
Daily time frame also is forming a lot of bullish patterns. So, I think that we can try to enter Long from 1.0050 area with stops below 0.9975, but simultaneously track market behavior around 1.0050 area – if it will move below pivot and hold there – then, possibly will be better to wait another chances.
Before entering long from 1.0050 – be sure that market does not fall like stone to this area.
The technical portion of Sive's analysis owes a great deal to Joe DiNapoli's methods, and uses a number of Joe's proprietary indicators. Please note that Sive's analysis is his own view of the market and is not endorsed by Joe DiNapoli or any related companies.
Take a note however, that this is a futures chart so the quotes are a bit different to the spot market. But I’m sure that you will be able to draw the same levels by yourself.
I suggest you to read this analysis very carefully, because it a bit advance and contains a lot of non-obvious conclusions.
Monthly
Monthly trend is strongly bullish; price action fully supports the trend direction. Although overall picture looks clear, there are some nuances here, that are not so obvious and allow as to make some assumptions about further market price action. First of all, as you can see market has reached 61.8 Fib expansion from ABC pattern. Simultaneously it has hit monthly overbought? Usually normal price action suggests that market should bounce to the downside. And what do we see after that - nothing. Market has not even a budge from there. It just stands near the overbought and continue to creep with it to the upside. As you can see – it didn’t show even 3/8 retracement from the latest reaction point (C=0.8049). This is a bullish sign.
Second, market holds above the previous highs at 0.9770 for third month in a row. This tells us than this is not a Wash&Rinse and true breakout has happened. Market also didn’t even touch highs at 0.9382, when it accelerated to the upside. All these things make me think that market is strong enough to continue move to the upside. Also, take a look – during the BC retracement – it was just 0.382 from AB swing. This is a sign of strength.
Just below the market some levels of support. First is a previous highs at 0.9770, second – 0.9373 Fib support and 0.9382 previous highs, and strong area of monthly Confluence resistance at 0.8699-0.8866. The level of monthly oversold, by the way, stands just below this area at 0.8476.
So, for confirmation of the strength of the market, I prefer do to see that market will hold above 0.9770. It gives me more confidence for bullish view. Currently we see it.
Weekly
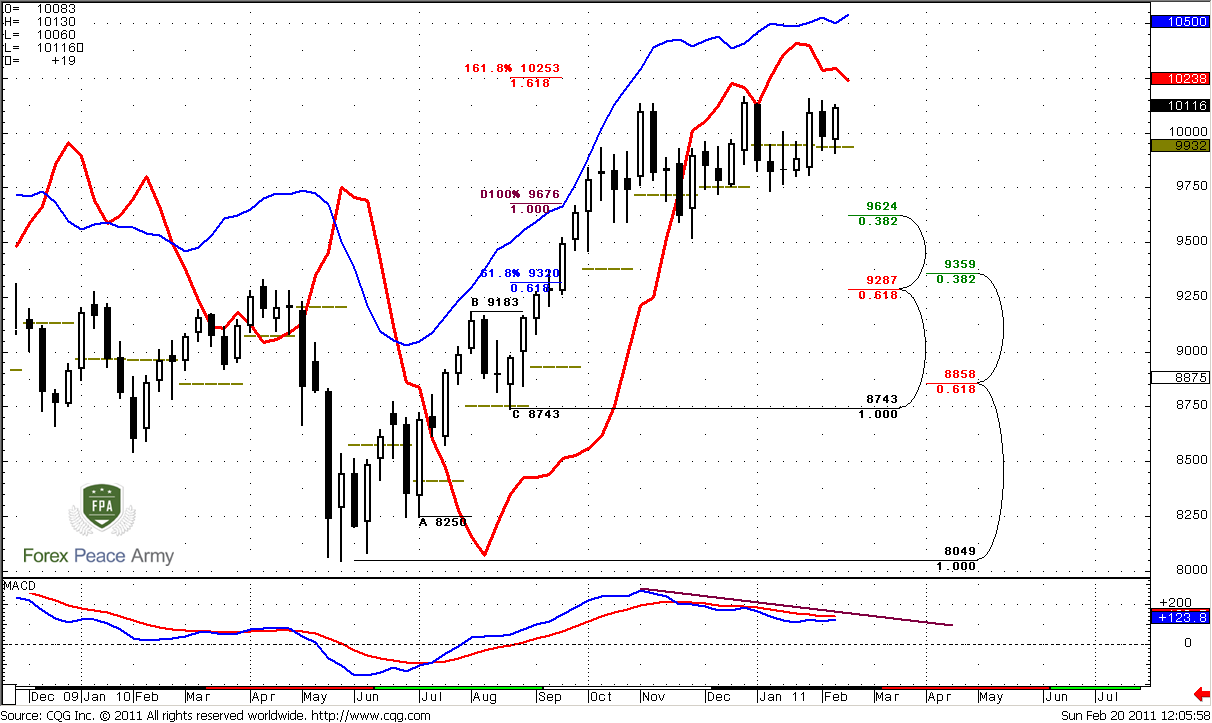
Weekly time frame contains the most important information amongst other time frames. On the #1 chart we see, that market has reached and exceeded 100% expansion target and turned to consolidation. MACD clearly shows bearish divergence – this is excellent, because public usually takes such signals but we should do not the same as public. This is an excellent and very bullish context on weekly time frame. And the major reason for this is a bullish dynamic pressure. See –trend turns bearish, but price action does not confirm that. It’s viewed even more clearly with MACDP indicator (red line) – see, how market just stands below it.
Second – 1.618 Fib target at 1.0253 and it stands just above the market. I will not even think about shorting this market until this target will not be hit by the market.
Third – market stands above February pivot at 0.9932 and during three previous week push monthly pivot resistance.
Also I’ve marked support levels just below the market…
#1
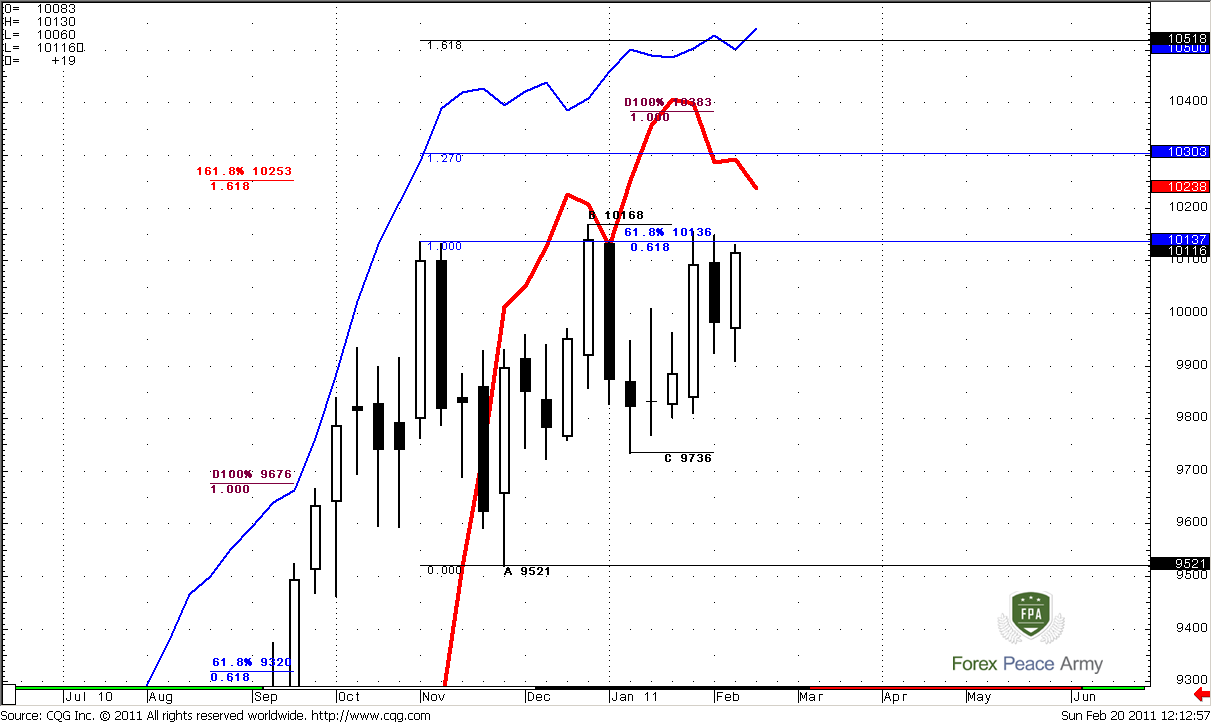
Now, let’s take a look at most recent price action on #2 chart. Besides, 1.618 target we have 100% target from most recent AB-CD pattern at 1.0383 and 1.27 Expansion target from recent retracement (it’s not a butterfly, because next top at B point is higher). 1.618 target stands at 1.0518 - very close to weekly overbought.
#2
Currently we can’t estimate – will it be long move up or just hitting of 1.618 target, but I think that it’s not a big deal. Reaching of 1.025 is already solid move, and it will be enough, even if market will not continue go up further.
Daily
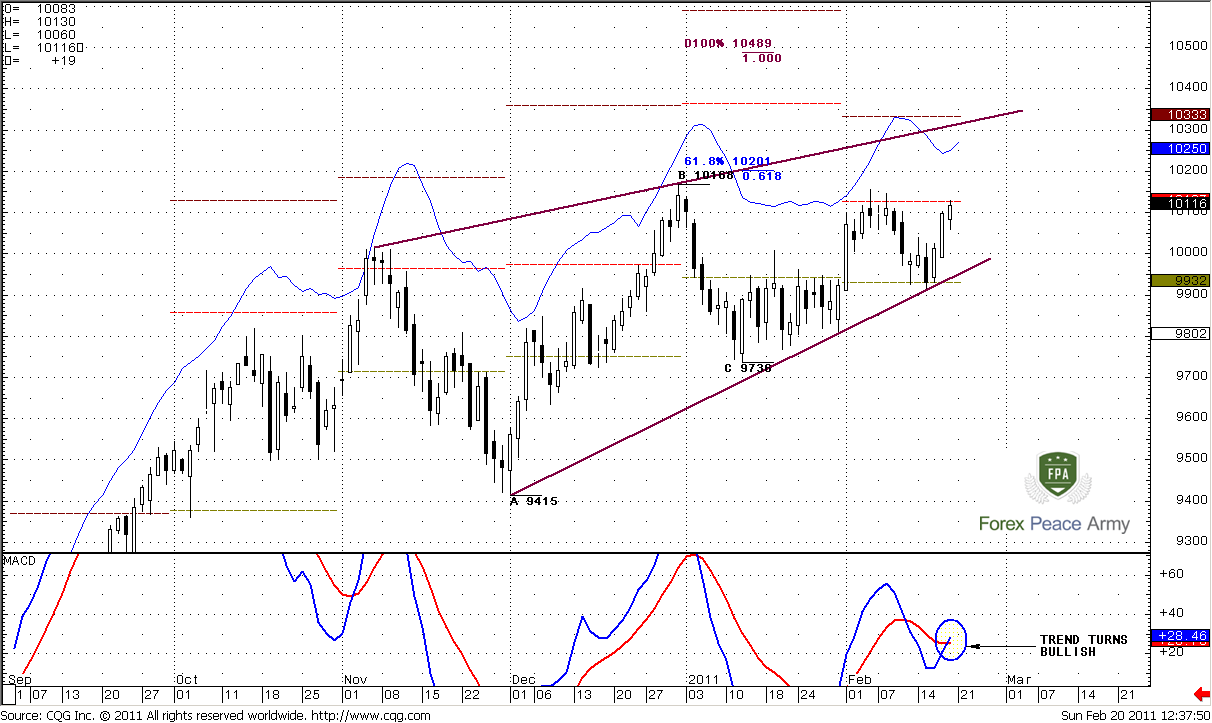
Daily chart is also overload with important information, so we will use two charts to analyze it. Let’s start from #1 and take a brief picture first. On Friday trend has turned bullish. Also take a look that market stands between pivot point and pivot resistance 1. This is moderately bullish sign. Although you can see that bearish wedge is forming on the market, it upper border is far enough from current market and take a note where it stands – around 1.030 area that also a monthly pivot resistance 2 and couple of weekly targets that we’ve just discussed.
Another important moment – take a look at ABC pattern that I’ve marked. 0.618 target is above the previous highs. It means that if market will continue move up (and I expect that this should happen) the stops that have been placed above these highs will be triggered and this will add fuel to further move up.
#1
Now let’s shift at most recent price action at daily time frame. Here we have excellent Butterfly “Sell” pattern. It’s 1.27 target coincides with daily overbought and near target of AB-CD pattern. Also 1.30 is monthly pivot resistance 2 and upper border of the wedge. Also around 1.25-1.30 stand some weekly targets. It means that we should look for opportunity to enter on the Long side of the market. And I think that recent swing, from C-point could be used for that purpose, so let’s shift to 4-hour time frame.
#2
4-Hour
4-hour trend is bullish, market is near 4-hour 1.618 target. Market is neither oversold nor overbought on daily time frame, but stands at monthly pivot resistance at 1.0127 (I do not have it on this chart). So, I mean that market should not show very deep retracement – it could be to first fib support at 1.0078 or to 1.0046-1.0056 – 4-hour K-support, weekly pivot point, 50% support of a strong bar and, that is very important daily trend – it holds bullish till 1.050 area roughly. So, I think that this is very good area to enter Long. Just be sure that market does not fall like a stone to it. Stop could be placed below weekly pivot support at 0.9975, although I think that if market will break our area at 1.0050 and move below pivot – this already will be the signal to close longs and wait further development.
Conclusion:
Current price action on AUD/USD has a short-term bullish bias at all time frames. I will not even think about shorting this market until it hit 1.25-1.30 weekly targets in mid-term.
Daily time frame also is forming a lot of bullish patterns. So, I think that we can try to enter Long from 1.0050 area with stops below 0.9975, but simultaneously track market behavior around 1.0050 area – if it will move below pivot and hold there – then, possibly will be better to wait another chances.
Before entering long from 1.0050 – be sure that market does not fall like stone to this area.
The technical portion of Sive's analysis owes a great deal to Joe DiNapoli's methods, and uses a number of Joe's proprietary indicators. Please note that Sive's analysis is his own view of the market and is not endorsed by Joe DiNapoli or any related companies.
")