FOREX PRO Weekly, February 21-25, 2011

Eur/usd

Hey Sive

What did happen Friday? The euro was going nise and slow down and in a moment it turn and was going allmost 100 pips up without any news comming out. I have only been in forex for 1 year. Is ther a reason for the euro is going 100 pips one way without news data?
Thanks for your analysis, they are a big help.

/Tony
A European Bank high-ranking official (I do not remember his name) said that the ICB may consider hiking interest rates earlier than expected to curb rising inflation.
 
Eur/usd

Hej MidnightRun.

Thanks for your reply to me. But still i think it was a big move on those news. Am i wrong or is eur/usd moving slowly down again today. :)

/Tony
 
AUD/USD Daily Update, Tue 22, February 2011

Hello everybody,

Yesterday was a splash of demand on USD and JPY due escalation of situation in Lybia and Bahrain and USD has risen to almost all other currencies. Also there was an EQ in NZ that leads to fall of kiwi.
Take a note, that 21 of Feb was also a holiday in US, so this was very thin market.

Anyway situation has changed drastically. While our weekly analysis may be will appear to be valid, short-term analysis (daily and intraday) has turned from top to bottom. I suppose that currently is a not suitable moment to open any Long positions on AUD, and here is why:

1. Take a look at daily time frame - market has shifted trend to bearish and moved below weekly pivot. 100% target from ABC pattern now is below previous low, monthly pivot and trend line. If it will be reached - we can see fast acceleration to the downside to stops, that has been placed below this area. Also reaching of this target will negate recent butterfly pattern.

2. On 4-hour chart trend is clearly bearish - market accelerates directly to 61.8% target. But now it stands at Fib support and 4-hour oversold. I think we can try to short market as a scalp trade, but after some bounce to the upside. There are couple of levels for that purpose - 1.0040 or 1.0080.

Current market is very tricky, so I think that it makes sense to reduce trading volume and shift stops to b/e once there will be a possiblity to do it.

Anyway, daily trend is bearish, 4-hour trend is bearish, so as price action - this is not the time to enter Long. IF you want to short the market - that's fine, but do not marry any possition - take your profit fast.
 

Attachments

  • AUD_D_22_02_11.PNG
    AUD_D_22_02_11.PNG
    47.1 KB · Views: 200
  • AUD_4H_22_02_11.PNG
    AUD_4H_22_02_11.PNG
    48.3 KB · Views: 200
  • AUD_4H1_22_02_11.PNG
    AUD_4H1_22_02_11.PNG
    47.8 KB · Views: 197
AUD/USD Daily Update, Wed 23, February 2011

Good morning,
Yesterday market has shown strong sell off and reached 0.9930 (based on futures quotes) - solid area of support that includes weekly pivot support 1, monthly pivot, and 5/8 Fib support.
Now we can see some pullback...
So, what do we have:

1. daily trend is bearish, market is pulling from strong support. Two Butterfly "Sell" is forming. the nearest target of one of them at 1.0233. In general, market stands in triangle.

2.On 4 hour chart trend is bearish still, nice thrust, market has reached 0.382 Fib resistance in current retracement - this is a context for 4-hour B&B scalp trade.

Well, currently I see only two possibility:
1. If you are bullish on AUD, the agressive possibility is to anticipate Butterfly and buy from 0.9960 with stop below the low 0.9910. The major advantage of this position is excellent risk/reward and possibility to place tight stop.

2. Scalp B&B "Sell" on 4-hour chart. Target - 0.618 support from whole retracement swing.

In general, I think now is best choice to focus on intraday trades, because on daily market is forming trianlge and does not show any solid direction.
 

Attachments

  • AUD_D_23_02_11.PNG
    AUD_D_23_02_11.PNG
    53.7 KB · Views: 142
  • AUD_4H_23_02_11.png
    AUD_4H_23_02_11.png
    52.9 KB · Views: 144
AUD/USD Daily Update, Thu 24, February 2011

Hello everybody,

So, guys, why is so low activity currently here with AUD analysis?
Do you not very interested in this pair?

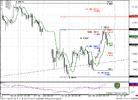
Meantime it has a lot of possibilities and good context for trading. Our yesterday expectations has been accomplished almost at 100%. B&B context has worked out nice and if you still have tried to anticipate butterfly and entered long, as we 've discussed - you should have now nice position. But I think that it's time to close it :)

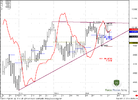
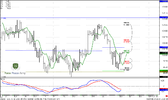
1. On daily time frame, although we can see that Butterfly "Sell" is forming, with the target at 1.0221. The previous nasty bearish bar makes me think, that this pattern will fail and we should expect the breakout of the trend line. Besides, daily trend is bearish. But not only because of that...

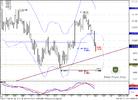
2. ... also because of Gartley "222" Sell pattern on 4 hour chart. With the nearest target at 0.9949 and 100% Fib expansion target at 0.9877 - that assumes breakout of the daily wedge.

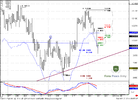
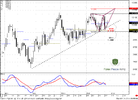
3. At the same time, if you still bullish, very short-term perspective assumes the possibility for horly B&B "Buy" trade. You can also use this context for longer posession with hope that market will accomplished hourly Butterfly "Sell' With target at 1.0096.

So, here is two possibilities for trading:
1. If you're bullish - buy with S/l below 0.9990, t/p at 1.0045. Or use this enter for anticipation of completing Butterfly pattern 1.0096. Move your s/l to b/e as soon as market will allow to do that - take your profit quick.

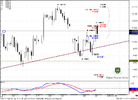
2. If you're bearish - you may trade "222" pattern.
Sell from 1.0045 area with s/l above the highs 1.0065. Target 0.9950 or even 0.9877. Also move your s/l to b/e as soon as possible.

I think that bearish context has more odds to success than bullish (except very fast hourly B&B "Buy" trade).
And DO NOT MARRY ANY POSITION CURRENTLY.
 

Attachments

  • AUD_D_24_02_11.PNG
    AUD_D_24_02_11.PNG
    45.5 KB · Views: 100
  • AUD_4H_24_02_11.PNG
    AUD_4H_24_02_11.PNG
    42 KB · Views: 102
  • AUD_1H_24_02_11.PNG
    AUD_1H_24_02_11.PNG
    50.2 KB · Views: 102
Indecision

Hi Sive,

Your analysis is perfect. Thanks !

To answer your question why there is so little response: For me there are to many options which made me indecisive.
- Butterfly buy developping
- Butterfly sell developping
- Gartley developping
- Break from triangle appoaching (which way ?)
- No clear direction

So I sat at the sideline.

BackSpace
 
gartley 222

Sive, I wanted to ask you about the Gartley 222 setup. somewhere I read that a requirement for this patern is for B ponit (counting XABCD) to be at .786 retracement of XA leg. In your explanation I understood that the AB=CD is more important to you. Do I understand you correctly?

RAsto
 
Sive, I wanted to ask you about the Gartley 222 setup. somewhere I read that a requirement for this patern is for B ponit (counting XABCD) to be at .786 retracement of XA leg. In your explanation I understood that the AB=CD is more important to you. Do I understand you correctly?

RAsto

Hi Rasto,
I think that may be there was some mistake (where you'd read it).
In fact, "222" is a continuation pattern and consists of initial swing XA and AB-CD retracement. The major condition is that D point should be inside XA swing. But the depth of AB-CD inside the XA could be any - 0.382 -1. If there will be shallow retracement - then continuation move could be longer. otherwise - if retracement is deep, 0.88 for instance, then, continuation may be not so solid.
At the same time AB-CD pattern itself is also important - if it's very harmonic - the more probability that it market will reverse in D point. So, that has happened.
 
Back
Top