Sive Morten
Special Consultant to the FPA
- Messages
- 18,624
Fundamentals
This week the financial world was like a boiling pot - a lot of data, a lot of political events. Although Fed minutes this week have not brought any sensation, but put more foundation on longer term hawkish Fed policy and once again assured markets that if Fed tells something - it shouldn't be ignored. In last two weeks we've warned that market will regret about it and this is wrong idea to ignore Fed comments as it was done after recent Fed meeting. What do we see now? Yes, definitely it was a mistake to run against the Fed... Besides recent data frees Fed's hands in terms of strict policy for even longer. Swap traders already consider 3 more rate hike, 0.5% rate change appears on horizon again, while terminal rate now grows to ~5.45%.
Market overview
U.S. business activity unexpectedly rebounded in February, reaching its highest level in eight months, according to a survey on Tuesday, which also showed inflation subsiding. S&P Global said its flash U.S. Composite PMI Output Index, which tracks the manufacturing and services sectors, increased to 50.2 this month from a final reading of 46.8 in January. The rebound in business activity fits in with recent robust data on retail sales, the labor market and manufacturing production, which have suggested solid momentum in the economy at the start of the year. (we've talked about this, it might be the victim of the same "seasonal adjustments" in January...)
It seems that markets still do not understand what is going on. Just take a look at this comment -
Global equities and U.S. Treasury yields were lower on Wednesday as recent strong economic data had investors worried about aggressive interest rate hikes even though minutes of the Federal Reserve's last meeting showed officials at the Jan. 31 to Feb. 1 meeting favored moderation. A solid majority of Fed policy makers at the meeting agreed it was appropriate for the central bank to raise rates by 25 basis points, even as they reiterated that the inflation outlook would keep driving further rate actions, the minutes showed. Only a few officials supported a rate hike of 50 basis points.
But since then, strong economic data demonstrated the resilience of the U.S. economy and heightened worries of a longer rate-tightening cycle.
St. Louis Fed President James Bullard, a non-voting member of the Fed's rate-setting committee this year, on Wednesday reiterated his view that a Fed policy rate in the range of 5.25% to 5.5% would be adequate to bring inflation toward the central bank's 2% goal.
Bond yields rose following the release of the minutes and the U.S. dollar also advanced against a basket of currencies. A modest rally in U.S. stocks fizzled out. Traders of futures tied to the Fed policy rate added to bets on at least three more quarter-percentage-point rate hikes at upcoming meetings, with contract pricing pointing to a top federal funds rate range of 5.25%-5.50%.
JPMorgan Chase & Co Chief Executive Jamie Dimon expects U.S. interest rates could hit 6%, he said in an interview with CNBC on Thursday. The Federal Reserve quickly caught up to out-of-control inflation and would probably pause interest rates at a little over 5%, but they may need to go higher, Dimon told CNBC.
Data since the last meeting have shown an economy continuing to grow and adding jobs at an unexpectedly rapid pace, while making less progress back towards the Fed's 2% inflation target. What is not been published in Fed's protocol - the new Fed model that we've mentioned in Telegram. This is the reason why Fed is so concerned with high employment. Rising wages push inflation higher. According to new Fed model companies will not include rising wages in the cost of goods sold. It leads to recession, because companies will bear these costs but not compensated in higher price levels. Since job market now stands almost at full capacity - the value of these costs now is astronomic, which means that recession will be stronger as more loss companies will have to care. Thus, Fed wants to chill job market.

Fathom consulting also suggests possible two quarters of decline but in general US should avoid recession by their opinion -
Although we do know that US stands in recession (wrong world) since the late 2021.
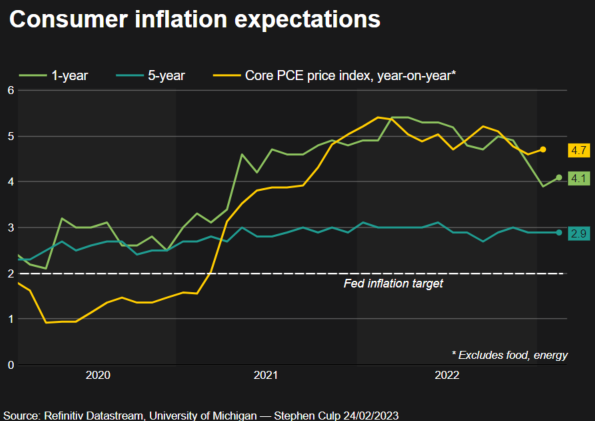
Expectations that the U.S. Federal Reserve will need to push interest rates higher and keep them elevated longer than previously projected rose on Friday after data showed a key inflation gauge accelerated last month. The Commerce Department reported that the Personal Consumption Expenditures price index, the metric by which the Fed measures its 2% inflation target, rose 5.4% last month from a year earlier, a pickup from an upwardly revised 5.3% annual pace in December.
Underlying "core" inflation climbed a faster-than-expected 4.7% from a year earlier, compared to December's upwardly revised 4.6% pace.
Implied yields on federal funds futures contracts rose on Friday as traders firmed up expectations for at least three more rate hikes through June, a path that would push the U.S. central bank's benchmark overnight interest rate to the 5.25%-5.50% range, from the current 4.50%-4.75% range. Pricing also now puts about a 40% chance of an even higher stopping point for that rate, up from about 30% prior to the release of the PCE data.
And traders largely erased what had been consistent bets on Fed rate cuts toward the end of the year, pricing in a year-end Fed policy rate of 5.26%.
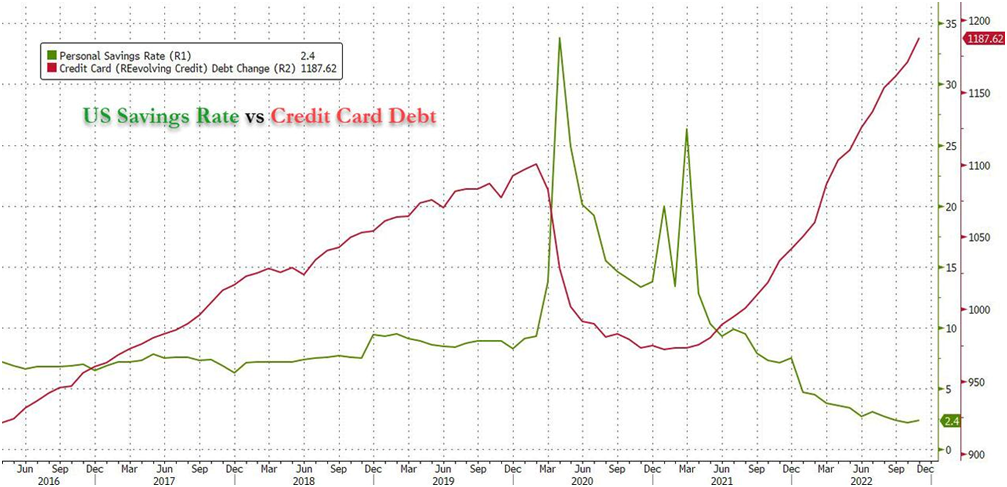
Revisions to data from prior months in Friday's Commerce Department report showed inflation did not cool in November and December as much as had been thought, and spending in January rose more than expected even as the savings rate increased. All told, the economic readings may throw doubt on Fed Chair Jerome Powell's assessment this month that the "disinflationary process" had begun, a view that seemed to justify the central bank's decision at its Jan. 31-Feb. 1 policy meeting to deliver a quarter-percentage-point rate increase after a string of bigger hikes in 2022.
Goldman said he expects the next round of Fed projections, to be published in March, to signal rates will rise father and stay there longer than previously thought.
U.S. consumer spending increased by the most in nearly two years in January amid a surge in wage gains, while inflation accelerated, adding to financial market fears that the Federal Reserve could continue raising interest rates into summer. Consumer spending, which accounts for more than two-thirds of U.S. economic activity, shot up 1.8% last month. That was the largest increase since March 2021. Data for December was revised higher to show spending dipping 0.1% instead of falling 0.2% as previously reported.
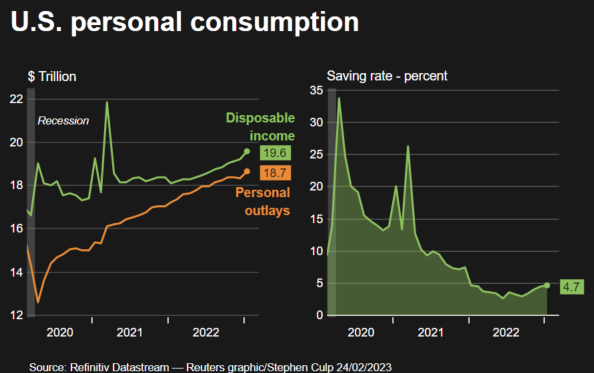
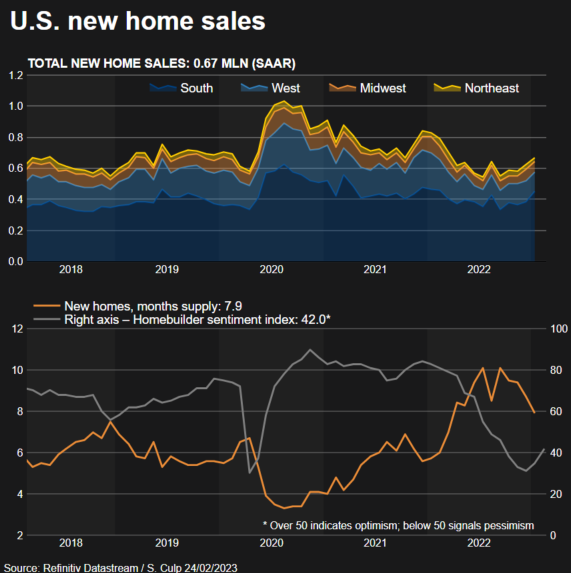
The overall surge in spending came as wages and salaries jumped 0.9%. An 8.7% cost of living adjustment, the biggest increase since 1981, for more than 65 million Social Security beneficiaries offset a drop in government social benefits. The data together with another Commerce Department report showing new home sales vaulting 7.2% in January prompted Goldman Sachs to raise its first-quarter gross domestic product tracking estimate by 0.4 percentage point to a 1.8% annualized rate. The economy grew at a 2.7% pace in the fourth quarter.
Excluding the volatile food and energy components, the PCE price index increased 0.6%. That was the biggest gain since August 2022 and followed a 0.4% rise in December. The so-called core PCE price index increased 4.7% on a year-on-year basis in January after advancing 4.6% in December.
The Fed tracks the PCE price indexes for monetary policy. According economists' calculations, core services prices excluding housing, which are being closely watched by policymakers, increased 0.6% after climbing 0.4% in December. The latest high readings left economists to expect that the road to disinflation would be slow and bumpy, with a survey from the University of Michigan on Friday showing consumers' near-term inflation expectations increased in February.
The average contract rate on a 30-year fixed-rate mortgage jumped by 23 basis points to 6.62% for the week ended Feb. 17 following stronger-than-expected retail sales and labor market data as well as still robust monthly inflation readings, which compelled investors to up their bets that the U.S. central bank will have to keep raising its policy rate through the summer.
Fed funds futures traders are now pricing the Fed funds rate to hit a peak of 5.395% in September, and expect it to stay above 5% for the year.
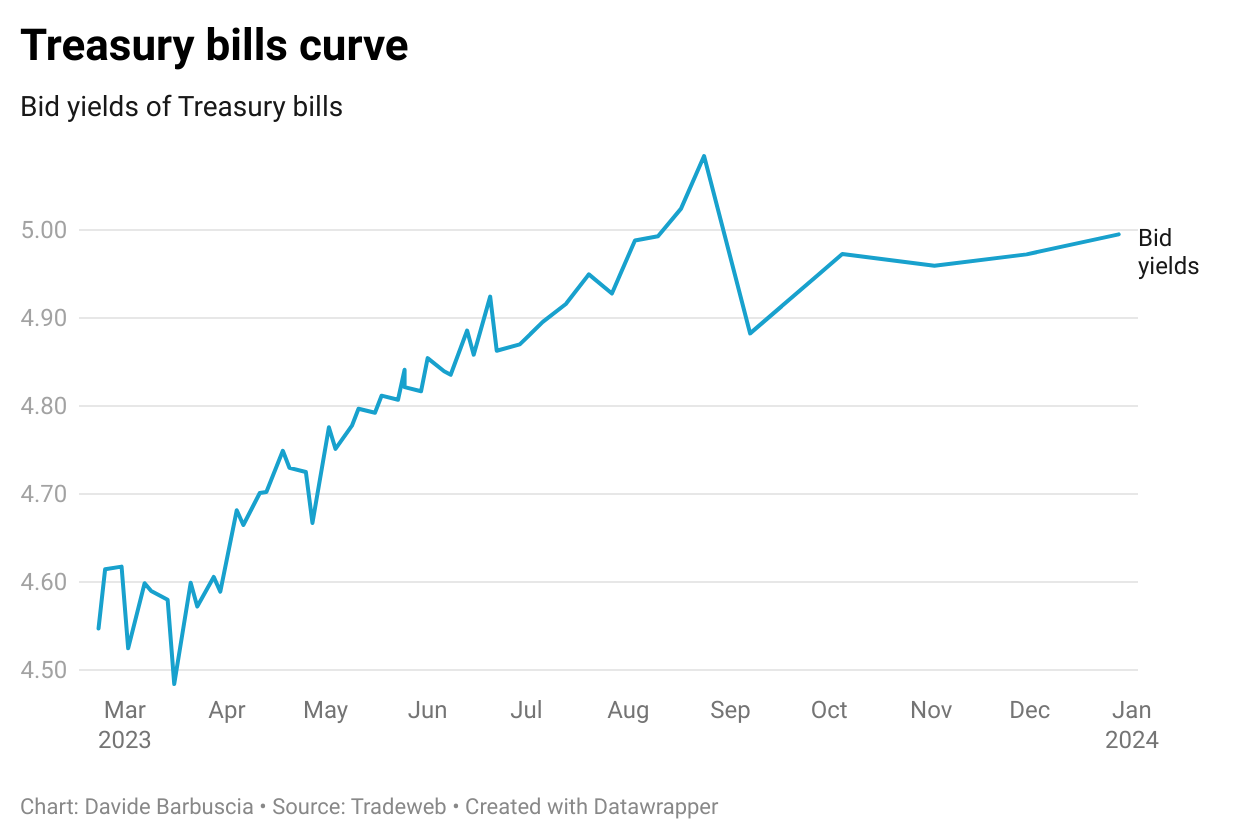
Some bond managers have started to adjust short-term exposure to Treasuries to avoid losses during the period when the government may exhaust its ability to pay its bills. Making preparations for a potential default is tricky, partly due to uncertainty over how much revenue the Treasury will collect from Americans filing income taxes in April. The Treasury bills yield curve indicates investors are demanding higher returns to hold debt due in August, signaling that it is perceived to be riskier than other maturities.
Next week to watch
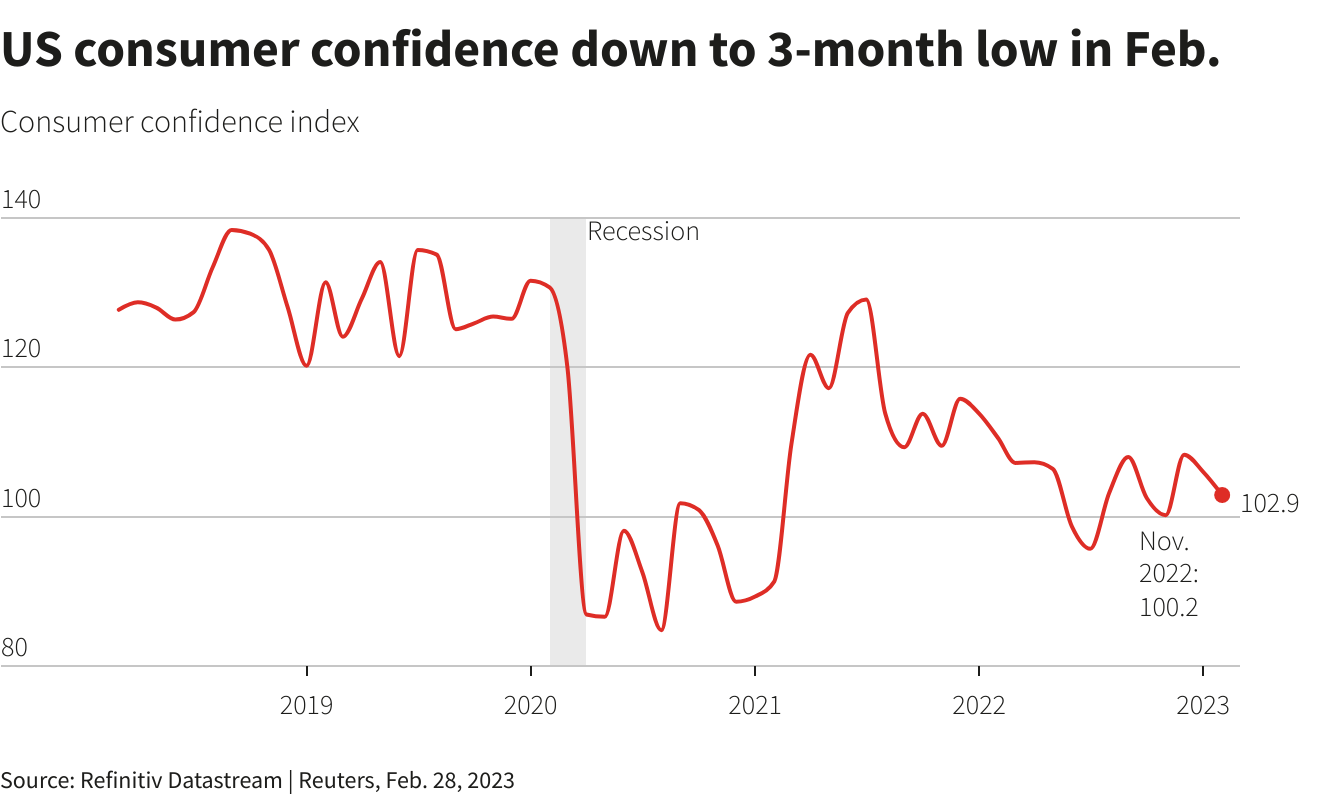
Reports on U.S. durable goods orders, home prices as well as manufacturing and consumer confidence threaten to cement expectations of more Fed rate hikes. Tuesday's consumer confidence data may be of particular interest, offering a glimpse into households' views on economic prospects and inflation expectations. Economists polled by Reuters expect a median reading of 109.5 on the index, which unexpectedly fell in January.
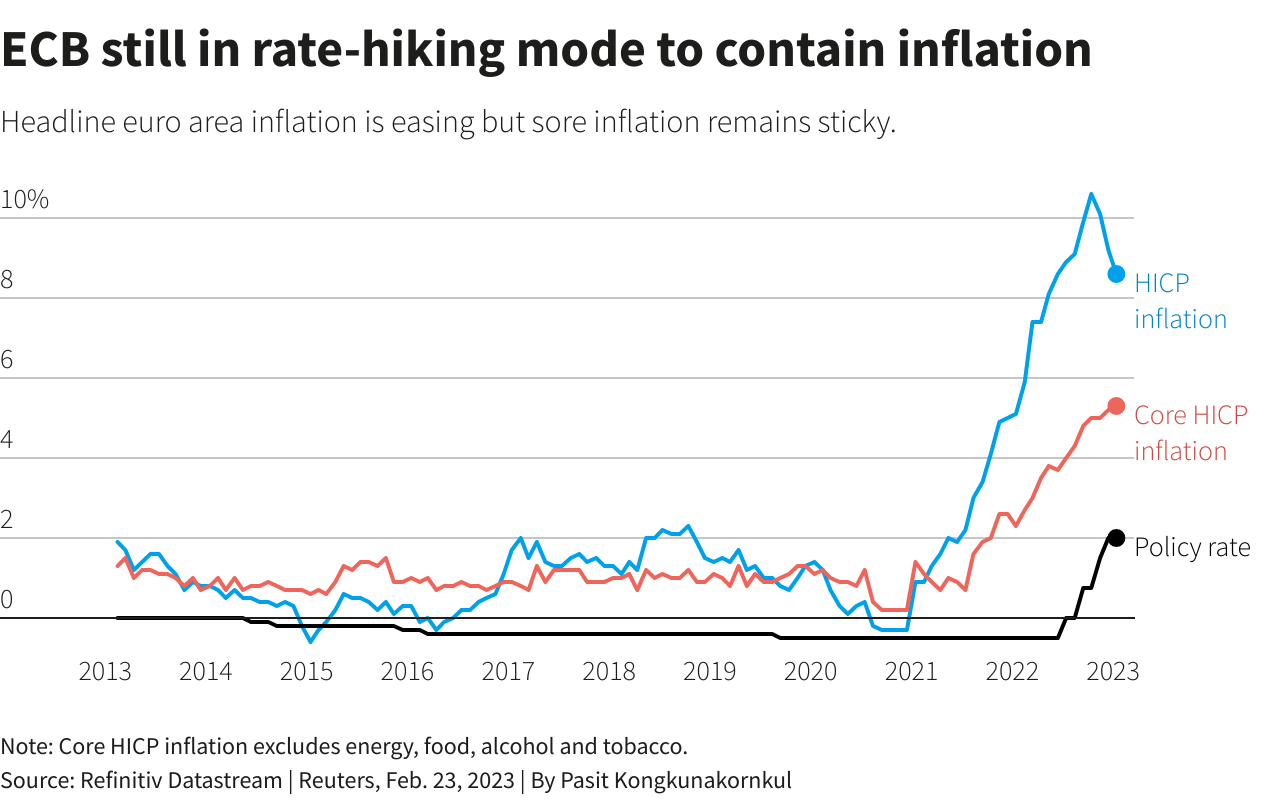
It's inflation week in the euro area. Preliminary February data from Germany, France, Spain and Portugal are due on Monday and Tuesday, followed by the bloc-wide flash number on Thursday. Price pressures are abating: headline euro area inflation eased to 8.6% in January from 9.2% a month earlier. Still, Thursday's numbers are unlikely to placate European Central Bank hawks pushing for aggressive rate hikes to continue.
Focus will likely stay on core inflation, stripping out volatile food and energy prices. It's proving stubborn and could still rise from January's 5.3%. Markets have got the message and renewed bets on the ECB 2.5% depo rate moving higher. Deutsche Bank just raised its forecast for the peak in ECB rates to 3.75% from 3.25%.
Goldman Sachs said it was expecting the European Central Bank to raise interest rates thrice this year, taking the terminal rate to 3.5% from 3.25% estimated earlier.Markets currently see ECB rates peaking at around 3.7% by the end of summer.
Deutsche Bank has lifted its forecast for where the European Central Bank's key rate will rise to in this tightening cycle to 3.75% from 3.25%, the German bank said in a note on Wednesday. Deutsche economists now expect the ECB to raise interest rates by 50 basis points (bps) at its March and May meetings, followed by a final hike of 25bp in June. They had previously expected a 50 bps hike in March and a final 25 bps rise in May.
This week the financial world was like a boiling pot - a lot of data, a lot of political events. Although Fed minutes this week have not brought any sensation, but put more foundation on longer term hawkish Fed policy and once again assured markets that if Fed tells something - it shouldn't be ignored. In last two weeks we've warned that market will regret about it and this is wrong idea to ignore Fed comments as it was done after recent Fed meeting. What do we see now? Yes, definitely it was a mistake to run against the Fed... Besides recent data frees Fed's hands in terms of strict policy for even longer. Swap traders already consider 3 more rate hike, 0.5% rate change appears on horizon again, while terminal rate now grows to ~5.45%.
Market overview
U.S. business activity unexpectedly rebounded in February, reaching its highest level in eight months, according to a survey on Tuesday, which also showed inflation subsiding. S&P Global said its flash U.S. Composite PMI Output Index, which tracks the manufacturing and services sectors, increased to 50.2 this month from a final reading of 46.8 in January. The rebound in business activity fits in with recent robust data on retail sales, the labor market and manufacturing production, which have suggested solid momentum in the economy at the start of the year. (we've talked about this, it might be the victim of the same "seasonal adjustments" in January...)
"Today’s PMI releases show a large portion of the U.S. economy is still proving more resilient than expected, particularly the services sector, but the housing market remains challenged as evidenced by the surprise decline in existing home sales," said Erik Nelson, macro strategist at Wells Fargo Securities in London. Nelson noted a dichotomy between the leading indicators from the U.S. economy, showing a recession still looming and lagging indicators pointing to still-solid demand. This will likely keep the Fed cautious and raises the bar for more aggressive rate hikes, according to Nelson.
It seems that markets still do not understand what is going on. Just take a look at this comment -
"We're seeing consumers the world over that are less sensitive to interest rates than anticipated," said Adam Button, chief currency analysts at ForexLive in Toronto. "There's potentially a dream scenario unfolding where inflation comes down gently, and the consumer remains strong (!!!). It's almost foolish outlining a scenario like that, but so far, you couldn't have scripted a better start to 2023."
Global equities and U.S. Treasury yields were lower on Wednesday as recent strong economic data had investors worried about aggressive interest rate hikes even though minutes of the Federal Reserve's last meeting showed officials at the Jan. 31 to Feb. 1 meeting favored moderation. A solid majority of Fed policy makers at the meeting agreed it was appropriate for the central bank to raise rates by 25 basis points, even as they reiterated that the inflation outlook would keep driving further rate actions, the minutes showed. Only a few officials supported a rate hike of 50 basis points.
But since then, strong economic data demonstrated the resilience of the U.S. economy and heightened worries of a longer rate-tightening cycle.
"The minutes are a little bit outdated because of the data that came out after the Fed discussion and it's not as important as people think," said Moustapha Mounah, portfolio manager at James Investments in Dayton, Ohio. The bond market has already priced in more rate hikes but the stock market hasn't re-priced to reflect all of the movement in the rates," Mounah added.
St. Louis Fed President James Bullard, a non-voting member of the Fed's rate-setting committee this year, on Wednesday reiterated his view that a Fed policy rate in the range of 5.25% to 5.5% would be adequate to bring inflation toward the central bank's 2% goal.
The minutes' reference to inflation risks as a "key" to policy means recent data - showing less progress than hoped for - could mean a higher projected stopping point for the federal funds rate when policymakers issue new projections at the end of the March 21-22 meeting, said Omair Sharif, president of Inflation Insights.
Recent inflation data and upward revisions to earlier figures means the "upside risks to inflation" cited by policymakers in the minutes "are clearly much higher today than they were when the (Federal Open Market) Committee last met," Sharif said, referring to the central bank's policy-setting committee. "The March dots will move higher," with the median projected year-end policy rate perhaps pushed up to as much as 5.6%, compared with the median 5.1% "dot plot" projection in December.
Bond yields rose following the release of the minutes and the U.S. dollar also advanced against a basket of currencies. A modest rally in U.S. stocks fizzled out. Traders of futures tied to the Fed policy rate added to bets on at least three more quarter-percentage-point rate hikes at upcoming meetings, with contract pricing pointing to a top federal funds rate range of 5.25%-5.50%.
JPMorgan Chase & Co Chief Executive Jamie Dimon expects U.S. interest rates could hit 6%, he said in an interview with CNBC on Thursday. The Federal Reserve quickly caught up to out-of-control inflation and would probably pause interest rates at a little over 5%, but they may need to go higher, Dimon told CNBC.
“I suspect (interest rates) may have to go a little bit higher than 5 we're talking about. It could hit 6,” he added.
Data since the last meeting have shown an economy continuing to grow and adding jobs at an unexpectedly rapid pace, while making less progress back towards the Fed's 2% inflation target. What is not been published in Fed's protocol - the new Fed model that we've mentioned in Telegram. This is the reason why Fed is so concerned with high employment. Rising wages push inflation higher. According to new Fed model companies will not include rising wages in the cost of goods sold. It leads to recession, because companies will bear these costs but not compensated in higher price levels. Since job market now stands almost at full capacity - the value of these costs now is astronomic, which means that recession will be stronger as more loss companies will have to care. Thus, Fed wants to chill job market.
- The model has been revised to reduce the potential output gap. The production of goods and services will go into negative territory in the 3rd quarter of 2023.
- The model assumes that core inflation (PCE - personal consumption) is returning to 2% even though wages (employment cost) are growing at a double rate compared to the pre-pandemic trend. It sounds like miracle. We have big doubts about this point.
- The Fed uses the Keynesian Phillips Curve, which assumes wage rigidity. As a result: people will still ask for more money, despite the actual increase in wages.
- How will inflation return to 2% if the wage spiral continues? According to the model, due to a faster decline in price growth in all other areas.
- How can this happen? It's simple - business (in theory) will not pass costs [labor costs] to final products/services, which implies a significant drop in profits = recession.
Fathom consulting also suggests possible two quarters of decline but in general US should avoid recession by their opinion -
"So has the US avoided recession? If we combine the data on payrolls, equity markets, economic sentiment and GDP growth in a simple Vector Auto-Regression (VAR), which is usually a good way of producing a short-term forecast, we find that the US is likely to experience a couple of quarters of contraction during the course of 2023, and the annual growth rate will drop to zero before recovering. On balance, Fathom believes that the US will just about avoid recession."
Although we do know that US stands in recession (wrong world) since the late 2021.
Expectations that the U.S. Federal Reserve will need to push interest rates higher and keep them elevated longer than previously projected rose on Friday after data showed a key inflation gauge accelerated last month. The Commerce Department reported that the Personal Consumption Expenditures price index, the metric by which the Fed measures its 2% inflation target, rose 5.4% last month from a year earlier, a pickup from an upwardly revised 5.3% annual pace in December.
Underlying "core" inflation climbed a faster-than-expected 4.7% from a year earlier, compared to December's upwardly revised 4.6% pace.
The report "is another indication that the impulse of inflation and price pressures is still with us," Cleveland Fed President Loretta Mester told Reuters on the sidelines of a conference in New York. "It's going to take more effort on the part of the Fed to get inflation on that sustainable downward path to 2%."
Implied yields on federal funds futures contracts rose on Friday as traders firmed up expectations for at least three more rate hikes through June, a path that would push the U.S. central bank's benchmark overnight interest rate to the 5.25%-5.50% range, from the current 4.50%-4.75% range. Pricing also now puts about a 40% chance of an even higher stopping point for that rate, up from about 30% prior to the release of the PCE data.
And traders largely erased what had been consistent bets on Fed rate cuts toward the end of the year, pricing in a year-end Fed policy rate of 5.26%.
"There are inflationary pressures in the economy, the level of inflation is still too high, and it's going to take more on the monetary policy side to get inflation down, Mester said.
Revisions to data from prior months in Friday's Commerce Department report showed inflation did not cool in November and December as much as had been thought, and spending in January rose more than expected even as the savings rate increased. All told, the economic readings may throw doubt on Fed Chair Jerome Powell's assessment this month that the "disinflationary process" had begun, a view that seemed to justify the central bank's decision at its Jan. 31-Feb. 1 policy meeting to deliver a quarter-percentage-point rate increase after a string of bigger hikes in 2022.
"If the Fed had this data at the last meeting, they probably would've raised by 50 (basis points) and the tone from the press conference would've been a lot different," said Gene Goldman, chief investment officer at Cetera Investment Management.
Goldman said he expects the next round of Fed projections, to be published in March, to signal rates will rise father and stay there longer than previously thought.
"It looks like the Fed will have to be more aggressive," said Yelena Shulyatyeva, an economist at BNP Paribas. "They will probably overdo it, in our view, and that will eventually lead to a recession; the question is more like when, not whether, it will be a recession."
U.S. consumer spending increased by the most in nearly two years in January amid a surge in wage gains, while inflation accelerated, adding to financial market fears that the Federal Reserve could continue raising interest rates into summer. Consumer spending, which accounts for more than two-thirds of U.S. economic activity, shot up 1.8% last month. That was the largest increase since March 2021. Data for December was revised higher to show spending dipping 0.1% instead of falling 0.2% as previously reported.
The overall surge in spending came as wages and salaries jumped 0.9%. An 8.7% cost of living adjustment, the biggest increase since 1981, for more than 65 million Social Security beneficiaries offset a drop in government social benefits. The data together with another Commerce Department report showing new home sales vaulting 7.2% in January prompted Goldman Sachs to raise its first-quarter gross domestic product tracking estimate by 0.4 percentage point to a 1.8% annualized rate. The economy grew at a 2.7% pace in the fourth quarter.
Excluding the volatile food and energy components, the PCE price index increased 0.6%. That was the biggest gain since August 2022 and followed a 0.4% rise in December. The so-called core PCE price index increased 4.7% on a year-on-year basis in January after advancing 4.6% in December.
The Fed tracks the PCE price indexes for monetary policy. According economists' calculations, core services prices excluding housing, which are being closely watched by policymakers, increased 0.6% after climbing 0.4% in December. The latest high readings left economists to expect that the road to disinflation would be slow and bumpy, with a survey from the University of Michigan on Friday showing consumers' near-term inflation expectations increased in February.
The average contract rate on a 30-year fixed-rate mortgage jumped by 23 basis points to 6.62% for the week ended Feb. 17 following stronger-than-expected retail sales and labor market data as well as still robust monthly inflation readings, which compelled investors to up their bets that the U.S. central bank will have to keep raising its policy rate through the summer.
"The fact we've got another data item that shows the economy is not slowing enough to hopefully give the Fed confidence that they're in front of the inflation problem - that's why the market is down," said Robert Stimpson, portfolio manager at Oak Associates Funds in Akron, Ohio. "The risk to the market is that it was premature in its anticipation of a Fed pivot. The Fed is going to continue raising interest rates higher than people think and for longer than people think," Stimpson added.
"Strong U.S. data have completely turned the market in February. Good news has been bad news, with rates and equities selling off and the U.S. dollar up. The U.S. economy seems to be re-accelerating, forcing the Fed to hike more, in a market that was hoping for early Fed pivot," said Athanasios Vamvakidis, global head G10 FX strategy at Bank of America in London. Unemployment remains historically low in every single G10 economy and has yet to increase in any of them during monetary policy tightening so far," Vamvakidis added. "The market's reality check will be complete when both good news and bad news are bad news, which should be the case when inflation is high and sticky, and the Fed committed to bringing it down."
Fed funds futures traders are now pricing the Fed funds rate to hit a peak of 5.395% in September, and expect it to stay above 5% for the year.
Some bond managers have started to adjust short-term exposure to Treasuries to avoid losses during the period when the government may exhaust its ability to pay its bills. Making preparations for a potential default is tricky, partly due to uncertainty over how much revenue the Treasury will collect from Americans filing income taxes in April. The Treasury bills yield curve indicates investors are demanding higher returns to hold debt due in August, signaling that it is perceived to be riskier than other maturities.
"The probability of a default is very low, but I'm okay telling my clients to avoid T bills with a six-month maturity ... That is probably the most concrete way in which we're approaching this," said Ed Al-Hussainy, senior interest rate strategist at Columbia Threadneedle. Al-Hussainy may also buy Japanese yen, because a U.S. default would likely challenge the safe-haven status of the U.S. dollar and spur investors to seek protection in other currencies, he said.
Next week to watch
Reports on U.S. durable goods orders, home prices as well as manufacturing and consumer confidence threaten to cement expectations of more Fed rate hikes. Tuesday's consumer confidence data may be of particular interest, offering a glimpse into households' views on economic prospects and inflation expectations. Economists polled by Reuters expect a median reading of 109.5 on the index, which unexpectedly fell in January.
It's inflation week in the euro area. Preliminary February data from Germany, France, Spain and Portugal are due on Monday and Tuesday, followed by the bloc-wide flash number on Thursday. Price pressures are abating: headline euro area inflation eased to 8.6% in January from 9.2% a month earlier. Still, Thursday's numbers are unlikely to placate European Central Bank hawks pushing for aggressive rate hikes to continue.
Focus will likely stay on core inflation, stripping out volatile food and energy prices. It's proving stubborn and could still rise from January's 5.3%. Markets have got the message and renewed bets on the ECB 2.5% depo rate moving higher. Deutsche Bank just raised its forecast for the peak in ECB rates to 3.75% from 3.25%.
Goldman Sachs said it was expecting the European Central Bank to raise interest rates thrice this year, taking the terminal rate to 3.5% from 3.25% estimated earlier.Markets currently see ECB rates peaking at around 3.7% by the end of summer.
Deutsche Bank has lifted its forecast for where the European Central Bank's key rate will rise to in this tightening cycle to 3.75% from 3.25%, the German bank said in a note on Wednesday. Deutsche economists now expect the ECB to raise interest rates by 50 basis points (bps) at its March and May meetings, followed by a final hike of 25bp in June. They had previously expected a 50 bps hike in March and a final 25 bps rise in May.
")