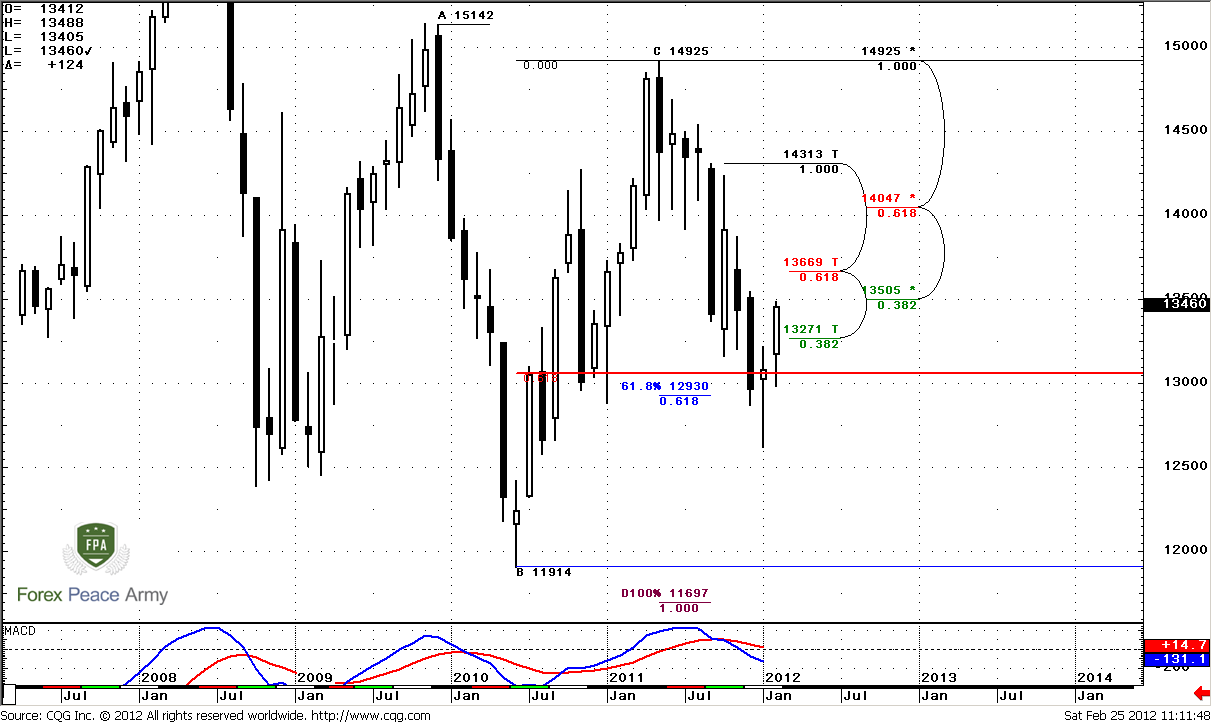
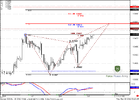
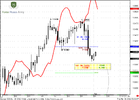
FOREX PRO Weekly February 27- March 02, 2012

Joshnix

Corporal
Messages
114
Sive,
I have a question on MACDP and time. In my experience with the charts, something I have observed is the time relationship with the plotting of MACDP alluding to the amount of time until a trend change. I chose to post this as a new thread because I expect you will be putting up weekly analysis tomorrow and might miss it. If you look at the plot on the weekly chart the MACDP line has not yet begun an upturn, so it leaves me to ask if we might expect more retracement or sideways action while the price of a trend change catches up? It currently seems that the weekly will remain in an uptrend until the next cross of the MACDP.

I post this for some of the newer recruits to watch so they aren't getting short before it's time, if they are longer TF traders, ultimately to be taken for a ride by the continuation of the trend.
 

Attachments

  • 2012-02-24-TOS_CHARTS.jpg
    2012-02-24-TOS_CHARTS.jpg
    184.8 KB · Views: 172
Monthly
Here we see further acceleration to the upside after hitting of 0.618 support and 0.618 Fib extension target. Usually after reaching of just 0.618 AB=CD extension market shows not deep retracement. While may be 1.3271 seems too shallow – reaching of Monthly K-resistance 1.3505-1.3669 seems logical. I see some advantage of combination of so kind – achievement of 0.618 target and K-resistance above. If long-term sentiment is still bearish, market should not break this area. If market breaks K-resistance after just reaching of 0.618 AB-CD extension – this is more bullish sign.
Still trend is bearish. In medium term perspective we have to watch for two contrary scenarios – either downward reversal patterns on weekly time frame inside of 1.35-1.3650 area or breakout of K-resistance area. These scenarios lead to absolutely different directions of trades. That is what about long-term trading.
In shorter term trading we do not care much about monthly trend direction itself, but mostly by Fib levels.

So, as a result on monthly chart we might say that market is underway to deeper upward retracement. Still it seems logical and natural, until it will break 1.35-1.3650 K-resistance area. If this will happen - it will be bullish sign.
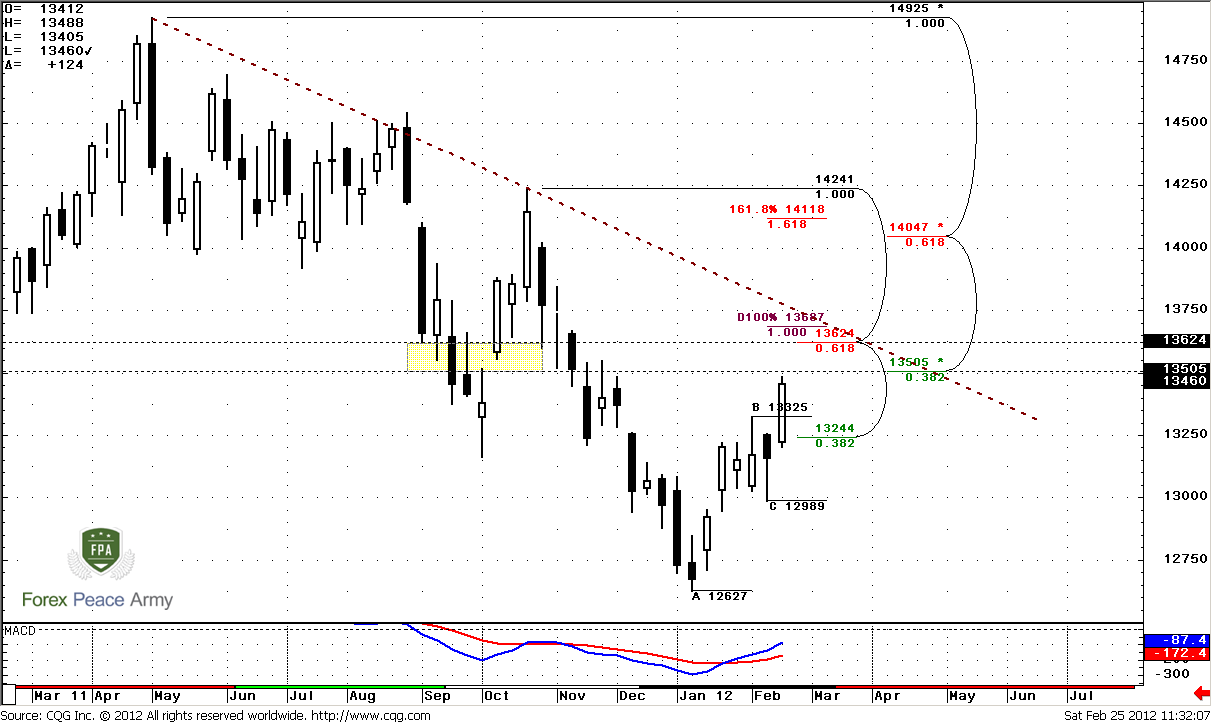
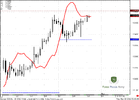
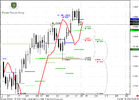
EUR_M_27_02_12.PNG


Weekly
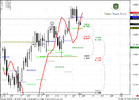
Analysis of this time frame does not look complex on current week. Trend holds bullish, market is not at overbought condition. Right above the market 1.3505-1.3625 K-resistance area and Agreement with AB-CD target 1.3687. Also pay attention that previous swing low stands at the same area – this will add resistance to it.
Speaking about trend line – I’ve drawn it in this way. You probably will draw it a bit different if apply just two most recent points. In this case it will be slightly steeper. Nevertheless it also stands in the same area and also will be resistance.
In general, weekly analysis tells us to be careful on daily time frame, when market will step above 1.35. This is resistance zone and some reversal patterns and retracements could appear on daily time frame.
And the last one here – although I do not have monthly pivot R1 on this chart, market now stands above it. This points on the fact, that although overall bearish trend has not been broken yet, still market could show at least deeper retracement up.
There is also another Agreement exists at 1.4050-1.4120 area, but it stands beyond overbought level that’s why not important for us currently. But if switch on imagination – reaching of it could lead to reverse H&S pattern…
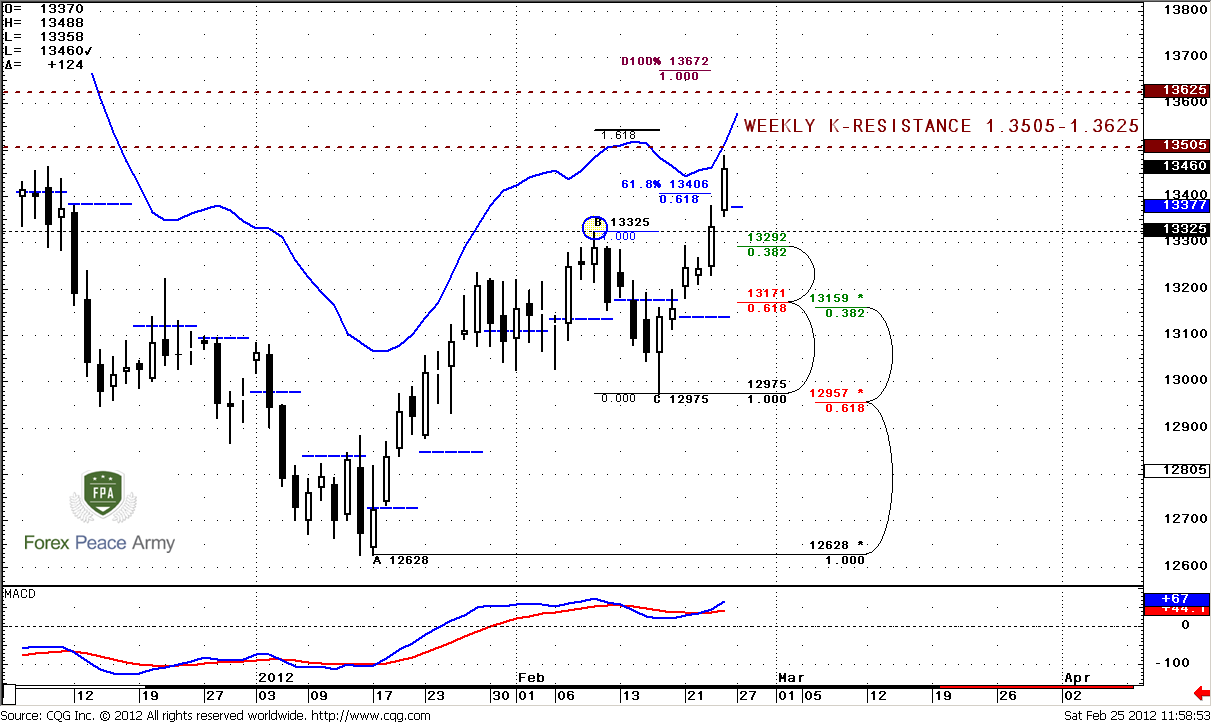
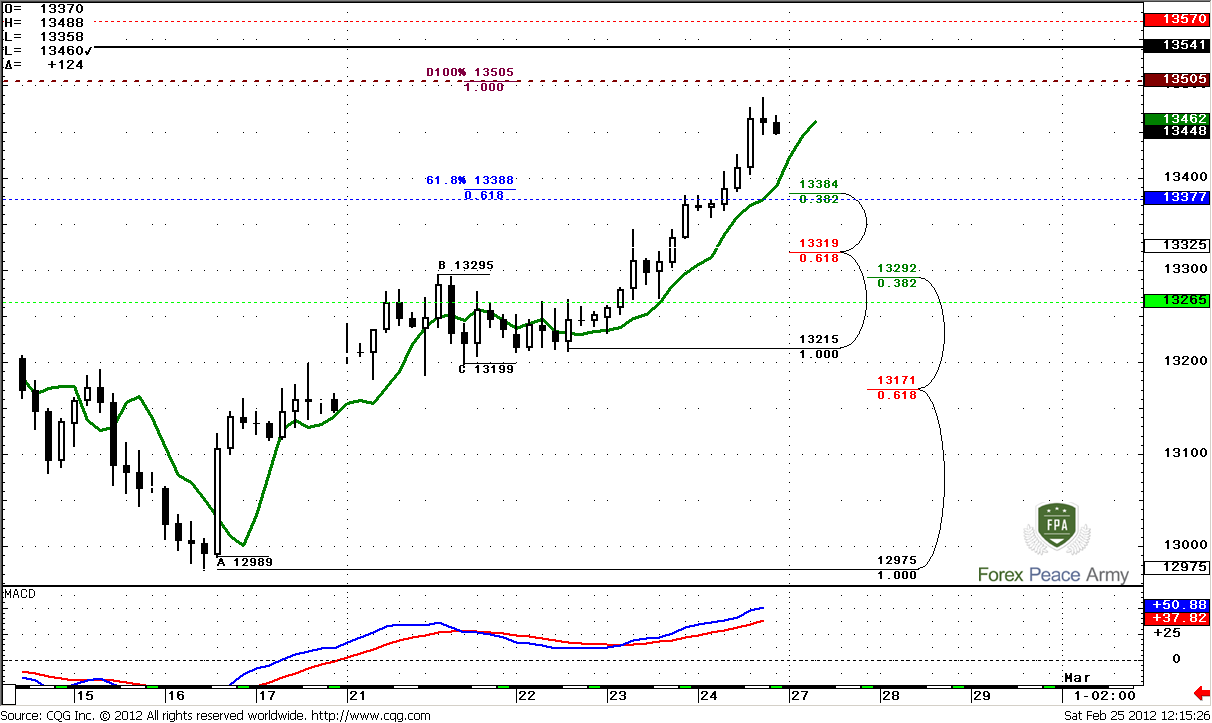
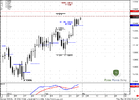
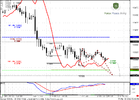
EUR_W_27_02_12.PNG


Daily
Trend is strongly bullish, market is approaching to weekly K-resistance area. Level of overbought for Monday stands at 1.3570. Also we can see 1.3550 is 1.618 extension of previous retracement down. Since market stands very close to resistance area, this is not very good idea to enter long right here – in the middle of upward move and near resistance. Although probably market will proceed higher, it’s better to buy deep to enter Long.
At the same time, since all trends are bullish, and market not at oversold, this retracement should not be too deep. I prefer to see support at 1.3292-1.3325 area – nearest daily Fib support and previous high. Also, this is very close to pivot point - 1.3377. Next target after retracement probably will be 1.3670 – daily AB=CD target.
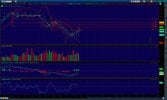
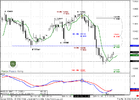
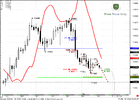
EUR_D_27_02_12.PNG


4-hour
Trend is bullish. Market shows nice thrust up, that will be perfect for DRPO or B&B pattern, if they will appear of cause. The odds exist that they will, because right above the market stand: 1.3505 Fib resistance, 1.3541 1.618 extension of daily retracement, 13570 weekly pivot R1 and overbought. May be market will continue move up a bit, but logically market should start retracement sooner rather than later and somehow respect this strong area. If you trade intraday you may use this respect and enter short, if you trade on daily time frame – use it to enter long.
On hourly chart I do not see any significant moments that allow us to make valuable add-on.
EUR_4H_27_02_12.PNG


Conclusion:
Combination of monthly bearish trend and bullish sentiment on lower time frames points on deeper upward retracement to 1.35-1.37 area. At the same time this area is significant beacon, because bearish sentiment does not suggest it’s break, since market just has reached 0.618 AB-CD target on monthly. If it will happen this will be quite another tune.
On daily time frame trend is strongly bullish, but market is approaching to solid resistance level, so may be it will be better idea to buy some deep when it will appear. Since market is not at overbought at weekly, 1.33 area looks suitable for that purpose.


The technical portion of Sive's analysis owes a great deal to Joe DiNapoli's methods, and uses a number of Joe's proprietary indicators. Please note that Sive's analysis is his own view of the market and is not endorsed by Joe DiNapoli or any related companies.
 
EUR/USD Daily Update, Tue 28, February 2012

Good morning,
on daily time frame market has formed inside trading session and now overall picture looks like bullish pennant. Price has shown just shallow retracement to pivot point and currently stands above it. Still some deeper pullback is possible that will not break overall pretty of bullish picture on daily time frame.

On 4-hour TF trend is bearish. You can see nice B&B that has happened yesterday (we've talked about this possibility in our weekly research). If we will exclude simple upward continuation, then we will get another scenario - AB=CD move down, that also will give us Gartley "222" buy pattern.
You might see, that if this will happen - we will get perfect entry point - Agreement at K-support level, that is also 4-hour oversold and previous swing high at 1.3325. If you trade on daily basis - that is what to watch for.

On hourly TF trend is bullish and market now is hitting B&B target around Agreement 1.3434-1.3442. That is also "222" Sell. So, how we can trade this contradictive signals?

IF you're bearish, then your focus is AB=CD on 4-hour TF. You probably may try to short right from hourly Agreement. Since this is significant level, odds suggest that market should respect it somehow, at least with shallow retracement down. Use it to move your stop to breakeven.

If you're bullish, then your level to watch is 1.3410 hourly K-support. Use the same tactic as for bearish scenario - try to enter long. Since this is K-support, we also can count on some shallow pullback - use it to move your stop to b/e.

In fact "move to b/e" technique is extremely useful in such situations - when you want to trade patterns, both of which too small to change overall picture. That's why both of them could happen.
In general trading on bullish side is safer, since daily trend is bullish.
 

Attachments

  • EUR_1H_28_02_12.PNG
    EUR_1H_28_02_12.PNG
    47.5 KB · Views: 105
  • EUR_4H_28_02_12.PNG
    EUR_4H_28_02_12.PNG
    42.7 KB · Views: 92
  • EUR_D_28_02_12.PNG
    EUR_D_28_02_12.PNG
    43.6 KB · Views: 86
Last edited:
EUR/USD Daily Update, Wed 29, February, 2012

Hi there,
Looks like we might say that our yesterday trading plan was suitable. Moving S/L to B/E is very nice tool in this situation...

On daily TF market is trying to continue move up and gradually approaching to 1.3505 Monthly Fib resistance level. So, from that perspective I do not feel very comfortable to enter long on daily. Personally, I will try to find some reversal patterns inside 1.3505-1.37 area to enter short.

On 4-hour TF we see bullish dynamic pressure and bearish SG simulteniously. In current situation I probably believe more to dynamic pressure. First is because it according to current trend, second - because I prefer SG's in a row with direction of previous move.

On hourly TF We have potential Butterfly "Sell" pattern. And probably this is the most safe context that is possible for trading. The one problem with it, is that intrinsic AB-CD pattern has target below previous swing high. This adds value and strength to previous high and overall picture could turn to "222" Sell, if market will not break it. IF even it will - it could be W&R, that will be even more bearish.

So, personally I think that is safer to wait completement of Butterfly. If market will turn down earlier - than to search some another possibility. AS anticipation of Butterfly, as entering short before it will complete - are more risky ideas.
 

Attachments

  • EUR_1H_29_02_12.PNG
    EUR_1H_29_02_12.PNG
    40.8 KB · Views: 99
  • EUR_4H_29_02_12.PNG
    EUR_4H_29_02_12.PNG
    37 KB · Views: 83
  • EUR_D_29_02_12.PNG
    EUR_D_29_02_12.PNG
    39.9 KB · Views: 82
Last edited:
EUR/USD Daily Update, Thu 01, March 2012

Good morning,
Yesterday market has shown solid plunge down and approach to level, that we've specified - 13290-1.3325. This level includes previous top, nearest Fib support. Slightly below it stands pivot support 1 and march pivot point 1.3265. Also, market is very close to trend breakeven point.
From bullish point of view, if their force is still solid - market should find support here and continue move up, because:
1. Weekly trend is bullish;
2. Daily trend is bullish;
3. market is not at oversold;
4. Pivot support 1 should hold retracement at bull trend;
5. market should hold above monthly pivot point.
If market will form SG - that will be much better. Hence, if market will break that area, this let us assume that either market will show deeper retracement with weekly uptrend (till 1.3160-1.3170 K-support) or this is continuation of monthly downward trend.
Anyway breakout of 1.3265 level will shift our context to bearish.

On 4 hour TF we have AB=CD pattern, and 1.618 extension in Agreement with 1.3292 Fib support. I dare to suggest that market will reach it. IF you're bullish - watch for reversal patterns there, for example Butterfly "buy", 3-Drive or something.

On hourly chart we have nice thrust, but market stands too long above 3x3 for B&B. Probably I will treat it as just potential retracement. The level that seems logical is 1.3377 - pivot+previous swing low + 3/8 Fib resistance.

So, if you're scalper - you may try to make couple of trades- short on hourly and buy on 4-hour chart after that.
 

Attachments

  • EUR_1H_01_03_12.PNG
    EUR_1H_01_03_12.PNG
    47.4 KB · Views: 74
  • EUR_4H_01_03_12.PNG
    EUR_4H_01_03_12.PNG
    41.9 KB · Views: 70
  • EUR_D_01_03_12.PNG
    EUR_D_01_03_12.PNG
    44.3 KB · Views: 73
Last edited:
EUR/USD Daily Update, Fri 02, March 2012

Good morning,
Yesterday market has hit our 1.3290 Agreement level.
On daily time frame almost nothing to watch, except may be potential SG pattern - if market will close above 1.3361. Most interesting today on 4-hour-1hour TF.

Since we've said that combination of Agreement, previous swing high, pivot support and monthly pivot is a solid support level - market could respect it. And probably minimum respect move will be to 1.3360-1.3370 level as 3/8 resistance of overall move down.
So we need to catch some reversal pattern to make a scalp buy trade - if market will give us any, of cause.

On 4hour TF we see that this could be 1.618 3-Drive pattern with 1.3247 point of completement. Probably it is more a hint on 3-Drive, because it is rather small and not perfectly harmonized. But it holds 1.618 ratio - so, some chances exist that it will take place.

On hourly chart we see also a Butterfly "Buy", that is very often becomes a part of 3-DRive.
Also this potential to some splash to downside is confirming by bearish Dynamic pressure.
I've drawn 1.618 Butterfly, but it also could be 1.27, who knows...

So, how to trade all this stuff?

Two ways - gradual enter - partially at 1.27 of Butterfly, partially at 1.618. Stop for both positions should be below 1.618 point.

Second way is to enter only at 1.618 point. But in this case you can miss the trade, but your loss will be smaller.
So the choice is up to you, as usual...
 

Attachments

  • EUR_1H_02_03_12.PNG
    EUR_1H_02_03_12.PNG
    43.8 KB · Views: 103
  • EUR_4H_02_03_12.PNG
    EUR_4H_02_03_12.PNG
    44.5 KB · Views: 85
  • EUR_D_02_03_12.PNG
    EUR_D_02_03_12.PNG
    45.1 KB · Views: 85
Last edited:
Sive,
I have a question on MACDP and time. In my experience with the charts, something I have observed is the time relationship with the plotting of MACDP alluding to the amount of time until a trend change. I chose to post this as a new thread because I expect you will be putting up weekly analysis tomorrow and might miss it. If you look at the plot on the weekly chart the MACDP line has not yet begun an upturn, so it leaves me to ask if we might expect more retracement or sideways action while the price of a trend change catches up? It currently seems that the weekly will remain in an uptrend until the next cross of the MACDP.

I post this for some of the newer recruits to watch so they aren't getting short before it's time, if they are longer TF traders, ultimately to be taken for a ride by the continuation of the trend.

Hi Joshnix,
well, this is mostly due MACD math. We can accept sideway action or some lazy move according with new trend. There is one thing that we do not want to see - move against MACD. In some cases this calls dynamic pressure. Something like we saw on daily chart, when trend holds bearish and market shows solid upward move. This was possible exaclty by solid free room for market by MACD.
 
"Combination of monthly bearish trend and bullish sentiment on lower time frames points on deeper upward retracement to 1.35-1.37 area. At the same time this area is significant beacon, because bearish sentiment does not suggest it’s break, since market just has reached 0.618 AB-CD target on monthly."

"Next target after retracement probably will be 1.3670 – daily AB=CD target."

Hey Sive,

Thanks for your weekly analysis. I am just confused about these two statements. Here, you state that because there is overall bearish sentiment, you do not suggest 1.3650 to break. However, you then state that AFTER the retracement, market will probably head up towards 1.3670.

I know you stated 1.3670 because of the daily AB=CD target but because of the bearish sentiment like you said, wouldn't 1.3650 hold off the daily AB=CD target or does the same "direction over trend" rule apply here?

Regards,
Brandon

Hi Brandon.
Not overall sentiment is bearish. Bearish outlook holds only on monthly chart. I've said that if break will happen - this will change the sentiment.
This AB=CD target stands inside monthly K-area. So, reaching of it will not erase bearish context yet.
 
Hi Sive,
Thanks as usual for your indept analysis,
Now I understand almost every steps you take and Why you took them.
thanks greatly.
But Pls Can you help me with pivot point indicators for weekly and monthly time frame or If anybody in the house can help me with it,itwill be highly appreciated. the one I have often have wide different from R1-R3 and S1-S2 when I use manual calculation.
thanks
 
Back
Top