Sive Morten
Special Consultant to the FPA
- Messages
- 18,644
Fundamentals
So, it's time to take a look at two important numbers that we've got this week - PPI and Retail sales. Additionally we briefly take a look at the same EU data, because the background mostly stands the same. First is, our task to shake off the rosy glasses and provide clear vision of structural changes that mostly point on economy decreasing but not on "soft landing" and "reversal to growth". Debt ceil issue and current situation on US Treasury market we consider in our Gold market weekly report.
The phenomenon of inflation dropping
Now it is hot debates everywhere concerning drop of inflation across the board. In telegram we've mentioned seven indicators that usually analysts point on to prove that inflation has peaked - CPI, PPI, US yields, CPI Rate of change, Dollar index, wages, and 2/10 year US Treasuries spread. Many of them are mutually related, but, investors come to conclusion of inflation slowdown and somehow it goes without saying that US economy is turning to growth. But we suggest that it is not necessary so. Sometimes, these two subjects have a direct relation but not this time. And bright example is the US Real Estate market. I just show you few numbers and you could transpose it to inflation data and understand what I'm talking about.
Take a look that the US Mortgage rates have turned down and following to the same logic - it has to be treated as a sign of market recovery. The average interest rate on the most popular U.S. home loan dropped to its lowest level since September to 6.23% for the week ended Jan. 13. Just 2-3 months ago it was around 7.62%. But, this week house market data shows no signs of recovery:
U.S. existing home sales plunged to a 12-year low in December, existing home sales, which are counted when a contract is closed, fell 1.5% to a seasonally adjusted annual rate of 4.02 million units last month, the lowest level since November 2010. That marked the 11th straight monthly decline in sales, the longest such stretch since 1999.

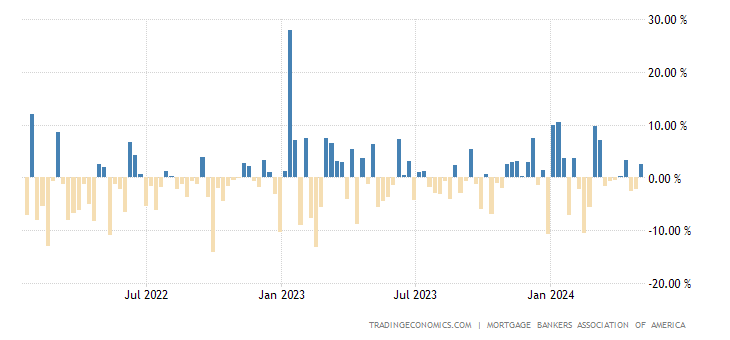
Only jump in December mortgage applications gives shy hope that maybe situation is turning to better.
Now, people who intend to take a mortgage loan have to be ready to pay ~ 45% of its monthly income to serve the loan. Not everybody is ready to do this. And I would ask you again - now how do you think, does the drop of mortgage rate suggest real estate market reverse up, or, maybe rates are dropping just because it is no demand for houses? People are loosing wealth, savings, earnings and can't afford to take a loan to buy a new house. Decrease of demand leads to decrease of prices... This is how real things stand. Now let's go back to US inflation and take a look what is going on in US economy.
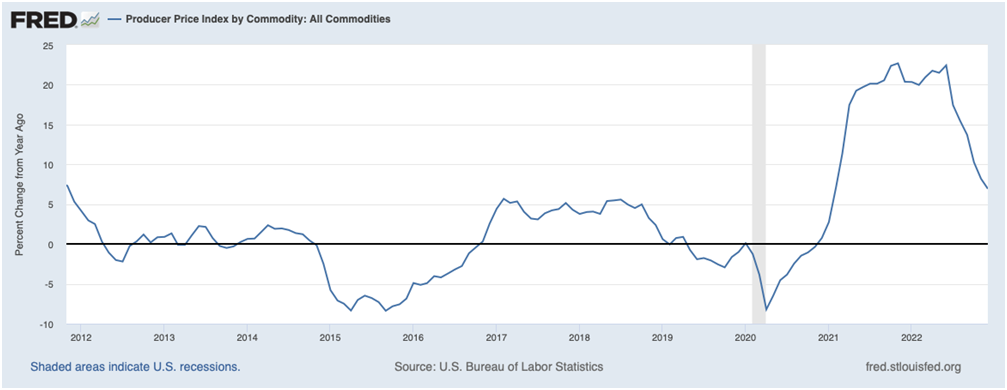
Indeed, our favorite indicator of PPI Commodities (this is not PPI index per se) shows the decreasing. It might be an indication of successful monetary policy...or maybe the reason is different - drop of population wealth and consumer demand? Let's see... First is, here we do not want to de-compound PPI numbers to show the impact of different components, but you should recall our CPI analysis last week, where we've clearly shown that core inflation remains stable and even is growing and inflationary leader is changing every time. It is expected that in 2023 it will be service sector. Thus, nominal inflation is converging to core structural inflation by exhausting of energy component outbreaks of 2022 and pure calculation features. Core inflation goes nowhere and stands stubborn around 5% level despite Fed efforts. As you will see below, in EU is the same situation.
US economy data shows no signs of improving. Wide look at production, manufacturing, consumption and sentiment analysis shows it with evidence:

We could proceed and shows you PMI's and some other leading indicators:

What do the reports of the five FRBs have in common? Everyone is unanimous that orders for new products are falling (a leading indicator) at the highest rate since 2015. If we synchronize the index of new orders with industrial production, then the scale of the fall in orders is equivalent to a drop in industrial production by an average of 5-5.5% YoY, while the actual industrial production is growing by 2-3%.
The index of industrial activity decreases by 10 points on average across the five representative offices of the Federal Reserve – this is the equivalent of a decrease in industrial production by 4-4.5%. The employment index has turned down since February-March 2022, but so far in the positive area – this indicates a sharp reduction in the pace of hiring. Couple of weeks ago we've considered contradictions on US job market, and showed that it doesn't correspond to idea of growth economy as well.
In two worlds, we could say that Business is extremely pessimistic about the prospects, and pessimism correlates with the freezing of investment activity and hiring staff. This should soon have a negative impact on the economy.

Note that all this is happening against the background of declining inflation. This suggests that the reduction in inflation itself is not a panacea for the crisis. Well, it confirms that the crisis is now structural, which flows smoothly from one sector of the economy to another. Industrial inflation in terms of the total volume of goods (this is not the PPI index) decreased in December, which corresponded to the expectations of the Fed leadership. But there may be a twofold interpretation.
J. Powell&Co hoped that a reduction in inflation would improve the economy. But, on the other hand, it is possible that the decline in inflation is a consequence of the ongoing recession of the economy and then it is rather a negative symptom. We treat this scenario as a most probable for now, at least until other indicators will not rebut this evidence.
The same is in EU
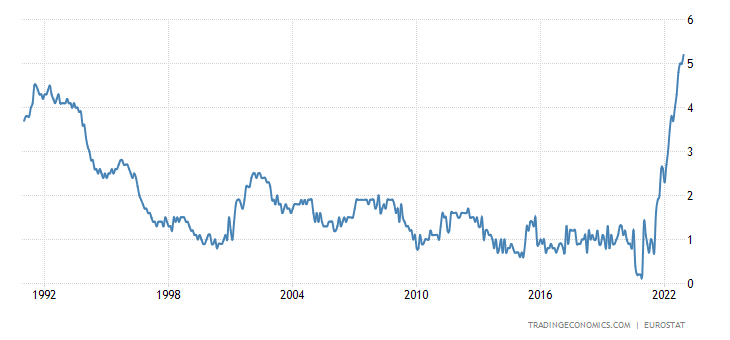
From our point of view, the second option is clearly taking place in EU and looks even brighter and this is not a positive circumstance at all. If you take a look at EU nominal and core inflation you could see the same thing - nominal inflation is turning down, while core inflation hits the new records. By November 2022, inflation slowed to 10.1%/11.1% and 9.2%/10.4% in December 2022.
Inflation is fading, but inflation without energy continues its rapid ascent to new records! A year ago, inflation without energy was 2.8%, in October – 6.9%, in November – 7%, and in December – 7.2%, i.e. the acceleration rate slowed down, but the growth continues. Moreover, prices increased by 0.6% over the month, which corresponds to an annual rate of over 7%.
What should we proceed from? By Q2 2023, energy inflation may make a negative contribution to the overall price change due to the effect of the base of 2021 and the fall in energy prices in 2023, however, non-energy inflation is persistently high. The core (ex. food and energy) CPI of the eurozone is a record for 32 years of observations (+5.2% per year). Let's not dig this time components - mostly we also could see the same, that inflation is becoming structural drifting from one sector to another but remains around 5-5.5% in sum. It is 5 times higher than typical and continues to grow!
And here is Germany statistics - all the same stuff that we're familiar with already. Drop of the sentiment, vacancies, real wage, Retail Sales, production and... nominal inflation. While core inflation is keep rising.

This situation is not specific to the Germany. You could see the same stuff in UK as well and other countries across the board - Australia, NZ, Japan etc:

The nature of a structural crisis
Well, hopefully our prove of structural crisis is reasonable enough to assure that the US is not even near to upside economy reversal. Additionally, we could show it, based on re-structure of the US economy. High technology and service sector have replaced classic spheres such as an agriculture, mining etc.:

The share of the manufacturing industry in the US economy in the 3rd quarter of 2016 was 11.6%, practically unchanged for 6 years and by Q2 2022 the share was 11.3% compared to 13.5% before the 2008 crisis.
There is a more pronounced trend in the share of industrial production, excluding the production of computers and components. In Q3 2016, this share in GDP was 10%, now 9.5%, before the crisis of 2008 – 12.3% at the maximum. The trend has been steadily descending for the last 15 years.
Agriculture, fishing, forestry forms only 1% of GDP. Mining forms 1.84% of GDP. Utilities (electricity, water supply, sewerage) have a share of 1.4% of GDP. Thus, the "real" manufacturing economy forms only 15.6% of the US economy, and excluding the production of computers and components – 13.8%
The accelerated decline began from the 3rd quarter of 2020 and continues to the current moment on the trajectory of the expansion of the digital economy. At the same time, we recall that in the middle of the twentieth century, the share of industry was more than 60% in the structure of GDP.
Someone will say that there is nothing wrong with this, it's just that the United States has built a "post-industrial" economy. The trouble is that the structure of consumption has changed much less over these decades (everyone can check it for themselves - do you spend 87% on gadgets or food, utilities and goods?), this is clearly seen in the structure of household costs. The essence of the structural crisis is precisely that stimulating demand has led to an increase in the costs of various kinds of gadgets.
The trouble is that the sales chain still ends with private (final) demand. Yes, it was approximated to the future with maximum growth rates and capitalized on the digital economy today, taking into account potential future sales. But today it is clear that demand is falling and this means that the capitalization of digital giants (and non-giants) will soon begin to decline. Layoffs in some super companies are an example of this:

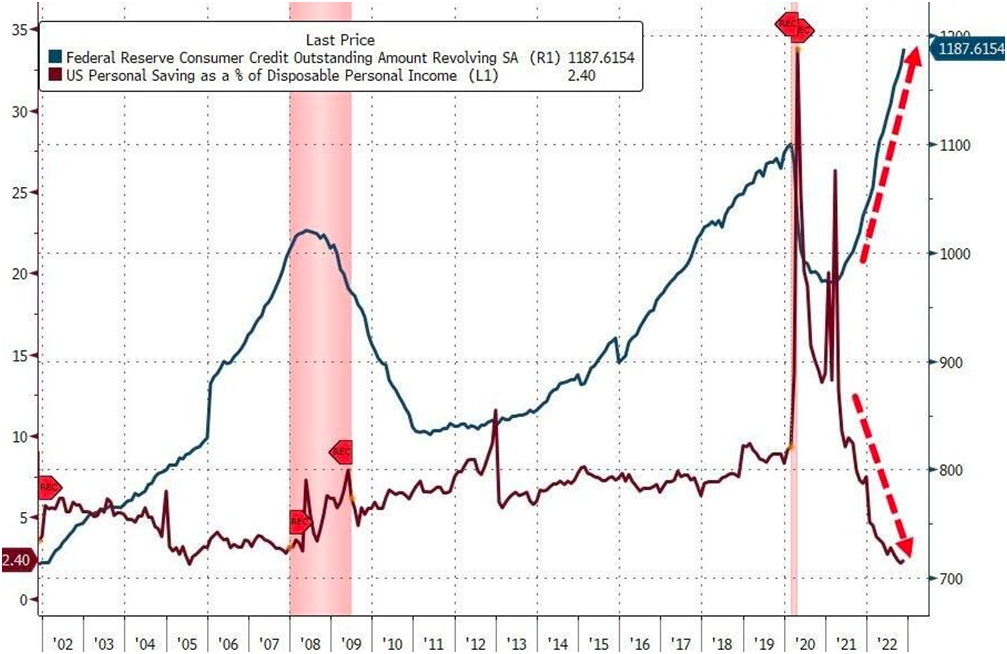
The structure of the world and American economies gradually spontaneously returns to a more natural state, in which the structure of the economy (that is, value added) corresponds to the structure of the final. consumption. You can add to the pictures of the unbalanced structure of the economy and graphs of private debt and savings:
In general, it is possible that the decrease in inflation is due not only to the purely monetary effect of the increase in the cost of credit, but also to the accumulated effect of a decrease in GDP (we have already noted that for the United States, the decline by the end of 2022 is 6-8%) and spontaneous corrections of structural imbalances. Until recently, the US monetary authorities tried to slow down these natural processes through emission mechanisms, but the stop of the emission returned the economy to the trajectory of its normal change, that is, an increase in the relative share of the real sector due to a sharp decrease in the capitalization of the digital economy.
Conclusion:
As you could see, the negative moments are just starting to appear in statistics, which should be more evident in nearest few months. Some analysts anticipate that, telling that Fed hardly will be able to hold this burden:
The Federal Reserve can probably start to slow its balance sheet runoff once bank reserves fall to around 10% or 11% of gross domestic product, Fed Governor Christopher Waller said on Friday. Those reserves and repurchase agreements currently total just over $5.6 trillion, roughly around 22% of gross domestic product as of the third quarter of last year. So, they hint that they will sell around $2.5-2.8 Trln more and that's it.
Morgan Stanley in turn, cuts its 2023 year-end forecast for the dollar index to 98, and expects the greenback's weakness to be more pronounced against the euro this year as worries about the severity of an economic downturn start to ease. They previously saw the index , which weighs the U.S. currency against a basket of six major rivals, ending 2023 at 104.
The Wall Street bank now sees the euro strengthening against the dollar to 1.15 by year-end versus a previous forecast of 1.08. The euro was last trading at 1.08. Among G10 currencies, MS strategists expect negative returns for the year from the British pound given domestic growth challenges, and from the Japanese yen due to its preference as a funding currency.
We're a bit sceptic on this suggestion by common sense reasons. First is, as we've shown above, EU economy hardly looks better than the US one. Geopolitical situation is much better in the US, and EU keeps its back-seat role. Big fragmentation and non-uniform economy structure, existence if PIIGS countries problems hardly will let EUR to take the lead. Morgan Stanley is respectable authority, maybe we're wrong, but we do not see reasons to change our view for now. If recovery starts, it starts earlier in US than in EU. EU now is clear financial donor to US.
So, it's time to take a look at two important numbers that we've got this week - PPI and Retail sales. Additionally we briefly take a look at the same EU data, because the background mostly stands the same. First is, our task to shake off the rosy glasses and provide clear vision of structural changes that mostly point on economy decreasing but not on "soft landing" and "reversal to growth". Debt ceil issue and current situation on US Treasury market we consider in our Gold market weekly report.
The phenomenon of inflation dropping
Now it is hot debates everywhere concerning drop of inflation across the board. In telegram we've mentioned seven indicators that usually analysts point on to prove that inflation has peaked - CPI, PPI, US yields, CPI Rate of change, Dollar index, wages, and 2/10 year US Treasuries spread. Many of them are mutually related, but, investors come to conclusion of inflation slowdown and somehow it goes without saying that US economy is turning to growth. But we suggest that it is not necessary so. Sometimes, these two subjects have a direct relation but not this time. And bright example is the US Real Estate market. I just show you few numbers and you could transpose it to inflation data and understand what I'm talking about.
Take a look that the US Mortgage rates have turned down and following to the same logic - it has to be treated as a sign of market recovery. The average interest rate on the most popular U.S. home loan dropped to its lowest level since September to 6.23% for the week ended Jan. 13. Just 2-3 months ago it was around 7.62%. But, this week house market data shows no signs of recovery:
U.S. existing home sales plunged to a 12-year low in December, existing home sales, which are counted when a contract is closed, fell 1.5% to a seasonally adjusted annual rate of 4.02 million units last month, the lowest level since November 2010. That marked the 11th straight monthly decline in sales, the longest such stretch since 1999.
Only jump in December mortgage applications gives shy hope that maybe situation is turning to better.
Now, people who intend to take a mortgage loan have to be ready to pay ~ 45% of its monthly income to serve the loan. Not everybody is ready to do this. And I would ask you again - now how do you think, does the drop of mortgage rate suggest real estate market reverse up, or, maybe rates are dropping just because it is no demand for houses? People are loosing wealth, savings, earnings and can't afford to take a loan to buy a new house. Decrease of demand leads to decrease of prices... This is how real things stand. Now let's go back to US inflation and take a look what is going on in US economy.
Indeed, our favorite indicator of PPI Commodities (this is not PPI index per se) shows the decreasing. It might be an indication of successful monetary policy...or maybe the reason is different - drop of population wealth and consumer demand? Let's see... First is, here we do not want to de-compound PPI numbers to show the impact of different components, but you should recall our CPI analysis last week, where we've clearly shown that core inflation remains stable and even is growing and inflationary leader is changing every time. It is expected that in 2023 it will be service sector. Thus, nominal inflation is converging to core structural inflation by exhausting of energy component outbreaks of 2022 and pure calculation features. Core inflation goes nowhere and stands stubborn around 5% level despite Fed efforts. As you will see below, in EU is the same situation.
US economy data shows no signs of improving. Wide look at production, manufacturing, consumption and sentiment analysis shows it with evidence:
We could proceed and shows you PMI's and some other leading indicators:
What do the reports of the five FRBs have in common? Everyone is unanimous that orders for new products are falling (a leading indicator) at the highest rate since 2015. If we synchronize the index of new orders with industrial production, then the scale of the fall in orders is equivalent to a drop in industrial production by an average of 5-5.5% YoY, while the actual industrial production is growing by 2-3%.
The index of industrial activity decreases by 10 points on average across the five representative offices of the Federal Reserve – this is the equivalent of a decrease in industrial production by 4-4.5%. The employment index has turned down since February-March 2022, but so far in the positive area – this indicates a sharp reduction in the pace of hiring. Couple of weeks ago we've considered contradictions on US job market, and showed that it doesn't correspond to idea of growth economy as well.
In two worlds, we could say that Business is extremely pessimistic about the prospects, and pessimism correlates with the freezing of investment activity and hiring staff. This should soon have a negative impact on the economy.
Note that all this is happening against the background of declining inflation. This suggests that the reduction in inflation itself is not a panacea for the crisis. Well, it confirms that the crisis is now structural, which flows smoothly from one sector of the economy to another. Industrial inflation in terms of the total volume of goods (this is not the PPI index) decreased in December, which corresponded to the expectations of the Fed leadership. But there may be a twofold interpretation.
J. Powell&Co hoped that a reduction in inflation would improve the economy. But, on the other hand, it is possible that the decline in inflation is a consequence of the ongoing recession of the economy and then it is rather a negative symptom. We treat this scenario as a most probable for now, at least until other indicators will not rebut this evidence.
The same is in EU
From our point of view, the second option is clearly taking place in EU and looks even brighter and this is not a positive circumstance at all. If you take a look at EU nominal and core inflation you could see the same thing - nominal inflation is turning down, while core inflation hits the new records. By November 2022, inflation slowed to 10.1%/11.1% and 9.2%/10.4% in December 2022.
Inflation is fading, but inflation without energy continues its rapid ascent to new records! A year ago, inflation without energy was 2.8%, in October – 6.9%, in November – 7%, and in December – 7.2%, i.e. the acceleration rate slowed down, but the growth continues. Moreover, prices increased by 0.6% over the month, which corresponds to an annual rate of over 7%.
What should we proceed from? By Q2 2023, energy inflation may make a negative contribution to the overall price change due to the effect of the base of 2021 and the fall in energy prices in 2023, however, non-energy inflation is persistently high. The core (ex. food and energy) CPI of the eurozone is a record for 32 years of observations (+5.2% per year). Let's not dig this time components - mostly we also could see the same, that inflation is becoming structural drifting from one sector to another but remains around 5-5.5% in sum. It is 5 times higher than typical and continues to grow!
And here is Germany statistics - all the same stuff that we're familiar with already. Drop of the sentiment, vacancies, real wage, Retail Sales, production and... nominal inflation. While core inflation is keep rising.
This situation is not specific to the Germany. You could see the same stuff in UK as well and other countries across the board - Australia, NZ, Japan etc:
The nature of a structural crisis
Well, hopefully our prove of structural crisis is reasonable enough to assure that the US is not even near to upside economy reversal. Additionally, we could show it, based on re-structure of the US economy. High technology and service sector have replaced classic spheres such as an agriculture, mining etc.:
The share of the manufacturing industry in the US economy in the 3rd quarter of 2016 was 11.6%, practically unchanged for 6 years and by Q2 2022 the share was 11.3% compared to 13.5% before the 2008 crisis.
There is a more pronounced trend in the share of industrial production, excluding the production of computers and components. In Q3 2016, this share in GDP was 10%, now 9.5%, before the crisis of 2008 – 12.3% at the maximum. The trend has been steadily descending for the last 15 years.
Agriculture, fishing, forestry forms only 1% of GDP. Mining forms 1.84% of GDP. Utilities (electricity, water supply, sewerage) have a share of 1.4% of GDP. Thus, the "real" manufacturing economy forms only 15.6% of the US economy, and excluding the production of computers and components – 13.8%
The accelerated decline began from the 3rd quarter of 2020 and continues to the current moment on the trajectory of the expansion of the digital economy. At the same time, we recall that in the middle of the twentieth century, the share of industry was more than 60% in the structure of GDP.
Someone will say that there is nothing wrong with this, it's just that the United States has built a "post-industrial" economy. The trouble is that the structure of consumption has changed much less over these decades (everyone can check it for themselves - do you spend 87% on gadgets or food, utilities and goods?), this is clearly seen in the structure of household costs. The essence of the structural crisis is precisely that stimulating demand has led to an increase in the costs of various kinds of gadgets.
The trouble is that the sales chain still ends with private (final) demand. Yes, it was approximated to the future with maximum growth rates and capitalized on the digital economy today, taking into account potential future sales. But today it is clear that demand is falling and this means that the capitalization of digital giants (and non-giants) will soon begin to decline. Layoffs in some super companies are an example of this:
The structure of the world and American economies gradually spontaneously returns to a more natural state, in which the structure of the economy (that is, value added) corresponds to the structure of the final. consumption. You can add to the pictures of the unbalanced structure of the economy and graphs of private debt and savings:
In general, it is possible that the decrease in inflation is due not only to the purely monetary effect of the increase in the cost of credit, but also to the accumulated effect of a decrease in GDP (we have already noted that for the United States, the decline by the end of 2022 is 6-8%) and spontaneous corrections of structural imbalances. Until recently, the US monetary authorities tried to slow down these natural processes through emission mechanisms, but the stop of the emission returned the economy to the trajectory of its normal change, that is, an increase in the relative share of the real sector due to a sharp decrease in the capitalization of the digital economy.
Conclusion:
As you could see, the negative moments are just starting to appear in statistics, which should be more evident in nearest few months. Some analysts anticipate that, telling that Fed hardly will be able to hold this burden:
The Federal Reserve can probably start to slow its balance sheet runoff once bank reserves fall to around 10% or 11% of gross domestic product, Fed Governor Christopher Waller said on Friday. Those reserves and repurchase agreements currently total just over $5.6 trillion, roughly around 22% of gross domestic product as of the third quarter of last year. So, they hint that they will sell around $2.5-2.8 Trln more and that's it.
Morgan Stanley in turn, cuts its 2023 year-end forecast for the dollar index to 98, and expects the greenback's weakness to be more pronounced against the euro this year as worries about the severity of an economic downturn start to ease. They previously saw the index , which weighs the U.S. currency against a basket of six major rivals, ending 2023 at 104.
"Global growth is showing signs of buoyancy, macro and inflation uncertainty are waning and the USD is rapidly losing its carry advantage," said currency strategists at Morgan Stanley led by James K Lord, in a note published late on Sunday.
The Wall Street bank now sees the euro strengthening against the dollar to 1.15 by year-end versus a previous forecast of 1.08. The euro was last trading at 1.08. Among G10 currencies, MS strategists expect negative returns for the year from the British pound given domestic growth challenges, and from the Japanese yen due to its preference as a funding currency.
We're a bit sceptic on this suggestion by common sense reasons. First is, as we've shown above, EU economy hardly looks better than the US one. Geopolitical situation is much better in the US, and EU keeps its back-seat role. Big fragmentation and non-uniform economy structure, existence if PIIGS countries problems hardly will let EUR to take the lead. Morgan Stanley is respectable authority, maybe we're wrong, but we do not see reasons to change our view for now. If recovery starts, it starts earlier in US than in EU. EU now is clear financial donor to US.