Sive Morten
Special Consultant to the FPA
- Messages
- 18,648
Fundamentals
This week we've got some important data, including GDP, PCE index which were more or less positive. And now investors are gambling on perspectives. Could we treat these numbers, together with peaked inflation and stable NFP as a sign that worst things stand behind now? If even recession is not totally avoided yet, could we hope on softer way, maybe in some way of stagnation in the economy? Indeed, we see that many problems have lighter impact on EU and US economy which initially were seemed like absolutely devastating. But the problem here that modern statistics measures are too complicated, have different time lags and complex relation to each other that makes very difficult to understand what is really going on...
Market overview
World stocks rallied and the dollar edged up from eight-month lows on Friday as slowing inflation data raised hopes the Federal Reserve can engineer an economic soft landing and reduce its pace of aggressive monetary tightening next week.
U.S. consumer spending fell for a second straight month in December, a Commerce Department report said, which also showed the smallest gain in personal income in eight months that partly reflected moderate wage growth - booth good signs for inflation. U.S. consumer spending fell for a second straight month in December, putting the economy on a lower growth path heading into 2023, while inflation continued to subside, which could give the Federal Reserve room to further slow the pace of its interest rate hikes next week.
The most interesting guys, that this is "nominal" spending, which follows 2nd month in a row. If we exclude CV-19 drop, last time this happened 10 years ago. Now imagine what has happened with "real" spending, if even nominal ones are falling.
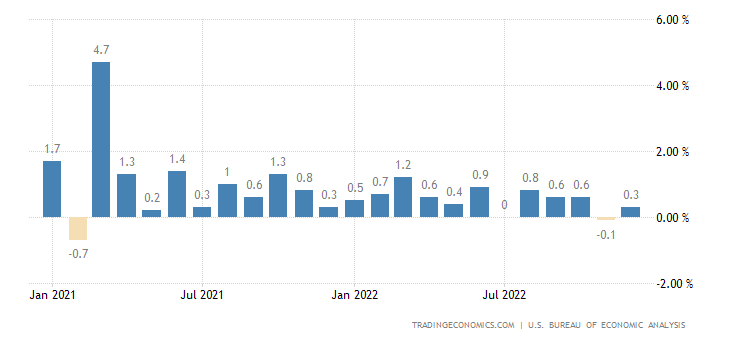
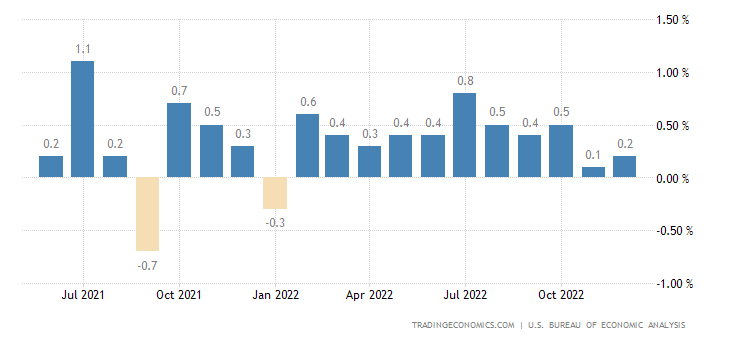
Consumer spending, which accounts for more than two-thirds of U.S. economic activity, dropped 0.2% last month. Data for November was revised lower to show spending slipping 0.1% instead of gaining 0.1% as previously reported. Economists polled by Reuters had forecast consumer spending dipping 0.1%.
Spending on long-lasting manufactured goods like motor vehicles, recreational goods and household furniture and equipment decreased 1.9%. Durable goods spending plunged 3.0% in November. Spending on nondurables like clothing and footwear declined 1.4% last month.
Though growth in spending on services is helping to anchor consumption, some households, especially those with lower incomes, have depleted savings accumulated during the COVID-19 pandemic, limiting the scope of gains.
So, recent data confirms everything that we've said on this subject through 2022 year...Adjusting for inflation, consumer spending fell 0.3% in December, the biggest decline in a year, after decreasing 0.2% in November. This puts consumer spending on a lower growth base at the start of the first quarter.
With personal income rising 0.2%, the smallest gain since April, after increasing 0.3% in November, the outlook for spending is uncertain.
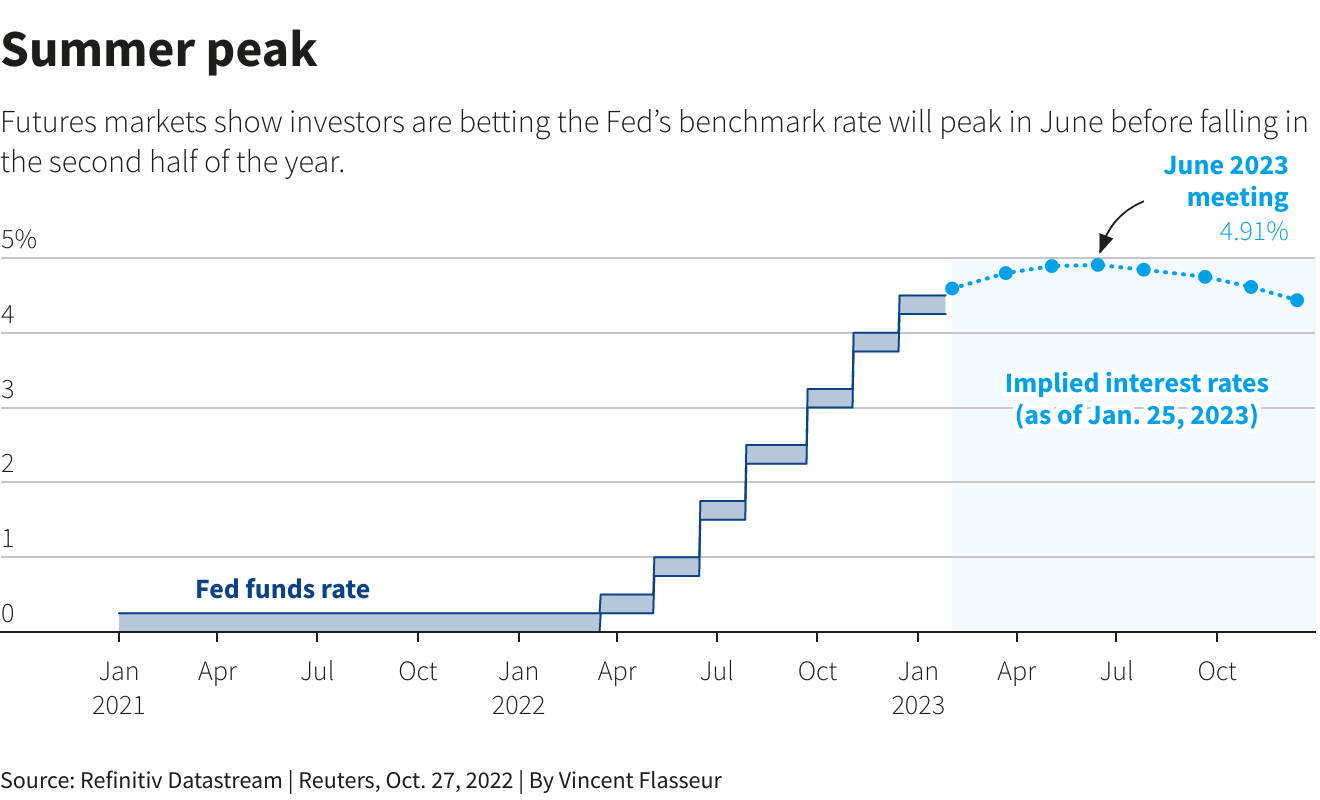
Traders of futures tied to the Fed's policy rate kept bets on Friday that the U.S. central bank will raise interest rates just once more beyond next week's widely expected quarter-point hike before stopping. The current target range is 4.25% to 4.5%.
The dollar edged higher against the euro on Thursday after data showed the U.S. economy maintained a strong pace of growth in the fourth quarter, backing the case for the U.S. Federal Reserve to maintain its hawkish stance for longer. Gross domestic product increased at a 2.9% annualised rate last quarter, the Commerce Department said in its advance fourth-quarter GDP growth estimate. The economy grew at a 3.2% pace in the third quarter.
A separate report from the Labor Department showed initial claims for state unemployment benefits dropped 6,000 to a seasonally adjusted 186,000 for the week ended Jan. 21.
So, with headline and core inflation now slowing, it seems as if the worst of the first-round inflationary shocks are probably over. Investors concur, with positive returns on bonds and equities so far this year, and lower market-implied risks of crises. Nevertheless, Fathom’s central forecast is still that the UK, euro area (EA) and the US will experience mild recessions in the coming year.
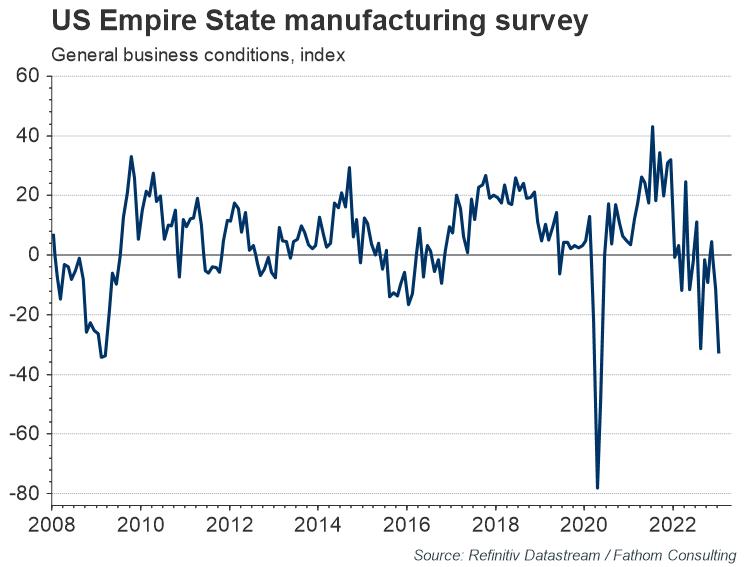
Other analysts tell man same things that we do. Economic activity in the world’s major industrialised countries held up better than expected last year. With China’s economy now reopening and European gas prices on the retreat, the mood music seems to be shifting into a more positive key. Indeed, last week in Davos the head of the IMF, Kristalina Georgieva, noted that the outlook was “less bad” than feared a few months ago. But while these are positive developments, observers should not get carried away. One reason for the resilience seems to have been households using their pandemic-related savings, a source of demand that cannot continue indefinitely. Moreover, although headline inflation has been falling in some places, core inflation remains stubbornly high; central banks appear likely to make further, demand-reducing increases in interest rates. Last week’s Empire State manufacturing survey also provides a reminder that business activity and sentiment remain very weak in some places.
At the same time, now we see that deteriorating processes accelerate in some US states. For example, Chicago business activity is negative for the 2nd month in a row:
If we exclude CV19 outbreak, then Richmond FRB reports on worst in 10 years production index, and 8 month of decreasing in service sector. Richmond FRB manufacturing 4th month decrease in a row. And US Leading indicators are dropping nine month in a row:

So, we see a typical picture of a structural crisis. For example, in the United States, the main problems from the inflationary sphere gradually moved to the construction sector, and now is spreading over whole industrial production. In other regions of the world, there are also problems in industry, retail sales are also falling, which indicates a reduction in household income (recall that household spending is about 70% of GDP in the US).
As we've mentioned above, personal income in nominal terms is falling in the United States — this is because methodology for estimating inflation, adopted today in the world, systematically underestimates it. If even nominal incomes are falling, then what can we say about real ones. The situation with GDP is similar in almost all countries: the official recession may not even begin, but the economic downturn has been going on for more than a year (in the US — since the end of the third quarter of 2021).
Now big whales tell the same that we do. Some of Wall Street’s biggest names are throwing cold water on expectations that the U.S. economy will scrape through 2023 without a recession, even as hopes of easing inflation and resilient growth propel stocks higher. Banks and asset managers that have reiterated recession calls include BlackRock, Wells Fargo and Neuberger Berman, with many warning the Federal Reserve is unlikely to force inflation lower without hurting economic growth. The warnings contrast with signs of optimism in markets.
Many strategists are focused on the Fed, pointing to years of market history that suggests the central bank's rapid rate hikes will eventually force unemployment higher and tip the economy into a recession. The outlook of dovish Fed policy that rate peaks under 5% is not shared by BoFA’s strategists, who recommended positions that would benefit from a “grind lower” in U.S. equities, noting that Fed "cutting cycles in history have almost exclusively been associated with either a recession ... or a financial accident," they said.
Charlie McElligott, managing director of cross-asset strategy of Nomura Securities, believes the current rise in stocks is partially driven by under-positioned investors fearful of missing a longer-term shift to the upside, a dynamic that fueled several rallies last year. Those rebounds inevitably crumbled, leaving the S&P 500 with a 19.4% annual loss, its worst since 2008. The most recent rally has lifted the S&P 500 more than 11% from its October lows.
The current stock rally “hints at how markets will likely react once inflation eases and rate hikes pause,” wrote analysts at BlackRock, the world’s largest asset manager, earlier this week. “Before this outlook becomes reality, we see (developed market) stocks falling when recessions we expect manifest.”
Neuberger Berman sees the S&P 500 dropping to as low as 3,000 this year - a decline of nearly 25% from its current level - as rebounding inflation forces the Fed to become more aggressive.
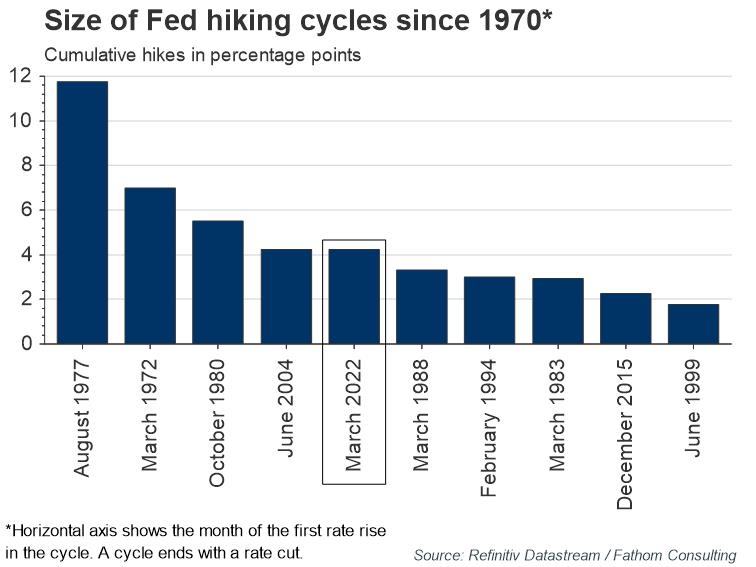
Interest rates have already increased substantially, with the Federal Reserve increasing rates by 425 basis points, the BoE by 340 basis points and the ECB by 250 basis points this cycle. There is a time lag from when interest rates increase until the full effects can be seen on economic activity. According to the ECB, the impact on inflation of a 1% increase in rates reaches its peak in the second year after the policy change. Therefore, interest rate hikes in 2022 will continue to affect economic activity into 2023 and beyond.
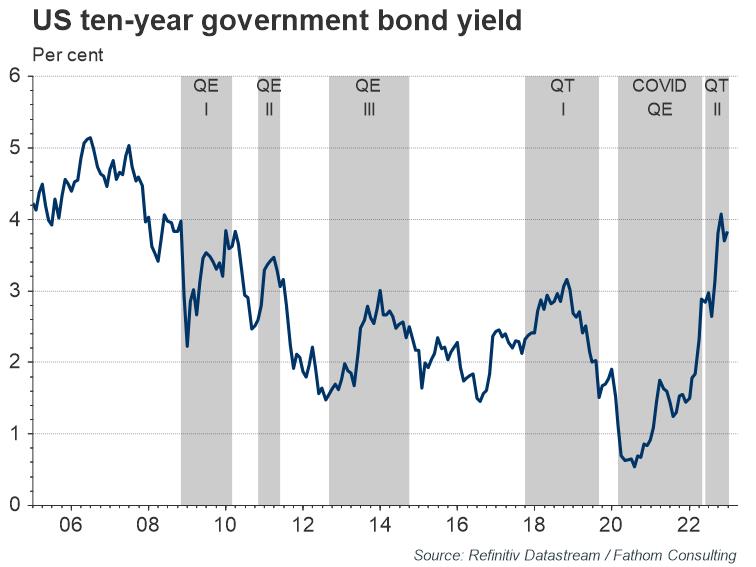
Effect of QT is also uncertain by far. So what progress has been made so far in tackling inflation? Survey data, mentioned above (mostly different PMI and sentiment indicators) has shown a steep decline in activity in the US, which could signal the onset of recession. Uncertainty regarding the effect of QT on the economy means that the terminal rate – the rate at which the policy rate will peak – remains difficult to identify. Inflation has peaked, but is still at a very high level.
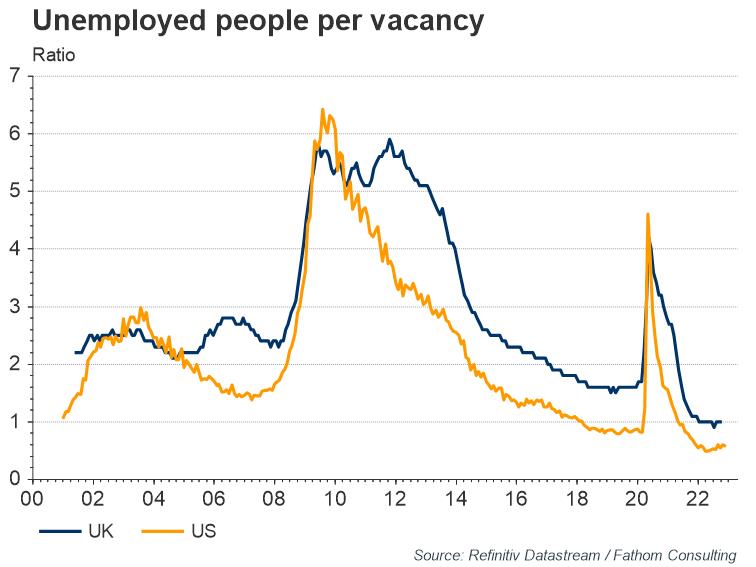
Moreover, there has been a vast decrease in unemployed people per vacancy in the UK and the US since the peak in April 2020, and current ratios show tight labour markets in historic terms. A tight labour market pushes up wage growth, which again puts upward pressure on inflation. Given these circumstances, and the fact that their credibility is at stake, Fathom believes that central banks are more likely to tighten too much – increasing interest rates and implementing QT – than too little in 2023.
Thus, here is what we've estimated on the US economy in recent few months, analyzing multiple indicators and statistics. In general we could say there are more and more signals of an approaching depression in the United States. No questions in the direction. The intrigue lies in the point of breakdown (what will be the trigger?) and the scale of the fall. So far, the United States has emerged victorious in the energy crisis, deftly maneuvering between crisis processes in 2022, without entering a stable recession.
The Fed began to reduce the balance sheet from June and raise rates from March 2022, bringing it to 4.5% by January 2023 (the maximum growth rate in 42 years). At the same time, the US budget deficit has been reduced significantly, practically minimizing helicopter money, which became the main excess and unsecured demand in 2020-2021.
Debt crisis and week demand on bond market in the US is compensated by record growth of corporate lending, which allows you to maintain investment activity at a relatively acceptable level. Household demand, generated by 70% of the US economy, is supported by depletion of savings to a historical minimum and abnormal lending rates. High credit activity in turn, became possible thanks to the unbinding of the banking sector from the internal contour of the Federal Reserve's PREP, when banks managed to partially ignore the Fed rate increase, having exceptionally cheap funding for deposits at rates well below 1%. But this is temporary.
The Fed's rate increase, albeit with a lag, will be translated into the economy, increasing the cost of debt servicing and dampening the credit impulse. The question here is, who will take off first? A heavily over-credited economy with a high concentration of toxic business with junk bonds obviously will not withstand such a stress test. There will be a reaction.
Recent GDP numbers structure shows that the demand for goods made a negative contribution of 0.1 percentage points, which is 1/3 of the turnover of the consumer sector. Services contributed 2 percentage points to the annual growth of the economy, i.e. we can say that the economy grew solely due to services, and all other components "worked" around breakeven.
The Conference Board LEI index for the United States declined by 1% in December 2022 after a 1.1% decline in November (10 months of decline). The index declined by 4.2% in the six-month period from June to December 2022 - a much sharper rate of decline than the 1.9% decline in the first half of 2022.
In 100% of cases, a decline in the index below 5% YoY led to a recession or crisis in the United States. Now the decline is 6%. A typical lag is 4-6 months, let's see…

Next week to watch
#1 China re-opening effect
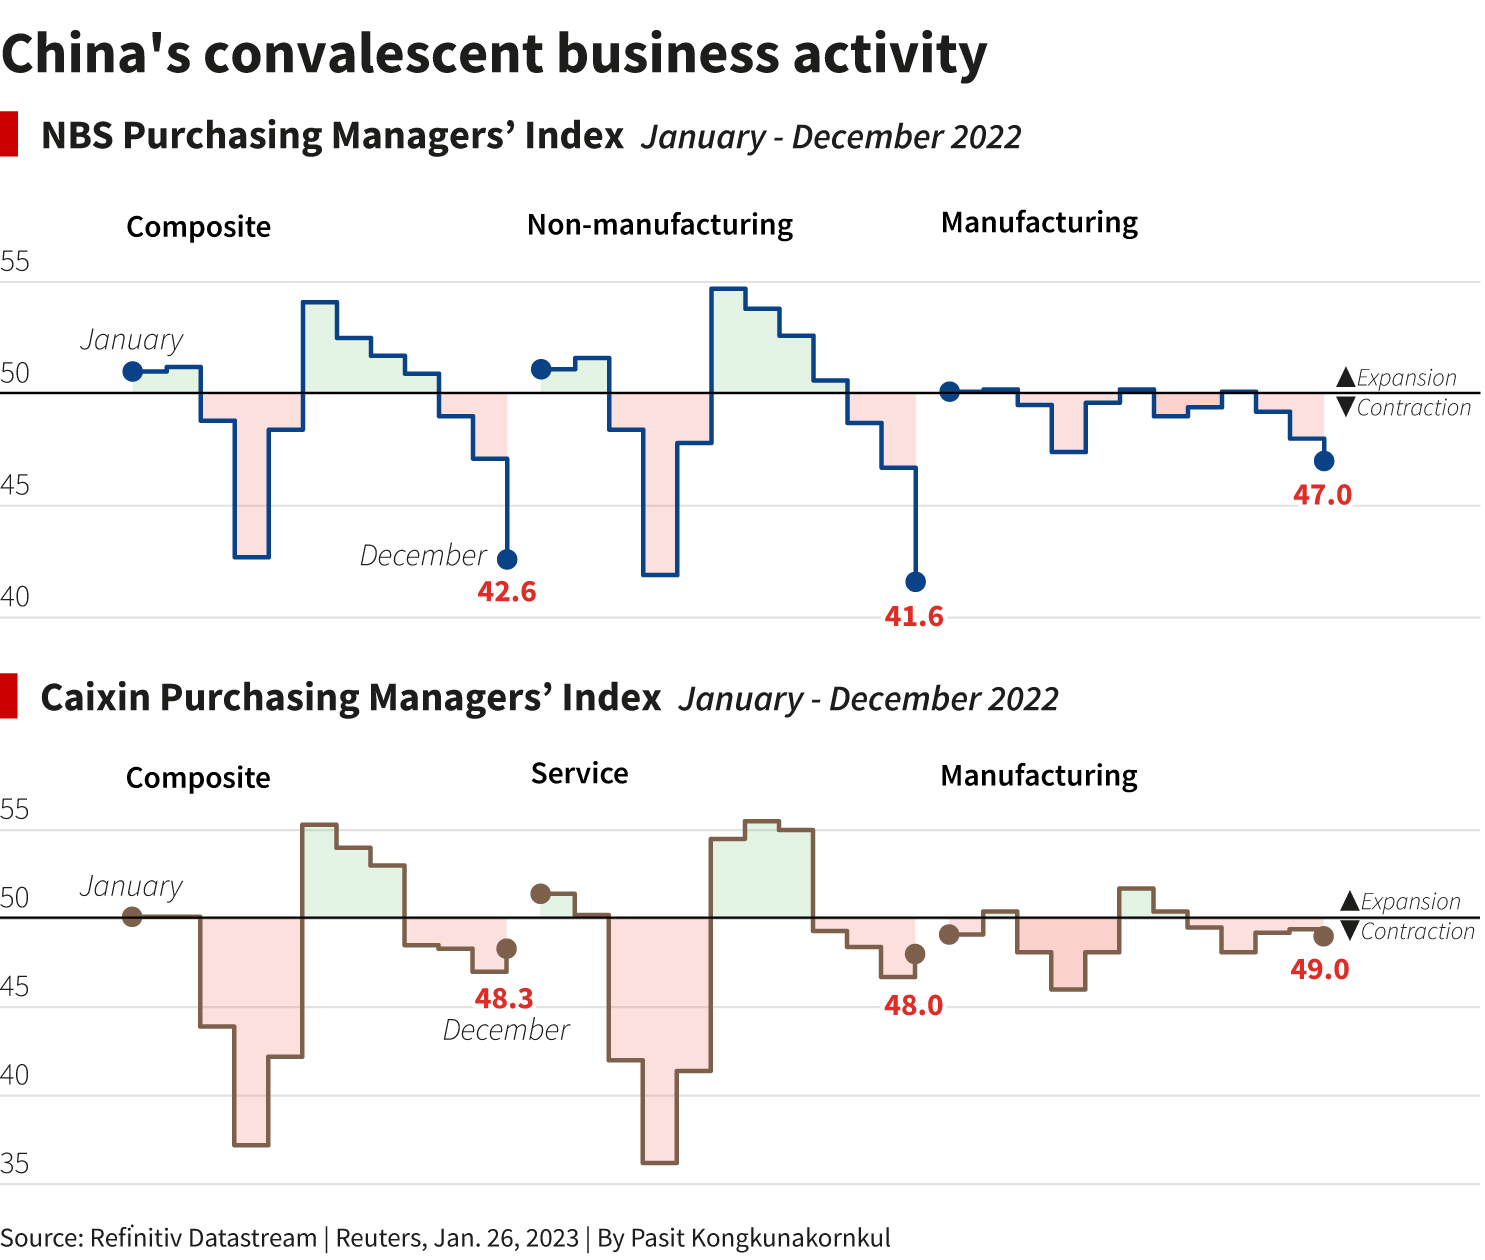
The impact of China's Great Reopening may show up in PMIs next Tuesday, with the services sector bouncing back to expansion. Manufacturing is likely still contracting, but that has a lot to do with the timing of the New Year holiday, and next month should see a strong rebound.
#2 ECB rate decision
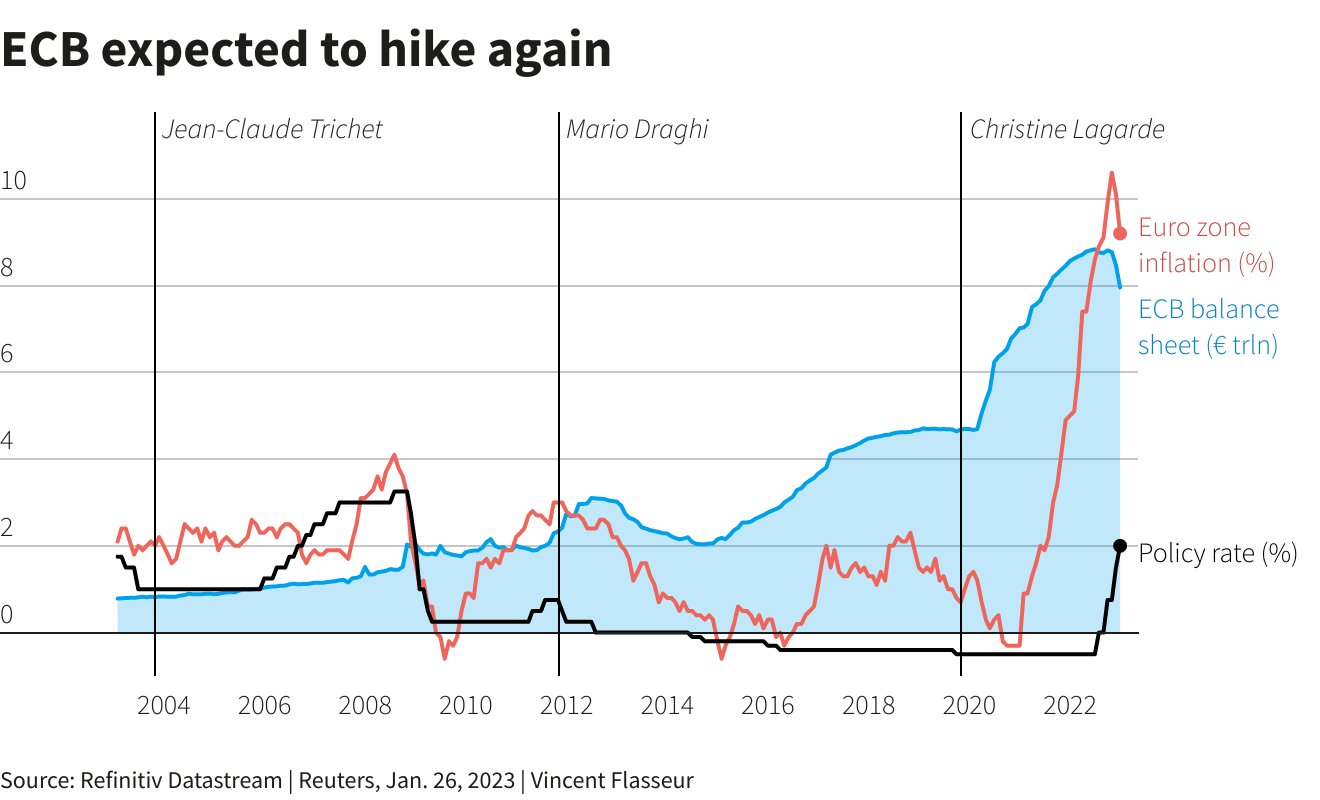
The ECB meets Thursday and is widely tipped to raise rates by 50 bps to 2.5%. Markets care most about what happens next and that's not clear. Futures price in a further 100 bps worth of tightening between now and July. Amundi reckons ECB rates could reach 4%. Markets, whipped around by the differing opinions, will be looking for the ECB to speak with one voice. That, at least, is the hope.
#3 BoE interest rates decision
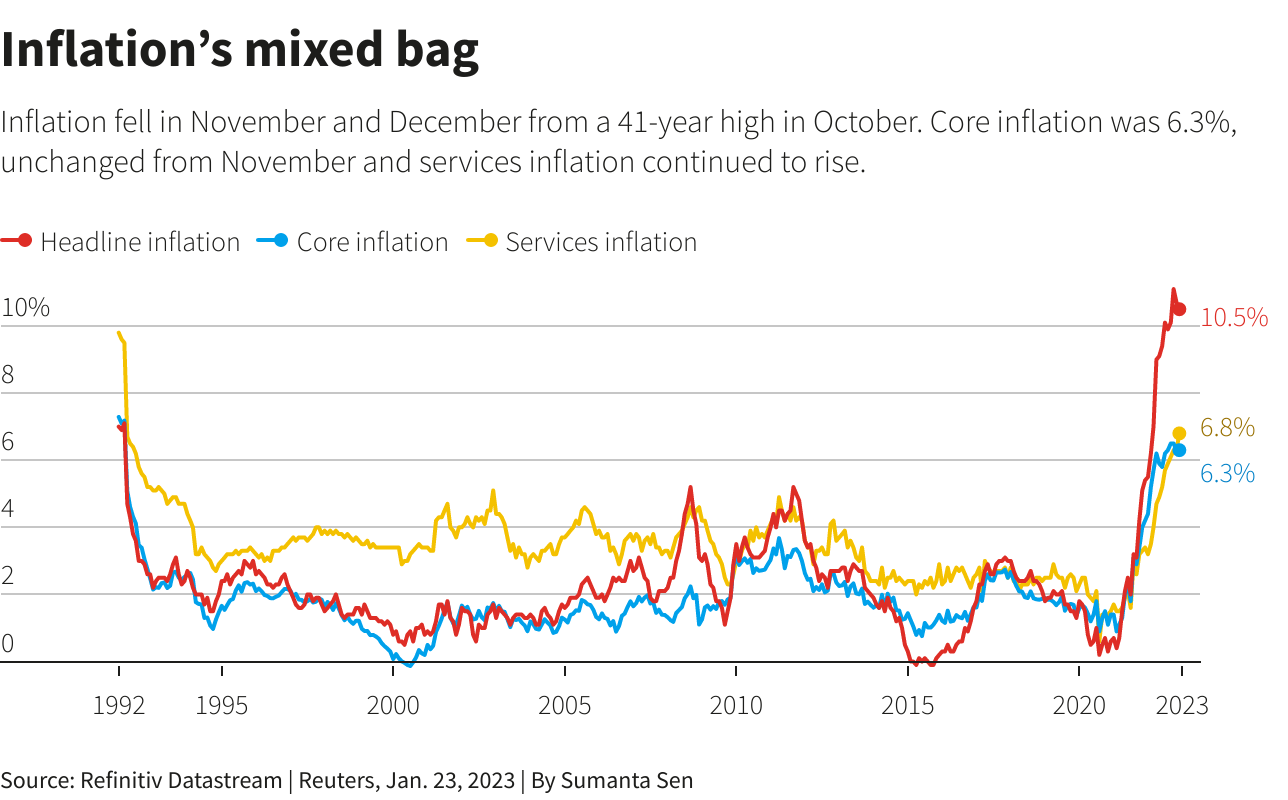
The Bank of England, the first of the major central banks to turn hawkish, is expected to deliver its tenth rate hike since December 2021. Money markets predict the BoE will raise rates by 0.5 percentage points to 4%. Headline inflation moderated in December to 10.5%, but it's still over five times the Bank's official target.
#4 Fed move
Will the Federal Reserve tone down its hawkish rhetoric in the face of cooling inflation or stick to its guns? Investors widely expect a 25-basis point rate increase at the Feb. 1 meeting and for rates to stop short of hitting 5%. Fed officials, however, have indicated they expect the key policy rate to top out at 5.00-5.25% this year.
Whatever signals the Fed sends could play an importing role in determining the longevity of the rally so far this year. Dollar bears, meanwhile, will watch for dovish leanings that could further accelerate a decline in the greenback.
Conclusion:
This time, guys we've tried to show you opinions of big analysts, and put some bottom line to our long-term research that we've started in the beginning of 2022. Our following of big bulk of indicators has let us to show you the structure and the shape of current crisis events in the US economy. Also we were able to identify some "painful" points which we intend to monitor. As you could see, many other analysts tell the same things that we do, warning about high inflation for longer time, recession and drop of the stock market. Data that we've shown you today just confirms this. Investors are wind-headed about this, because they are too focused on current rally and some happiness makes you to be blind and do not see warning signs around.
It means that first recession signs will make spook effect on markets and could boost demand for the US dollar as it happened many times already. So, we think it is too early to speak about global bullish reversal of major long-term EUR/USD tendency.
This week we've got some important data, including GDP, PCE index which were more or less positive. And now investors are gambling on perspectives. Could we treat these numbers, together with peaked inflation and stable NFP as a sign that worst things stand behind now? If even recession is not totally avoided yet, could we hope on softer way, maybe in some way of stagnation in the economy? Indeed, we see that many problems have lighter impact on EU and US economy which initially were seemed like absolutely devastating. But the problem here that modern statistics measures are too complicated, have different time lags and complex relation to each other that makes very difficult to understand what is really going on...
Market overview
World stocks rallied and the dollar edged up from eight-month lows on Friday as slowing inflation data raised hopes the Federal Reserve can engineer an economic soft landing and reduce its pace of aggressive monetary tightening next week.
U.S. consumer spending fell for a second straight month in December, a Commerce Department report said, which also showed the smallest gain in personal income in eight months that partly reflected moderate wage growth - booth good signs for inflation. U.S. consumer spending fell for a second straight month in December, putting the economy on a lower growth path heading into 2023, while inflation continued to subside, which could give the Federal Reserve room to further slow the pace of its interest rate hikes next week.
The most interesting guys, that this is "nominal" spending, which follows 2nd month in a row. If we exclude CV-19 drop, last time this happened 10 years ago. Now imagine what has happened with "real" spending, if even nominal ones are falling.

"Hammered by higher prices and borrowing costs, and feeling less wealthy, U.S. households are cutting back, and will likely contribute to a contraction in GDP in the first quarter," said Sal Guatieri, a senior economist at BMO Capital Markets in Toronto. "The good news is that they are also pushing back against price hikes, which will help the Fed tackle inflation and limit further rate hikes."
Consumer spending, which accounts for more than two-thirds of U.S. economic activity, dropped 0.2% last month. Data for November was revised lower to show spending slipping 0.1% instead of gaining 0.1% as previously reported. Economists polled by Reuters had forecast consumer spending dipping 0.1%.
Spending on long-lasting manufactured goods like motor vehicles, recreational goods and household furniture and equipment decreased 1.9%. Durable goods spending plunged 3.0% in November. Spending on nondurables like clothing and footwear declined 1.4% last month.
Though growth in spending on services is helping to anchor consumption, some households, especially those with lower incomes, have depleted savings accumulated during the COVID-19 pandemic, limiting the scope of gains.
So, recent data confirms everything that we've said on this subject through 2022 year...Adjusting for inflation, consumer spending fell 0.3% in December, the biggest decline in a year, after decreasing 0.2% in November. This puts consumer spending on a lower growth base at the start of the first quarter.
With personal income rising 0.2%, the smallest gain since April, after increasing 0.3% in November, the outlook for spending is uncertain.

"We estimate households still have about nine months of spending power if they continued to draw down excess saving at the pace they have the past six months," said Tim Quinlan, a senior economist at Wells Fargo in Charlotte, North Carolina.
Traders of futures tied to the Fed's policy rate kept bets on Friday that the U.S. central bank will raise interest rates just once more beyond next week's widely expected quarter-point hike before stopping. The current target range is 4.25% to 4.5%.
The dollar edged higher against the euro on Thursday after data showed the U.S. economy maintained a strong pace of growth in the fourth quarter, backing the case for the U.S. Federal Reserve to maintain its hawkish stance for longer. Gross domestic product increased at a 2.9% annualised rate last quarter, the Commerce Department said in its advance fourth-quarter GDP growth estimate. The economy grew at a 3.2% pace in the third quarter.
A separate report from the Labor Department showed initial claims for state unemployment benefits dropped 6,000 to a seasonally adjusted 186,000 for the week ended Jan. 21.
"A somewhat mixed picture painted by the U.S. data," said Stuart Cole, head macro economist at Equiti Capital in London. The data point to an economy that is continuing to show resilience in the face of the rapid monetary tightening so far delivered by the Fed. But a big contributor to this growth story was inventories, a component that is almost certain to weaken as we go through 2023. I think it reinforces the expectation of the Fed moving to 25 basis points moves now," Cole said.
So, with headline and core inflation now slowing, it seems as if the worst of the first-round inflationary shocks are probably over. Investors concur, with positive returns on bonds and equities so far this year, and lower market-implied risks of crises. Nevertheless, Fathom’s central forecast is still that the UK, euro area (EA) and the US will experience mild recessions in the coming year.
Other analysts tell man same things that we do. Economic activity in the world’s major industrialised countries held up better than expected last year. With China’s economy now reopening and European gas prices on the retreat, the mood music seems to be shifting into a more positive key. Indeed, last week in Davos the head of the IMF, Kristalina Georgieva, noted that the outlook was “less bad” than feared a few months ago. But while these are positive developments, observers should not get carried away. One reason for the resilience seems to have been households using their pandemic-related savings, a source of demand that cannot continue indefinitely. Moreover, although headline inflation has been falling in some places, core inflation remains stubbornly high; central banks appear likely to make further, demand-reducing increases in interest rates. Last week’s Empire State manufacturing survey also provides a reminder that business activity and sentiment remain very weak in some places.

At the same time, now we see that deteriorating processes accelerate in some US states. For example, Chicago business activity is negative for the 2nd month in a row:
If we exclude CV19 outbreak, then Richmond FRB reports on worst in 10 years production index, and 8 month of decreasing in service sector. Richmond FRB manufacturing 4th month decrease in a row. And US Leading indicators are dropping nine month in a row:
So, we see a typical picture of a structural crisis. For example, in the United States, the main problems from the inflationary sphere gradually moved to the construction sector, and now is spreading over whole industrial production. In other regions of the world, there are also problems in industry, retail sales are also falling, which indicates a reduction in household income (recall that household spending is about 70% of GDP in the US).
As we've mentioned above, personal income in nominal terms is falling in the United States — this is because methodology for estimating inflation, adopted today in the world, systematically underestimates it. If even nominal incomes are falling, then what can we say about real ones. The situation with GDP is similar in almost all countries: the official recession may not even begin, but the economic downturn has been going on for more than a year (in the US — since the end of the third quarter of 2021).
Now big whales tell the same that we do. Some of Wall Street’s biggest names are throwing cold water on expectations that the U.S. economy will scrape through 2023 without a recession, even as hopes of easing inflation and resilient growth propel stocks higher. Banks and asset managers that have reiterated recession calls include BlackRock, Wells Fargo and Neuberger Berman, with many warning the Federal Reserve is unlikely to force inflation lower without hurting economic growth. The warnings contrast with signs of optimism in markets.
“Money is dying to get back into this market but we still think you get an economic slowdown and that earnings expectations are still too high,” said Paul Christopher, head of global investment strategy at the Wells Fargo Investment Institute.
Many strategists are focused on the Fed, pointing to years of market history that suggests the central bank's rapid rate hikes will eventually force unemployment higher and tip the economy into a recession. The outlook of dovish Fed policy that rate peaks under 5% is not shared by BoFA’s strategists, who recommended positions that would benefit from a “grind lower” in U.S. equities, noting that Fed "cutting cycles in history have almost exclusively been associated with either a recession ... or a financial accident," they said.

Charlie McElligott, managing director of cross-asset strategy of Nomura Securities, believes the current rise in stocks is partially driven by under-positioned investors fearful of missing a longer-term shift to the upside, a dynamic that fueled several rallies last year. Those rebounds inevitably crumbled, leaving the S&P 500 with a 19.4% annual loss, its worst since 2008. The most recent rally has lifted the S&P 500 more than 11% from its October lows.
"You are now getting the disinflationary impulse that the Fed has been seeking and it's moving ahead of schedule," he said. "Now the challenge is that people are under-positioned and are ... absolutely being forced into a painful trade because the Fed hasn't won the fight yet."
The current stock rally “hints at how markets will likely react once inflation eases and rate hikes pause,” wrote analysts at BlackRock, the world’s largest asset manager, earlier this week. “Before this outlook becomes reality, we see (developed market) stocks falling when recessions we expect manifest.”
Neuberger Berman sees the S&P 500 dropping to as low as 3,000 this year - a decline of nearly 25% from its current level - as rebounding inflation forces the Fed to become more aggressive.
"You need that kind of decline in stock prices to neutralize the wealth effect that is the source of inflation," said Raheel Siddiqui, a senior research analyst in the firm's global equity research division.
Interest rates have already increased substantially, with the Federal Reserve increasing rates by 425 basis points, the BoE by 340 basis points and the ECB by 250 basis points this cycle. There is a time lag from when interest rates increase until the full effects can be seen on economic activity. According to the ECB, the impact on inflation of a 1% increase in rates reaches its peak in the second year after the policy change. Therefore, interest rate hikes in 2022 will continue to affect economic activity into 2023 and beyond.
Effect of QT is also uncertain by far. So what progress has been made so far in tackling inflation? Survey data, mentioned above (mostly different PMI and sentiment indicators) has shown a steep decline in activity in the US, which could signal the onset of recession. Uncertainty regarding the effect of QT on the economy means that the terminal rate – the rate at which the policy rate will peak – remains difficult to identify. Inflation has peaked, but is still at a very high level.

Moreover, there has been a vast decrease in unemployed people per vacancy in the UK and the US since the peak in April 2020, and current ratios show tight labour markets in historic terms. A tight labour market pushes up wage growth, which again puts upward pressure on inflation. Given these circumstances, and the fact that their credibility is at stake, Fathom believes that central banks are more likely to tighten too much – increasing interest rates and implementing QT – than too little in 2023.

Thus, here is what we've estimated on the US economy in recent few months, analyzing multiple indicators and statistics. In general we could say there are more and more signals of an approaching depression in the United States. No questions in the direction. The intrigue lies in the point of breakdown (what will be the trigger?) and the scale of the fall. So far, the United States has emerged victorious in the energy crisis, deftly maneuvering between crisis processes in 2022, without entering a stable recession.
The Fed began to reduce the balance sheet from June and raise rates from March 2022, bringing it to 4.5% by January 2023 (the maximum growth rate in 42 years). At the same time, the US budget deficit has been reduced significantly, practically minimizing helicopter money, which became the main excess and unsecured demand in 2020-2021.
Debt crisis and week demand on bond market in the US is compensated by record growth of corporate lending, which allows you to maintain investment activity at a relatively acceptable level. Household demand, generated by 70% of the US economy, is supported by depletion of savings to a historical minimum and abnormal lending rates. High credit activity in turn, became possible thanks to the unbinding of the banking sector from the internal contour of the Federal Reserve's PREP, when banks managed to partially ignore the Fed rate increase, having exceptionally cheap funding for deposits at rates well below 1%. But this is temporary.
The Fed's rate increase, albeit with a lag, will be translated into the economy, increasing the cost of debt servicing and dampening the credit impulse. The question here is, who will take off first? A heavily over-credited economy with a high concentration of toxic business with junk bonds obviously will not withstand such a stress test. There will be a reaction.
Recent GDP numbers structure shows that the demand for goods made a negative contribution of 0.1 percentage points, which is 1/3 of the turnover of the consumer sector. Services contributed 2 percentage points to the annual growth of the economy, i.e. we can say that the economy grew solely due to services, and all other components "worked" around breakeven.
The Conference Board LEI index for the United States declined by 1% in December 2022 after a 1.1% decline in November (10 months of decline). The index declined by 4.2% in the six-month period from June to December 2022 - a much sharper rate of decline than the 1.9% decline in the first half of 2022.
In 100% of cases, a decline in the index below 5% YoY led to a recession or crisis in the United States. Now the decline is 6%. A typical lag is 4-6 months, let's see…
Next week to watch
#1 China re-opening effect
The impact of China's Great Reopening may show up in PMIs next Tuesday, with the services sector bouncing back to expansion. Manufacturing is likely still contracting, but that has a lot to do with the timing of the New Year holiday, and next month should see a strong rebound.

#2 ECB rate decision
The ECB meets Thursday and is widely tipped to raise rates by 50 bps to 2.5%. Markets care most about what happens next and that's not clear. Futures price in a further 100 bps worth of tightening between now and July. Amundi reckons ECB rates could reach 4%. Markets, whipped around by the differing opinions, will be looking for the ECB to speak with one voice. That, at least, is the hope.

#3 BoE interest rates decision
The Bank of England, the first of the major central banks to turn hawkish, is expected to deliver its tenth rate hike since December 2021. Money markets predict the BoE will raise rates by 0.5 percentage points to 4%. Headline inflation moderated in December to 10.5%, but it's still over five times the Bank's official target.

#4 Fed move
Will the Federal Reserve tone down its hawkish rhetoric in the face of cooling inflation or stick to its guns? Investors widely expect a 25-basis point rate increase at the Feb. 1 meeting and for rates to stop short of hitting 5%. Fed officials, however, have indicated they expect the key policy rate to top out at 5.00-5.25% this year.
Whatever signals the Fed sends could play an importing role in determining the longevity of the rally so far this year. Dollar bears, meanwhile, will watch for dovish leanings that could further accelerate a decline in the greenback.

Conclusion:
This time, guys we've tried to show you opinions of big analysts, and put some bottom line to our long-term research that we've started in the beginning of 2022. Our following of big bulk of indicators has let us to show you the structure and the shape of current crisis events in the US economy. Also we were able to identify some "painful" points which we intend to monitor. As you could see, many other analysts tell the same things that we do, warning about high inflation for longer time, recession and drop of the stock market. Data that we've shown you today just confirms this. Investors are wind-headed about this, because they are too focused on current rally and some happiness makes you to be blind and do not see warning signs around.
It means that first recession signs will make spook effect on markets and could boost demand for the US dollar as it happened many times already. So, we think it is too early to speak about global bullish reversal of major long-term EUR/USD tendency.