Sive Morten
Special Consultant to the FPA
- Messages
- 18,654
In your weekly update, you stated that "since this is first pullback after solid move down – it can’t last forever, even more - it should turn to deep retracement – 0.618 at minimum, now this is 1.2860."
However, I see our NEAREST K-Area is on H4 @ 1.3000 - 1.3012. IF the scenario you stated were to happen, I just want to know from your experience how would market react at the K-Area since you anticipate market to fall to lower than K-Area? Would market pullback a bit and maybe consolidate for a day and then fall down? How does K-Area usually react when a bearish pattern or bullish pattern tells us that it could go FARTHER than K-Area?
Since this move down will happen mostly by weekly directional pattern (B&B "Sell") minimum target is 0.618 support level. But this will not exclude possible respect of 4-hour K-area or areas. But probably this respect will be seen only on intraday charts. On daily time frame we will hardly see it.
In DiNapoli book, it stated that the 61.8 and 38.2 that makes up the K-Area should be relatively "close." I just want to know if you allow a bigger gap in higher timeframes? Let's say you allow a 20 pip gap between 61.8 and 38.2 on 1 hr TF. Would you also use the same 20 pip for a weekly or daily TF?
Of cause not. This distance will be wider as higher time frame will be. This is mostly experience issue since DiNapoli does not give any fix number. They have to stay relatively tight visiually. For example this K-area that I've shown you on weekly time frame looks a bit wide. There is about 150 pips. But the same 150 pips looks fine on monthly/quaterly chart. 10-15 pips will be probable acceptable for hour chart, but this is not mean that 16 pips will be unacceptable. This is a bit flexible substance - and that is perfect, since it's a bit hard to programm.
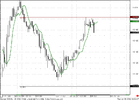
Initially I take a look at all reactions and levels, but then I choose only most significant and important and show them on chart. If I will show all levels - chart will be overloaded and difficult to analyze.Lastly, in your 4HR chart, it seems like you only took Fibonacci from Reaction 3, 2, and 1. Why did you exclude Reaction Points 5 and 4? Were they cancelled because market broke through those levels? Attached is your 4HR chart but I labelled it for easier understanding.
Thanks a lot, Sive! Take care!